
Needs-Based Segmentation: A Step-by-Step Guide For Startups
“Needs-based segmentation is the process of grouping people by the problem they most want solved, rather than by what they look like on paper. Every founder, investor and startup ‘expert’ will tell you to pick a target customer segment and solve a burning unmet need, then offer nothing more practical than “Go talk to your customers.””
So here's the version with actual steps in it: seven of them, run on real quantitative data, using the same process I've used on hundreds of research projects.
Key insights
Descriptive traits can't tell you why anyone bought. That's the gap needs data fills, and it's why this is the strongest segmentation you can put in front of a strategy conversation.
Almost nobody publishes how to actually do it. The topic is owned by agency sales pieces that define the term and stop there.
It can't stand on its own. Needs data with no descriptive layer on top gives you segments you can't identify, reach or sell to.
There are two routes in, and picking one is a maths decision. Descriptive-first buckets people first, then ranks each bucket's needs. Needs-first ranks everything, then works out which descriptor predicts which need, which takes discriminant analysis.
Interviews surface the problems. Measurement tells you which of them matter and how many people they affect. Skip either half and you're guessing.
The 'activity of focus' decides the quality of everything downstream. "What's your biggest pain at work?" and "What frustrates you about managing your CRM?" return completely different research.
People rank problems more reliably than they rank needs. A need sits one layer of abstraction above a problem, so write problems, in first person, one per statement.
Rating scales let people score everything a seven. Pairwise comparison forces the trade-off, scales to lists that drag-and-drop ranking can't handle, and hands you an order you can act on.
Your statement list will be incomplete, so let participants add to it. Crowdsourced statements land in the top three often enough that a closed list costs you the finding.
The two questions I'll focus on, which the other articles on this topic fail to answer, are:
How do you find out what people's most important needs are, using real quantitative data?
How do you then use that needs data to create segments that are actually actionable for your business?
Note: I'm the co-founder of OpinionX, a research tool that helps you discover and rank people's needs. This post is based on what we've learned growing OpinionX to more than 60,000 workspaces around the world, but you're welcome to take these recommendations and apply them on any tool of your choosing.
What is needs-based segmentation?
Needs-based segmentation is the process of identifying groups of people based on their shared experience of a specific problem or need.
Like other forms of customer segmentation, it looks for factors you can use to split people into groups you can then describe and target separately. Most people experience several needs at once, so it's worth thinking about it as a way of grouping people by their highest priority need: the problem they're most intent on solving, or the one having the biggest impact on them.
The term comes out of the market segmentation literature that starts with Wendell Smith's 1956 paper in the Journal of Marketing, which set out segmentation as a strategy for dealing with genuinely different demand inside one market. The modern version of the same idea is Clayton Christensen's Jobs to Be Done, which defines a job as "the progress that a person is trying to make in a particular circumstance". This method is how you find out which progress matters most, to whom, at scale.
What do people get wrong about needs-based segmentation?
I read every article ranking on the first few pages of Google for this term. The same mistakes keep coming up.
The people writing about this usually have no idea how to actually do it. That sounds like an absurd claim, but only two of the articles I read offered any recommendation on running your own project. Every other one is a sales piece for a research agency.
It doesn't need to be expensive or complicated. The companies commissioning these projects today are mostly large enterprises, and they often have to lean on the same results for two to five years because of what the work costs them. As this guide will show, you can run it yourself without commissioning an agency project at all.
It isn't reliable unless it has both qualitative and quantitative data. Understanding people's needs is inherently people-based; you have to interview people, collect quotes from them, and get properly into their perspective to understand the range of problems they face. But unless you can layer measurable data over those needs, you'll be left guessing which ones matter most and how many people each one affects. That's why mixed methods research matters here.
It can't exist on its own. Unless you're dealing with academic theory, you need to combine a needs-based approach with another form of segmentation, or your segments won't be identifiable or addressable. Here are the types you can combine it with.
What are the 3 types of customer segmentation?
| Type | What it groups on | Where the data comes from | What it can't tell you |
|---|---|---|---|
| A priori | Descriptive traits you already hold | CRM, billing, signup forms, enrichment | Why anyone bought |
| Value-based | Financial value per customer | Revenue and usage data | Why anyone bought |
| Needs-based | The problem someone most wants solved | Research you run | Who those people are, until you layer a descriptor on top |
A priori segmentation
This confusing Latin term just means "stuff you already know". It's a broad umbrella for the data you've probably already got on your target customers:
Demographic: age, gender, education, job title
Geographic: continent, country, urban vs rural
Psychographic: lifestyle, interests, social status (there's a full guide to psychographic segmentation if that's the one you're leaning on)
Firmographic: company size, industry category, growth
Behavioural: purchase frequency, content engagement, customer journey stage
Value-based segmentation
Not to be confused with people's personal values, which fall under psychographic. Value here means financial value. The data you use should line up with how you measure revenue in your company: monthly recurring revenue, average purchase size, seats on the account, average product usage per billing period, and so on.
Needs-based segmentation
The other two types group customers on visible data points, and that descriptive data often has little to do with why someone bought or what value they get. This one goes after the pain points, problems, motivations and ambitions driving customer behaviour instead. It's the strongest form of segmentation you can use to inform team or company strategy, and it's been the hardest to run, which is why so few teams have one.
Which approach should you use: descriptive-first or needs-first?
This method is never the only one used when creating customer segments. If you grouped people by needs without layering any descriptive data on top, you'd have no way to identify or target the segments you'd created.
So you combine it with one of the descriptive types, using one of two approaches.
| Descriptive-first | Needs-first | |
|---|---|---|
| Order of work | Bucket people by descriptive data, then rank each bucket's needs | Rank all needs across the sample, then find which descriptor predicts each one |
| Maths involved | Filtering and comparison | Discriminant analysis |
| Who can run it | A product or research team, unaided | Usually needs someone comfortable with multivariate statistics |
| Best when | You already know how you describe a good customer | You suspect your existing descriptors are wrong |

^ Click here to view this graphic in full screen
Descriptive-first is far less complicated mathematically, and it's the approach I'll use for the rest of this guide.
What are the 7 steps to creating needs-based segments?
Descriptive Distinctions
Value Buckets
Activity of Focus
Statement Storming
Stack Ranking
Crowdsource Your Gaps
Filter By Descriptor
Note: I'll explain these seven steps using examples and screenshots from OpinionX, since it's built specifically for ranking people's needs and creating needs-based segments. Apply the same steps on whatever tool you like.
Step #1: Descriptive Distinctions
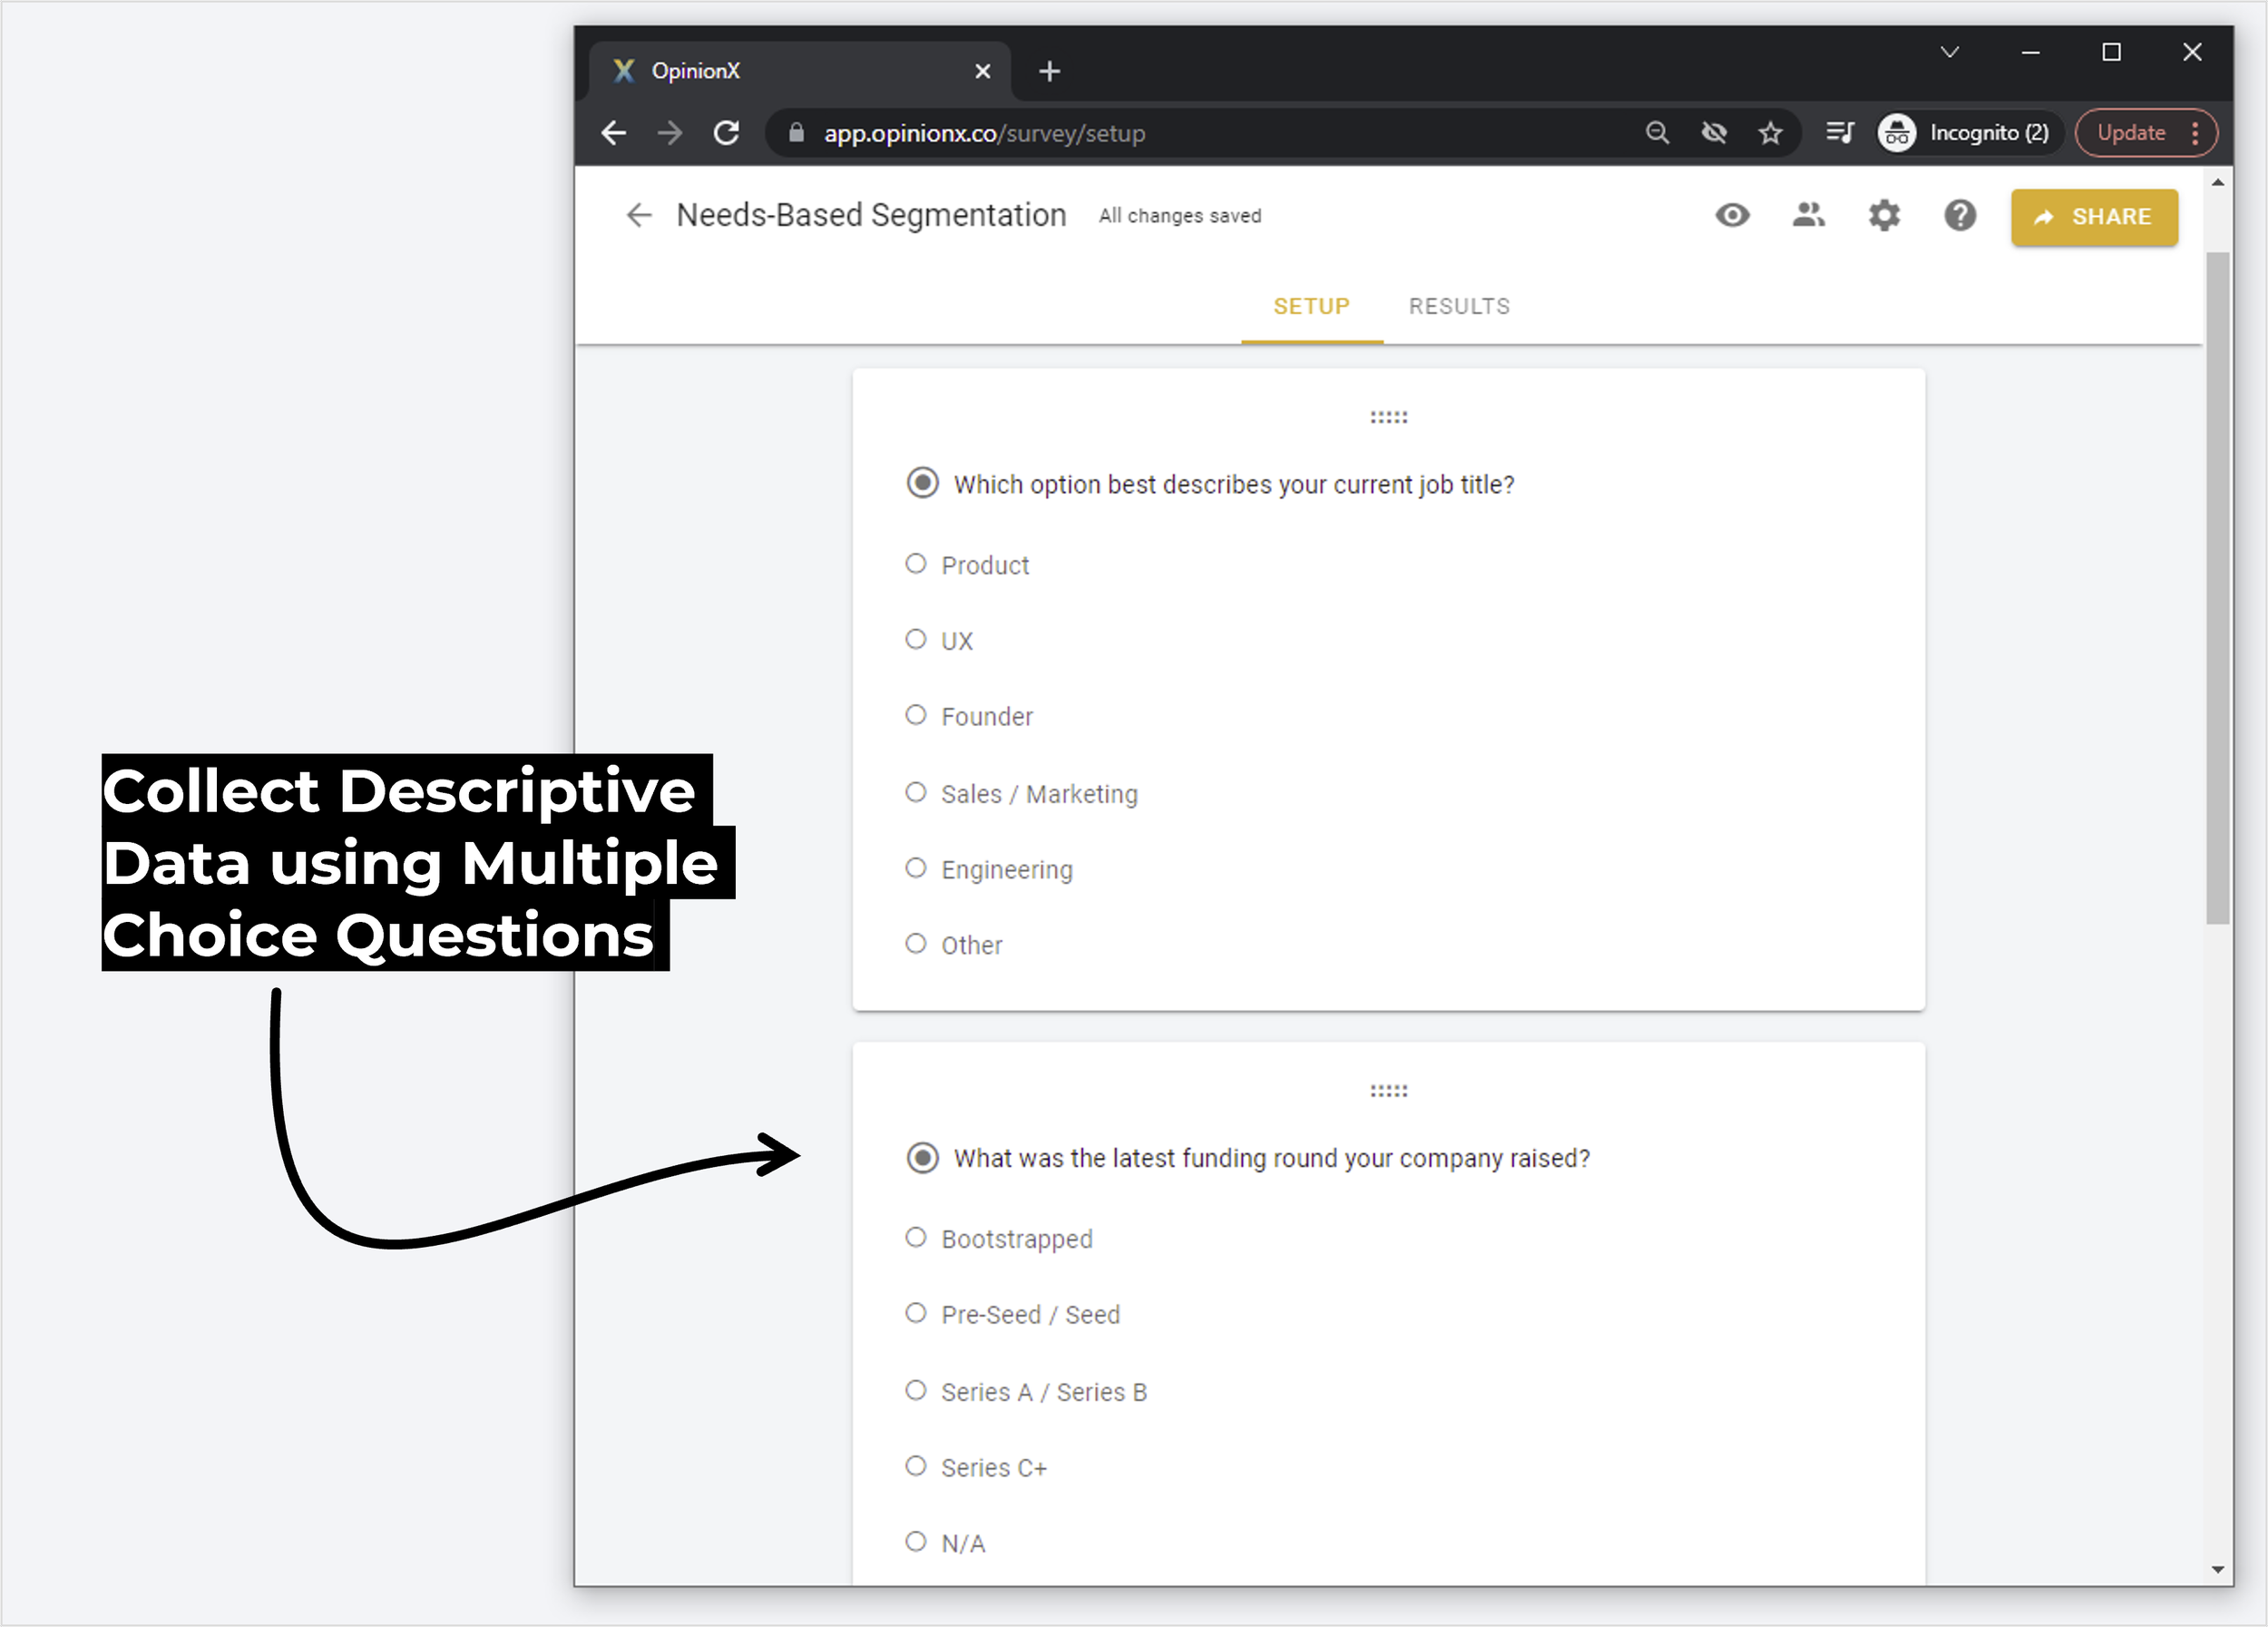
Start with how you already describe your ideal customer. For B2C products, you've probably got demographic criteria like age, gender and family status. For B2B products, you're probably using firmographics like industry and funding stage alongside 'professional demographics' like job title and seniority.
At OpinionX, the two data points most predictive of good customers for us are job title and company funding stage. We focus on scaling companies around Series A and B, because they tend to have the perfect use case for our product: expanding quickly into new territories, product categories and customer segments, where they need solid data fast to inform prioritisation decisions. Within those companies, people in product and UX roles are the ones most likely to turn into happy customers who keep coming back.
If you already have users, splitting your CRM into two lists, 'happy customers' and 'churned leads', then describing both groups in broad demographic or firmographic terms, will hand you some candidate descriptors to test in the later steps.
When you collect this data, use multiple-choice questions rather than free text. It filters out unwanted answers and keeps your segments homogeneous when you get to analysis.
Step #2: Value Buckets
How do you group your customers into buckets by financial value? (If you're doing this for something that doesn't have customers yet, skip to Step #3.) One look at your pricing page usually gives you the answer.
If you sell tiered subscriptions, add a segmenting question like "Which pricing plan are you currently on?". Later, at the analysis step, that lets you see the top needs for each of your price cohorts. It's the same question we ask across our own free and paid tiers, and our pricing is simple enough that the answer takes one click.
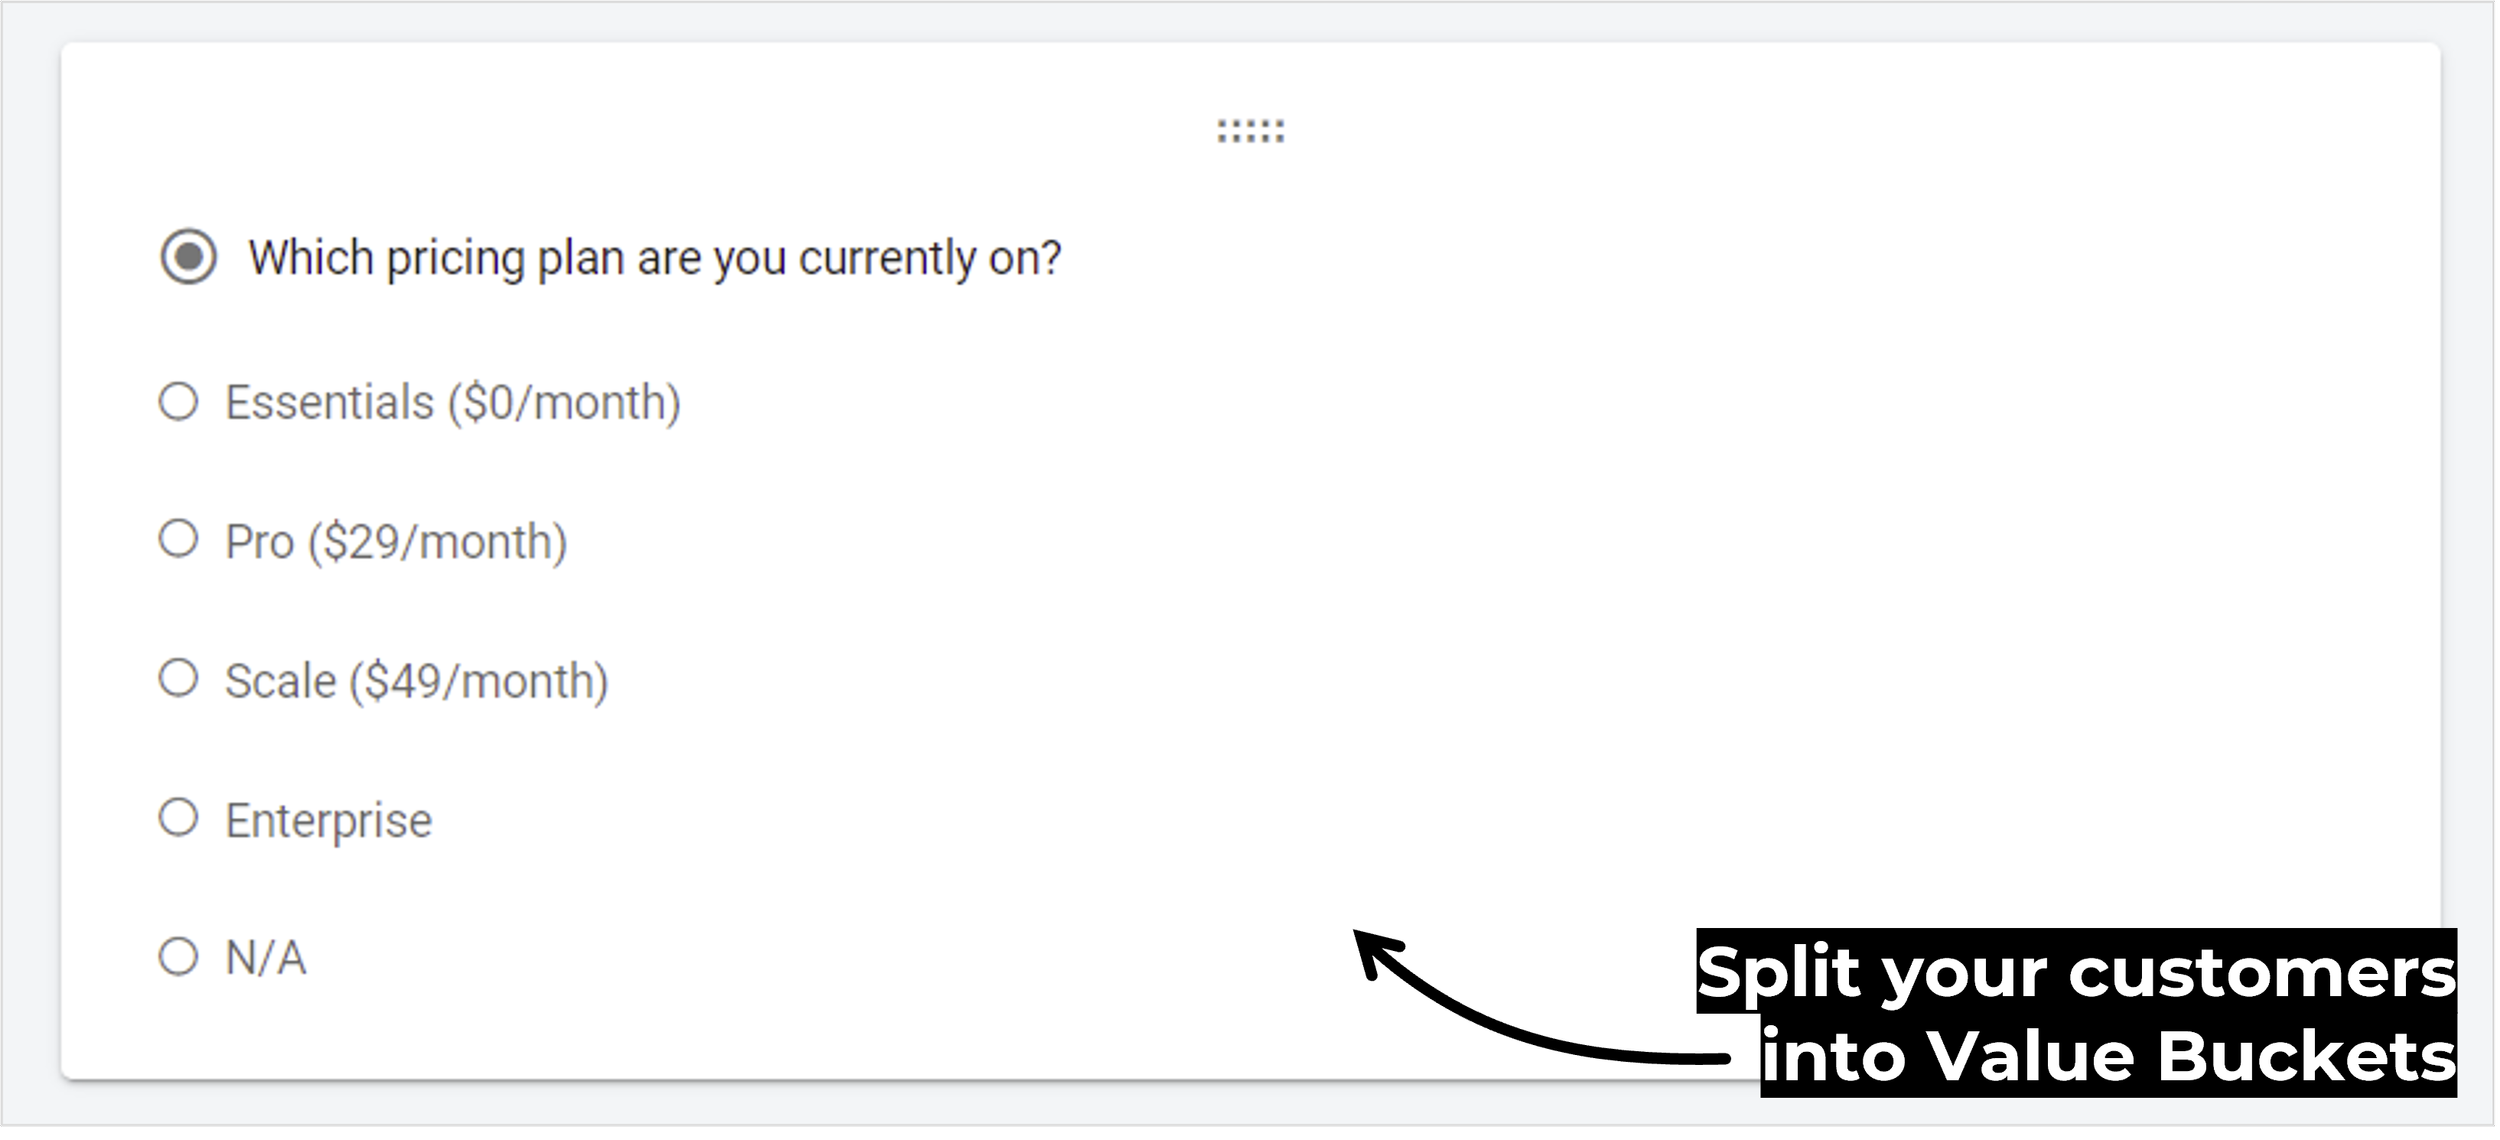
If your pricing model isn't subscription-based, use the best grouping you can that reflects how you measure revenue per customer. Ecommerce might use average order value or purchase frequency. An infrastructure platform might use usage buckets like credits spent per month. Whatever you pick, make sure it mirrors your pricing model.
Step #3: Activity of Focus
If you want to understand someone's highest priority needs, you first have to give them context about which set of needs to consider. If I asked you "What's your biggest pain at work each week?", I'd get a very different answer to "What's your biggest frustration when it comes to managing your CRM?".
There are a few ways to set the activity of focus:
Product category: focus on competitive alternatives to understand frustrations and shortcomings (e.g. frustrations with CRMs)
Occasion: use a specific event or recurring circumstance to understand needs that extend beyond product offerings (e.g. challenges at financial year-end)
Use case: understand the priorities a customer has throughout the use case you target (e.g. difficulties running performance reviews)
Existing usage: engage current customers to understand which needs your product addresses, or why they tried it in the first place
In every one of those examples, the activity of focus has to become a question. To rank the needs of each segment we're going to use pairwise comparison, which shows someone a pair of needs statements and asks them to pick the one they feel strongest about (covered in Step #5). So use a question format like: "Which is a bigger pain when trying to manage your product roadmap?" and replace the italicised part with your own activity of focus.
Step #4: Statement Storming
This always starts with qualitative roots. To segment by needs, you first need to know what people's needs are. Statement Storming just means shortlisting the needs that came up most during your discovery research: quotes from user interviews and onboarding calls, phrases from feature requests, insights from secondary research and observation.
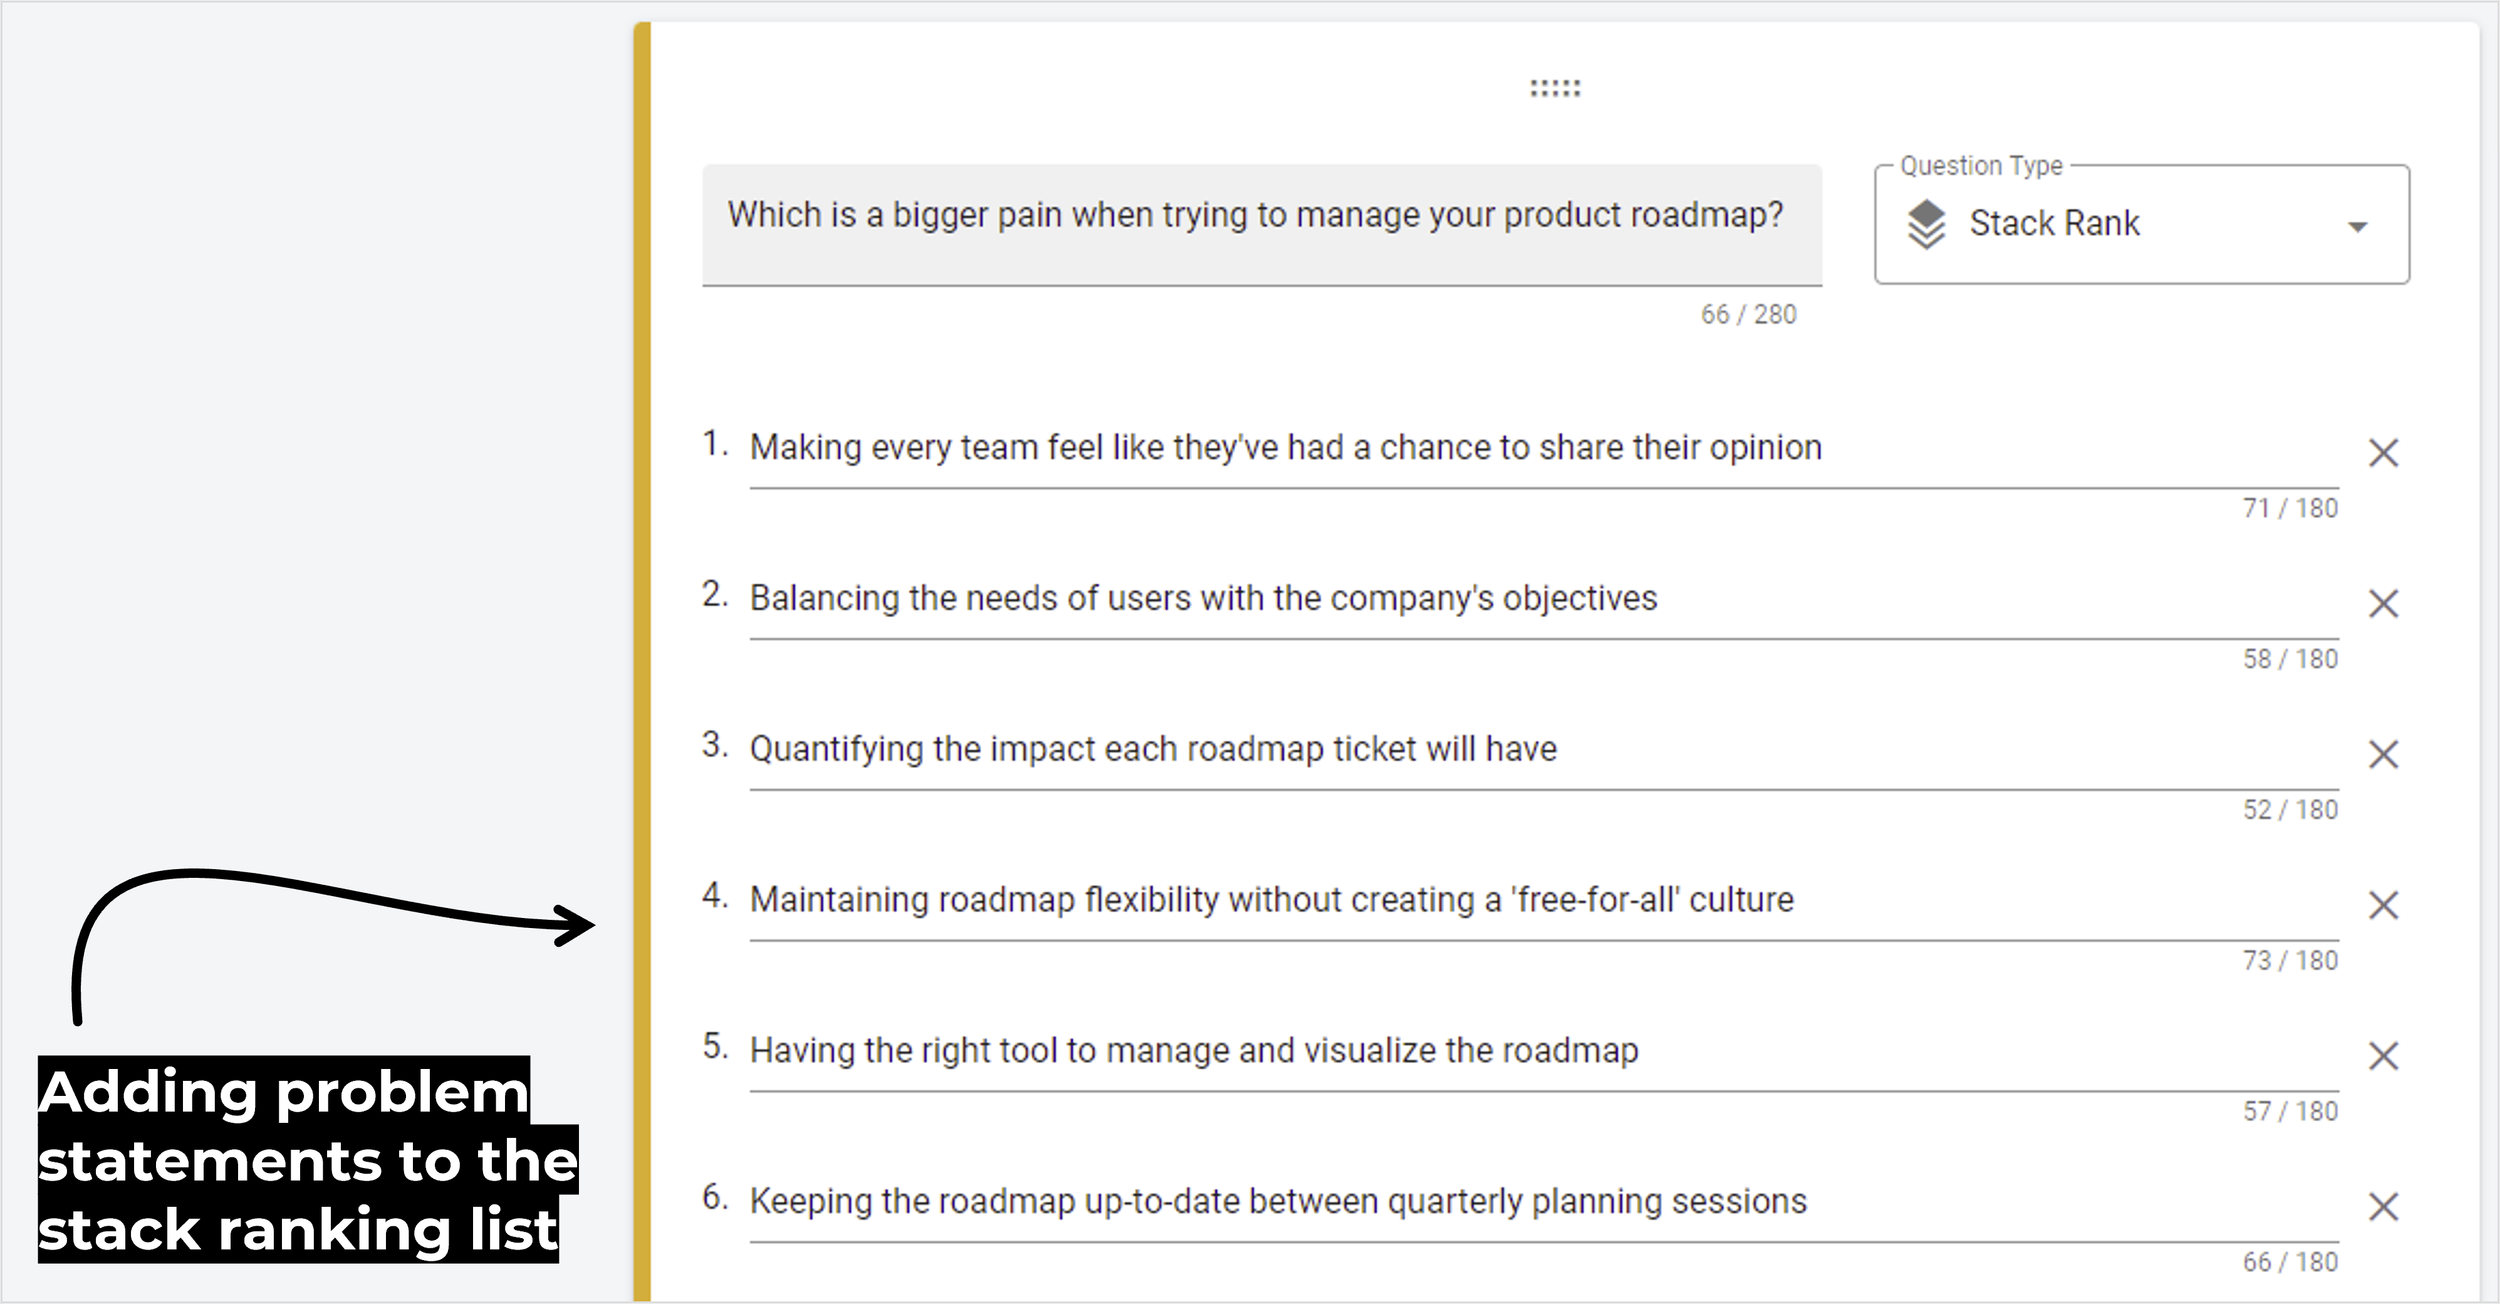
User needs sit one layer of abstraction above problem statements, and I find it's easier for people to articulate and compare problems than needs. I generally aim for 10 to 30 problem statements, including some problems my target customer experiences during the activity of focus that I'm not trying to solve. Those 'peripheral problem statements' are what let you read the relative importance of the needs you are addressing.
Four rules I follow when writing problem statements:
Short and concise. Under 100 characters, ideally.
One statement, one problem. Bundle two problems together and you won't be able to infer anything from the result.
First person perspective. Write from the participant's point of view: "I find it difficult to..." instead of "Product managers find it difficult to...".
No personal info. Too much detail, like specific names or places, makes people skip the statement or drop out of the project.
If your list feels thin, problem brainstorming and thematic analysis of your interview notes are the two fastest ways to fill it out.
Step #5: Stack Ranking
Stack ranking is a research method that compares pairs of statements from a list and ranks them in order of importance according to participants' votes. It handles lists far longer than a person could ever sort by hand, while asking only a minute or two from each participant.
Traditional surveys use drag-and-drop ranking, which works for simple questions with three to eight options. Once you're ranking a long list of 20 or 100 options, you need a different mechanism. That's why OpinionX shows each participant 10 pairs of statements to choose between, then scores every statement from the accumulated votes.
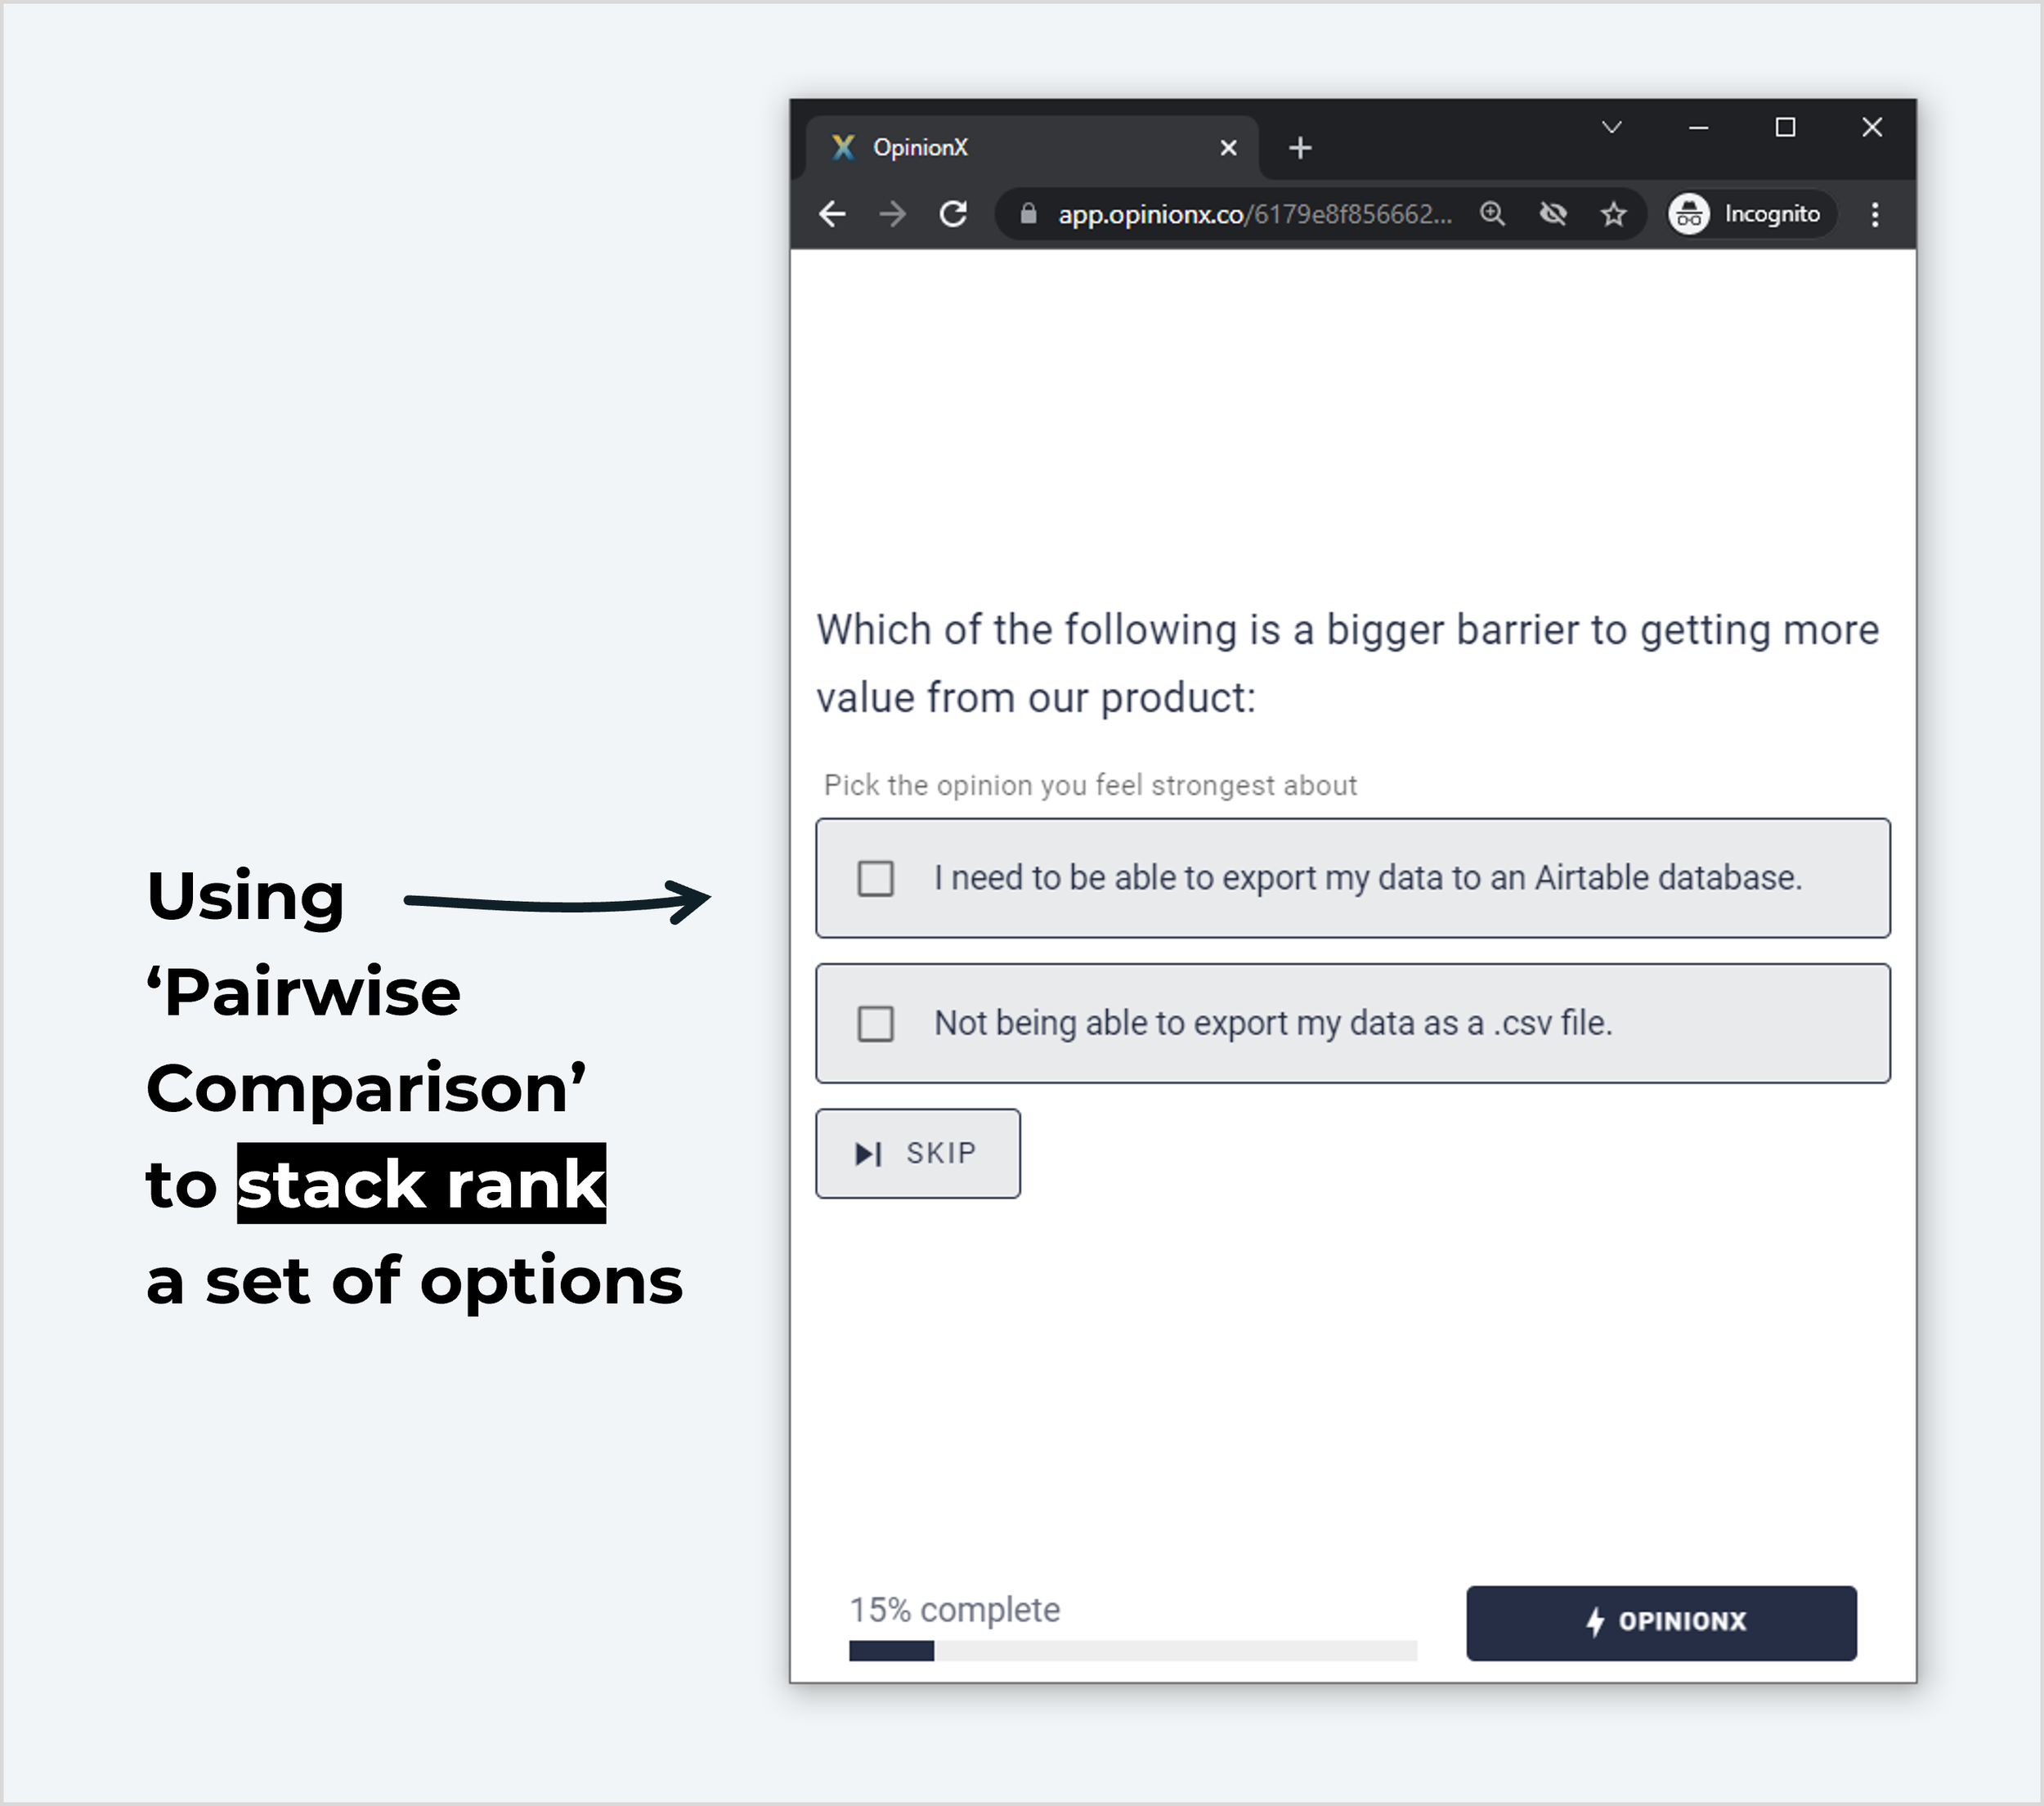
The scoring isn't hidden from you, either. Each option's score comes from the votes it won against the options it was shown alongside, using a rating approach related to the Bradley-Terry model for paired comparisons. We've written up how the ranking formula works if you want to check our workings, and participant-level data exports in full so you can rerun the analysis yourself.
Working at a very small scale of one to five people, you can run this voting manually during user interviews as a card sorting exercise. The data grows fast though, and it gets difficult to compare and aggregate by hand.
So why force a trade-off at all, instead of asking people to rate each problem? Because rating scales don't separate anything. Ask 20 people to score 20 problems out of 10 and most answers land between six and eight, which is central tendency bias, and it leaves you with a list you can't act on. Forced-choice ranking gives you an order.
Step #6: Crowdsource Your Gaps
Even thorough discovery research will miss some of the most important problem statements. Stay open-minded during the participant engagement part of this process so you can spot missing statements worth adding to the voting list.
OpinionX has a feature called Open-Response blocks, which let participants submit new statements that you can add to your stack ranking list instantly (a 'crowdsourced opinion').

I analysed every successful stack ranking survey run in Q2 2021 and found that a crowdsourced opinion finished in the top three most important statements in 81% of them (OpinionX internal data, Q2 2021). That should make it clear how important this step is. Keep an eye out for missing statements and adapt your list as you go.
Step #7: Filter By Descriptor
Across the steps above we've (i) used multiple-choice questions to attach descriptors to each participant, which we'll use to filter them into segments, (ii) created a stack ranking question that ranks every problem statement by importance, and (iii) created a suggestions box to crowdsource the statements we missed.
OpinionX ranks all of the problem statements automatically, which gives you the highest priority needs across the whole group. But what we're after here is segmentation.
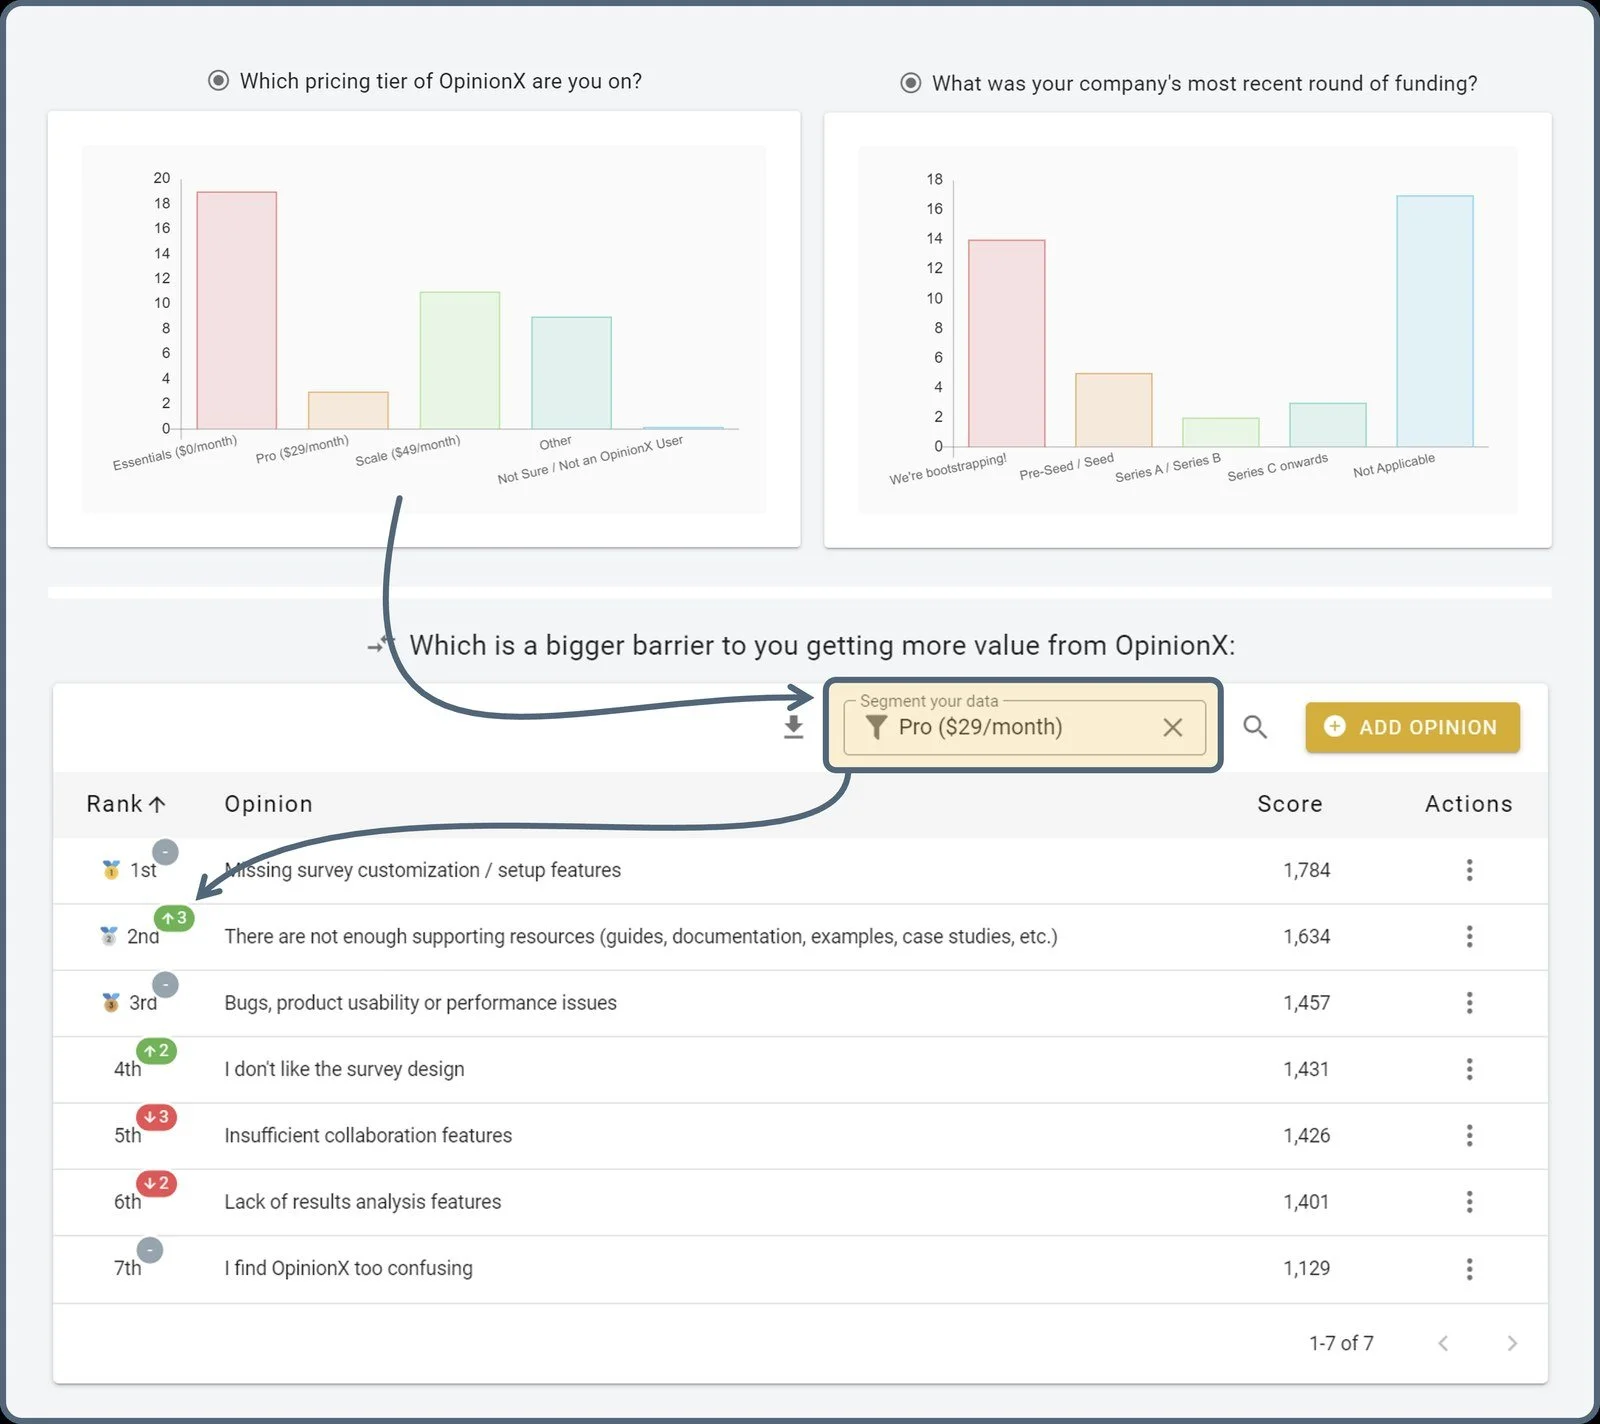
Say we want to filter the stack rank results to look only at participants from companies with fewer than 10 people. Click the Segmentation Filter on the results table and select the '1-9' option.
To create that segment and analyze their specific top priority needs, all we have to do is click the Segmentation Filter on the Stack Rank results table and click the ‘1-9’ option:
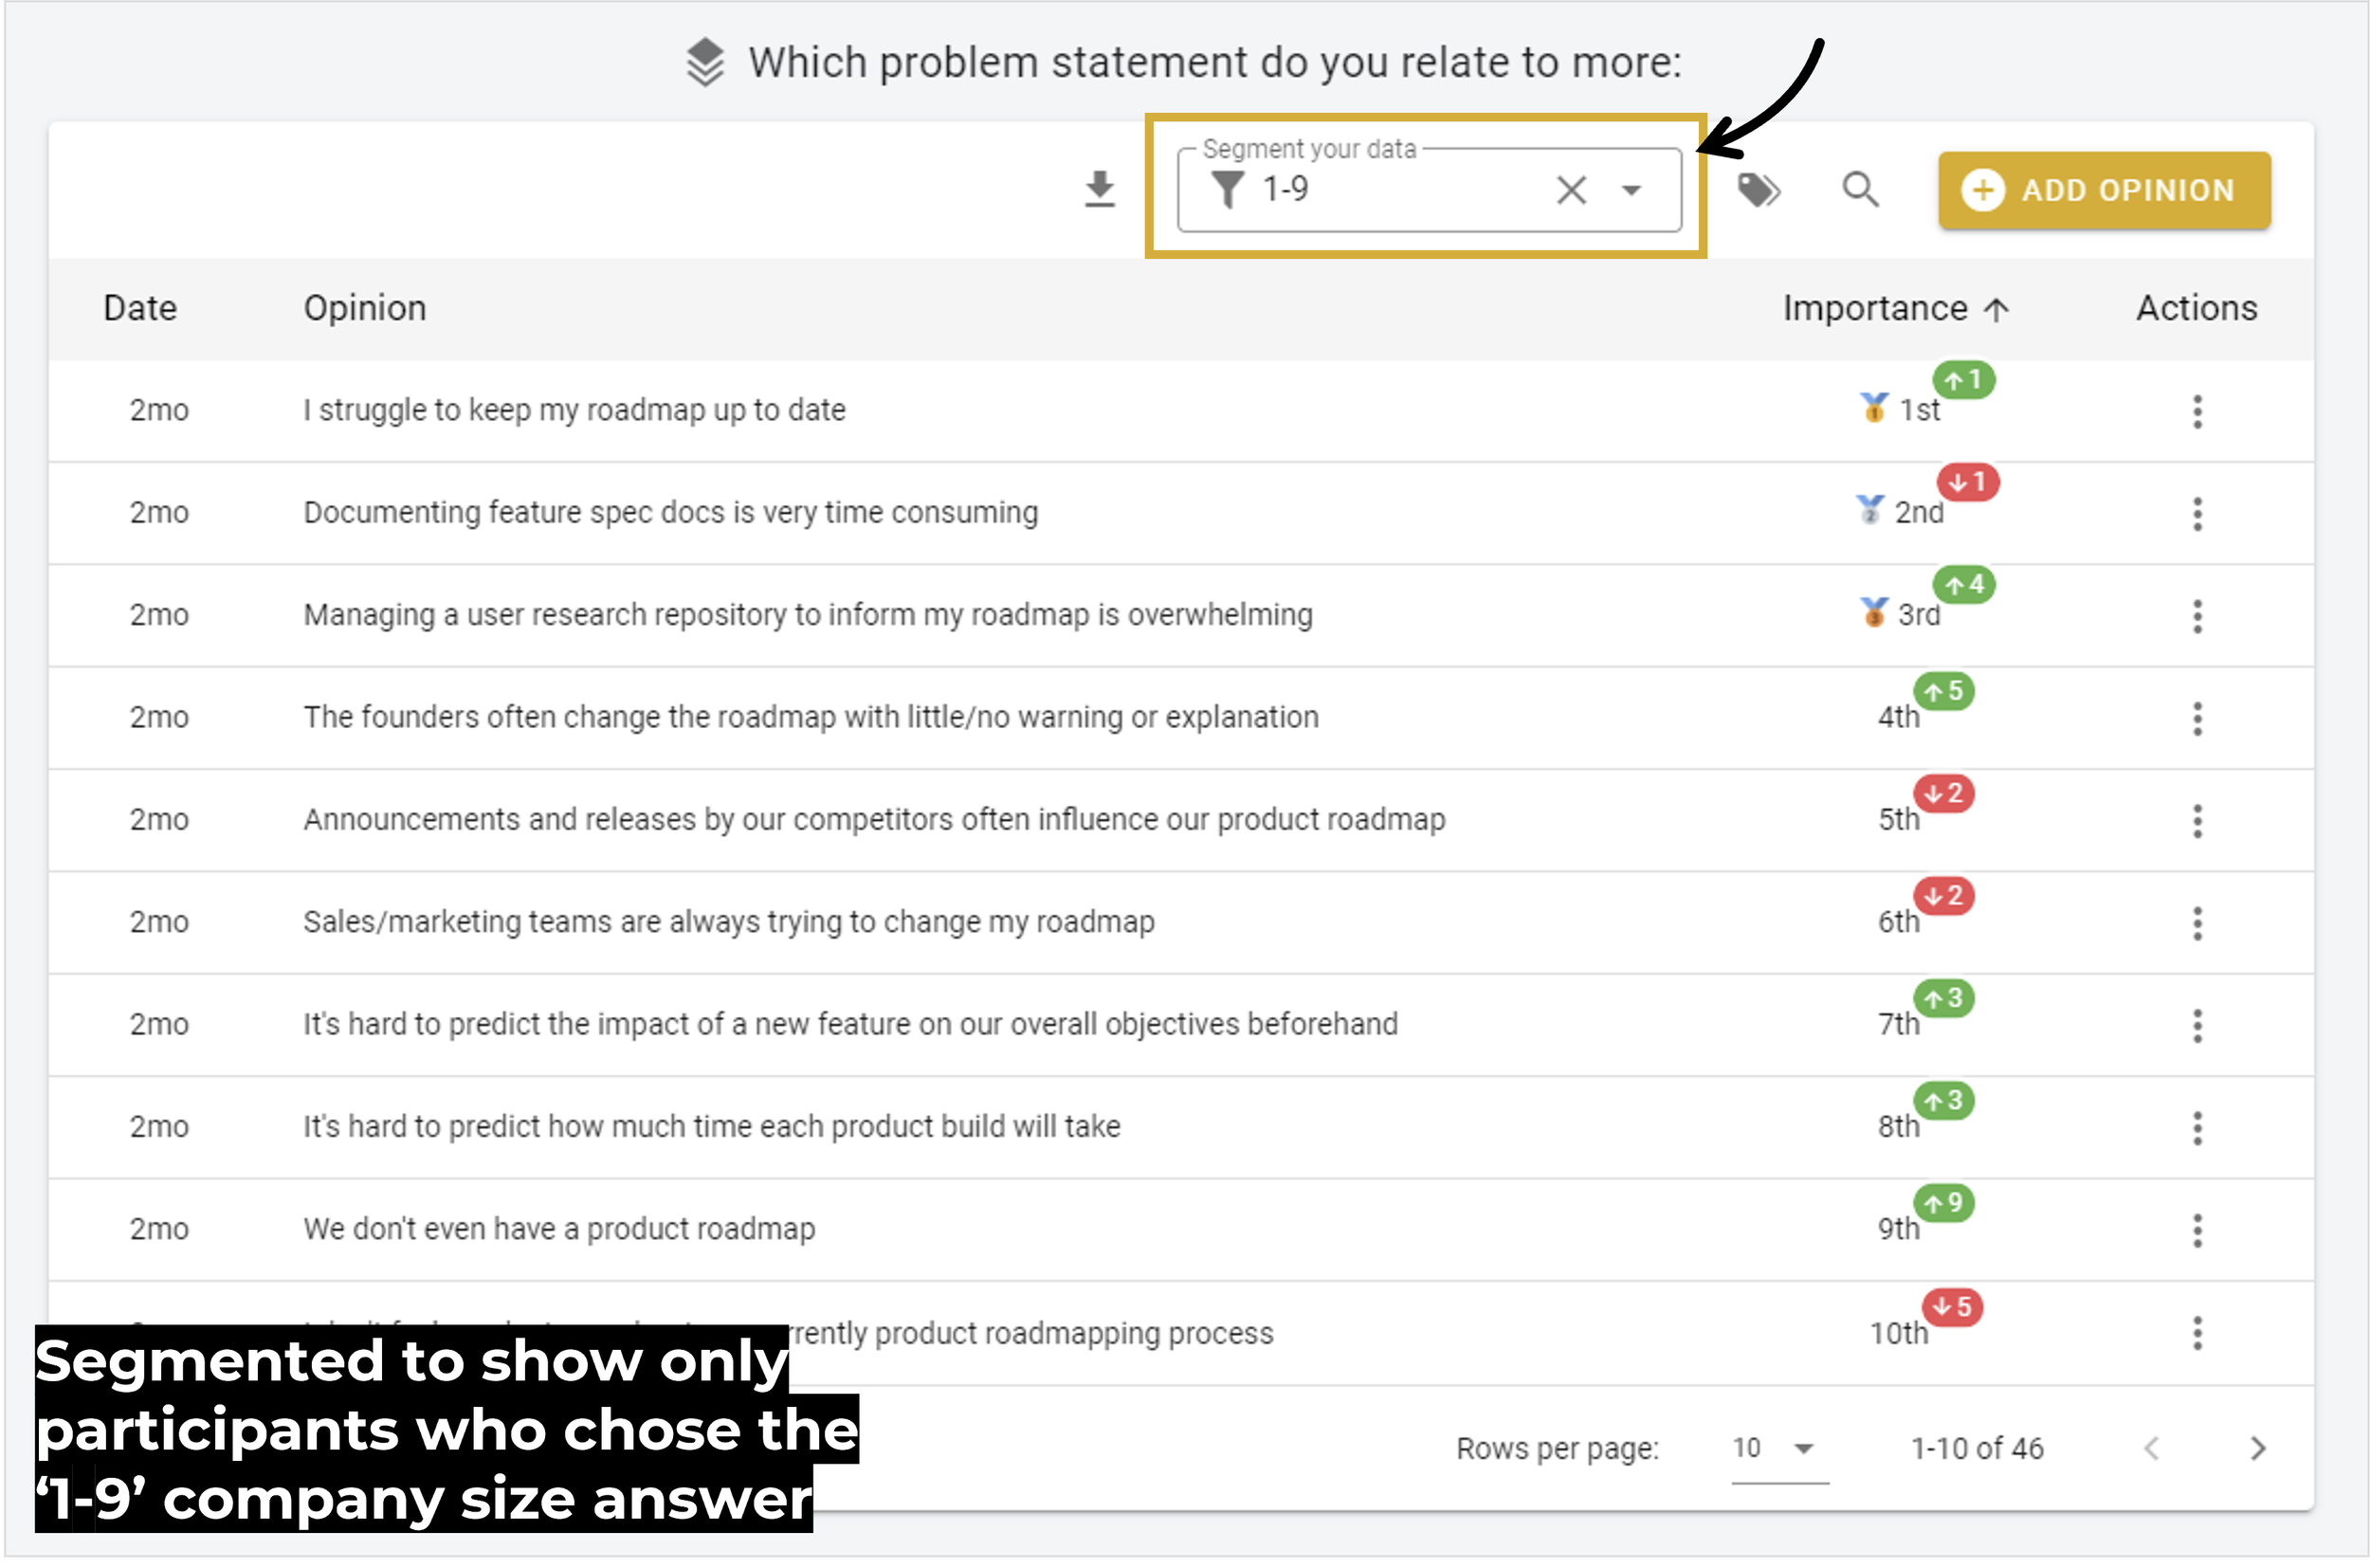
^ The small red and green tiles show how each statement's ranking changes for that segment compared with its ranking across all participants. That comparison is the point of the whole exercise: same logic as a crosstab analysis, applied to ranked data instead of counts.
It also means any descriptive data point you hold, whether demographic, firmographic or financial, becomes a one-click view of the most important problems for that group of people. Which need your product solves for your top tier customers. The problems facing the job title that drives the largest share of your signups. What the company size most likely to convert actually struggles with.
That covers everything the job asks for: qualitative quotes with quantitative statistics over the top, a process that scales to any number of statements or participants, one to two minutes of participant time, needs results tied to descriptive data so the output is actionable, and scoring built on tried-and-tested data science rather than a spreadsheet you have to trust blindly.
What does a finished needs-based segmentation look like?
The output is a ranked list of problems, plus one alternative ranking per segment you defined.
The overall ranking tells you what the market as a whole cares about, which is useful for positioning and messaging and mostly useless for prioritisation, because the average customer doesn't exist.
The finding is in the rank changes. A statement sitting 11th overall and 2nd for your highest-value cohort is the gap you take into a roadmap conversation. And the statements that barely move are the universal problems, usually the ones your onboarding should deal with first.
For a worked example of this run end to end on a real product, the VEED MaxDiff segmentation case study walks through how a video editing platform used segment comparison to work out which customer group to build for next. If you're segmenting around product-market fit specifically, PMF survey segmentation covers the variation of this process built for that question.
What can you use needs-based segmentation for?
| Use case | What the segmentation gives you |
|---|---|
| Validation | Proof that your idea tackles a burning pain point for a defined group of people |
| Positioning | A clear read on which need a well-defined set of customers cares about most |
| Onboarding | A personalised experience built around the need each segment signed up to solve |
| Prioritisation | The most important problems to solve next for your highest priority customers |
| Contextualising | Measurable data to pull your team out of decision paralysis |
| Sales | The core needs driving your best-converting customers, so the right message reaches the right lead |
| Marketing | Personas informed by quantitative data rather than internal assumptions |
| Retention | The impact your product delivers for your best customers, so you can hold on to new conversions |
That marketing row deserves a note. Nielsen Norman Group's guidance on personas is that they only work when they're grounded in research rather than invention, and a ranked list of needs per segment is about the most concrete grounding available. It's also the difference between a persona document and an idea validation input.
When is needs-based segmentation the wrong approach?
Four situations where it won't give you what you want.
When you've only got qualitative data. Interviews tell you which problems exist. They can't tell you which one matters most or how many people it affects, and stopping there gives you a needs list rather than a segmentation.
When you skip the descriptive layer. Needs data on its own produces groups you can't identify, reach or sell to. No descriptors means no filtering, and no filtering means you haven't segmented anything.
When the activity of focus is too broad. A question like "what's your biggest problem?" returns statements that aren't comparable with each other, so the ranking is noise. Narrow the frame before you write a single statement.
When the question is really about trade-offs. If you need to know how people weigh features or price points against each other, rather than which problems matter most, conjoint analysis or MaxDiff is the better instrument. This method ranks problems. It doesn't model what someone will pay.
Frequently asked questions
What is needs-based segmentation? Needs-based segmentation is the process of identifying groups of people based on their shared experience of a specific problem or need, then describing those groups using demographic, firmographic or financial data so they can be targeted.
How is needs-based segmentation different from psychographic segmentation? Psychographic segmentation groups people by lifestyle, interests and values. Needs-based segmentation groups them by the problem they most want solved, which is the better predictor of what they'll buy.
Do you need a statistician to run needs-based segmentation? No, if you use the descriptive-first approach. It relies on filtering and comparison rather than multivariate statistics. The needs-first approach uses discriminant analysis and usually does need someone comfortable with it.
How many problem statements should you rank? Between 10 and 30 for most projects, including some peripheral statements you aren't trying to solve, so you can read the relative importance of the ones you are.
How long does a needs-based segmentation survey take a participant? One to two minutes. Participants vote on 10 pairs of statements rather than sorting the full list, which is what makes long lists workable.
You don't need a data scientist or an agency budget for any of this. Stack ranking plus the descriptive data you already hold gives you segments built on real numbers, and they'll hold up in every part of your product strategy.
Want more like this? Over 42,000 researchers and product people get The Full-Stack Researcher in their inbox. Subscribe to get the next guide when it publishes.
OpinionX is built for ranking people's needs and splitting those results by segment. The free tier costs $0, unlocks every survey method and every analysis feature, lets you create unlimited surveys, and caps each survey at 25 participants. Create your needs-based segmentation project on OpinionX for free, or grab a slot in my calendar if you'd like a free planning session.