
“A conjoint market simulator predicts what share of your customers would choose each product or plan in a hypothetical scenario, using the results of a conjoint analysis survey. You build two or more profiles (a profile is one option picked from each category, like a specific price, feature set and tier), and the simulator works out which profile each participant would prefer based on their individual preference scores, then aggregates those choices into a market share for each profile. The best simulators run this per person rather than on group averages, which is what makes them accurate. On top of market share, a simulator can estimate revenue (price times share) and churn. It’s used to test pricing changes, feature paywalls, price increases, competitive positioning and segmentation before you commit to any of them.”
What is conjoint analysis? (quick overview)
A market simulator is built on top of conjoint results, so it helps to be clear on how conjoint works first.
Conjoint analysis measures which product attributes matter most to customers when they're choosing between products to buy. Instead of asking "how important is price to you?" or "how much storage do you want?", a conjoint survey shows people different versions of a product and tracks what they pick, to work out the attributes they actually care about most.
Those products all share the same categories (price, seats, storage), but the specific option shown within each category is randomised (say 20GB, 50GB, 100GB for storage). Every time a participant picks the product they like most, the options randomise again and they vote on a new set of profiles.
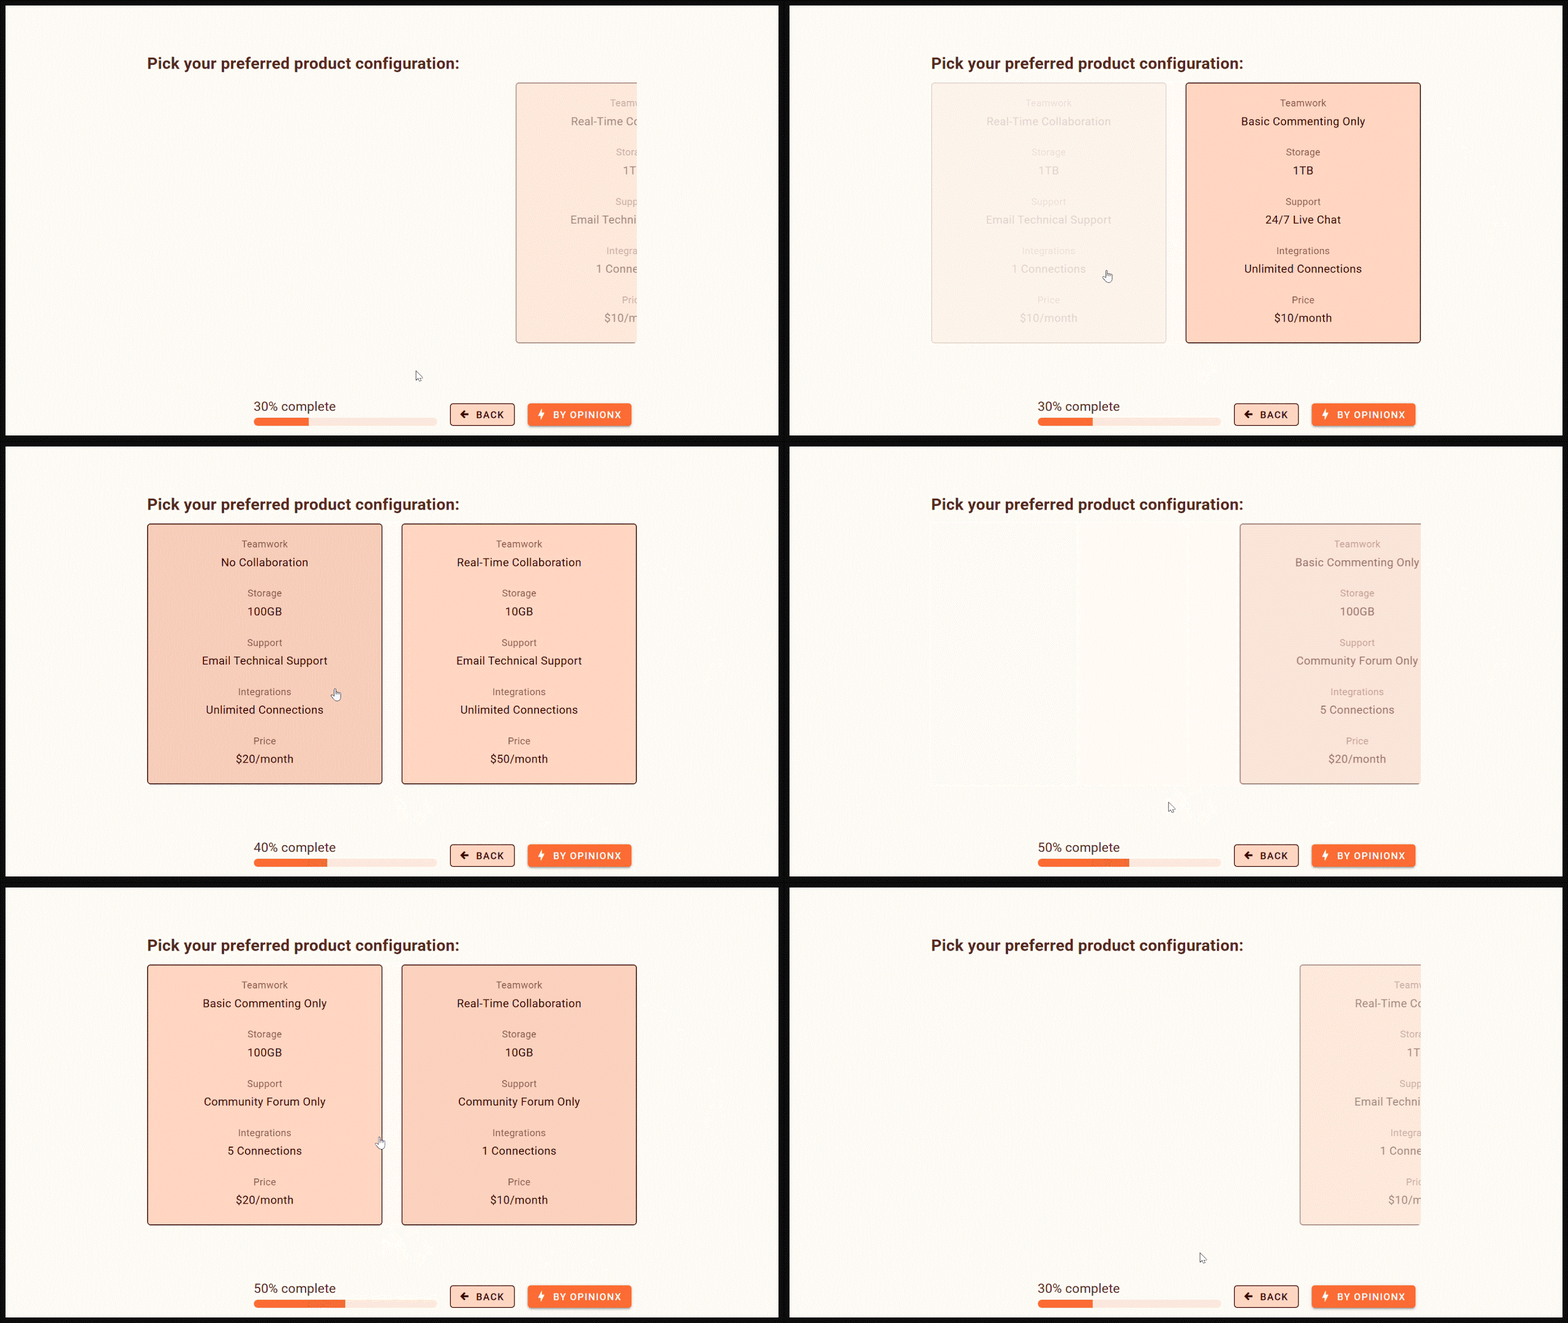
Recording of a conjoint analysis survey on OpinionX
Conjoint surveys tell you which categories matter most to people and, within each category, which options they prefer. If this is your first encounter with conjoint, pause here and read the beginner's guide to conjoint analysis first. It comes in several types.

Screenshot of conjoint survey results on OpinionX
How do market simulators work?
It breaks into three steps: scenario setup, individual preferences, and aggregated predictions.
1. Scenario setup
A conjoint simulator predicts what percentage of participants would choose each profile in a hypothetical scenario, so the first step is to define that scenario. You create two or more profiles for the simulator to run against each other, building each profile by selecting one option from each category in your study.
In the example below, the simulator is for a conjoint survey asking "which video streaming subscription appeals to you most?". The categories are screens at the same time, video quality, and price per month. Each row is one profile, and whenever you change an option with a dropdown, the simulator re-runs automatically.
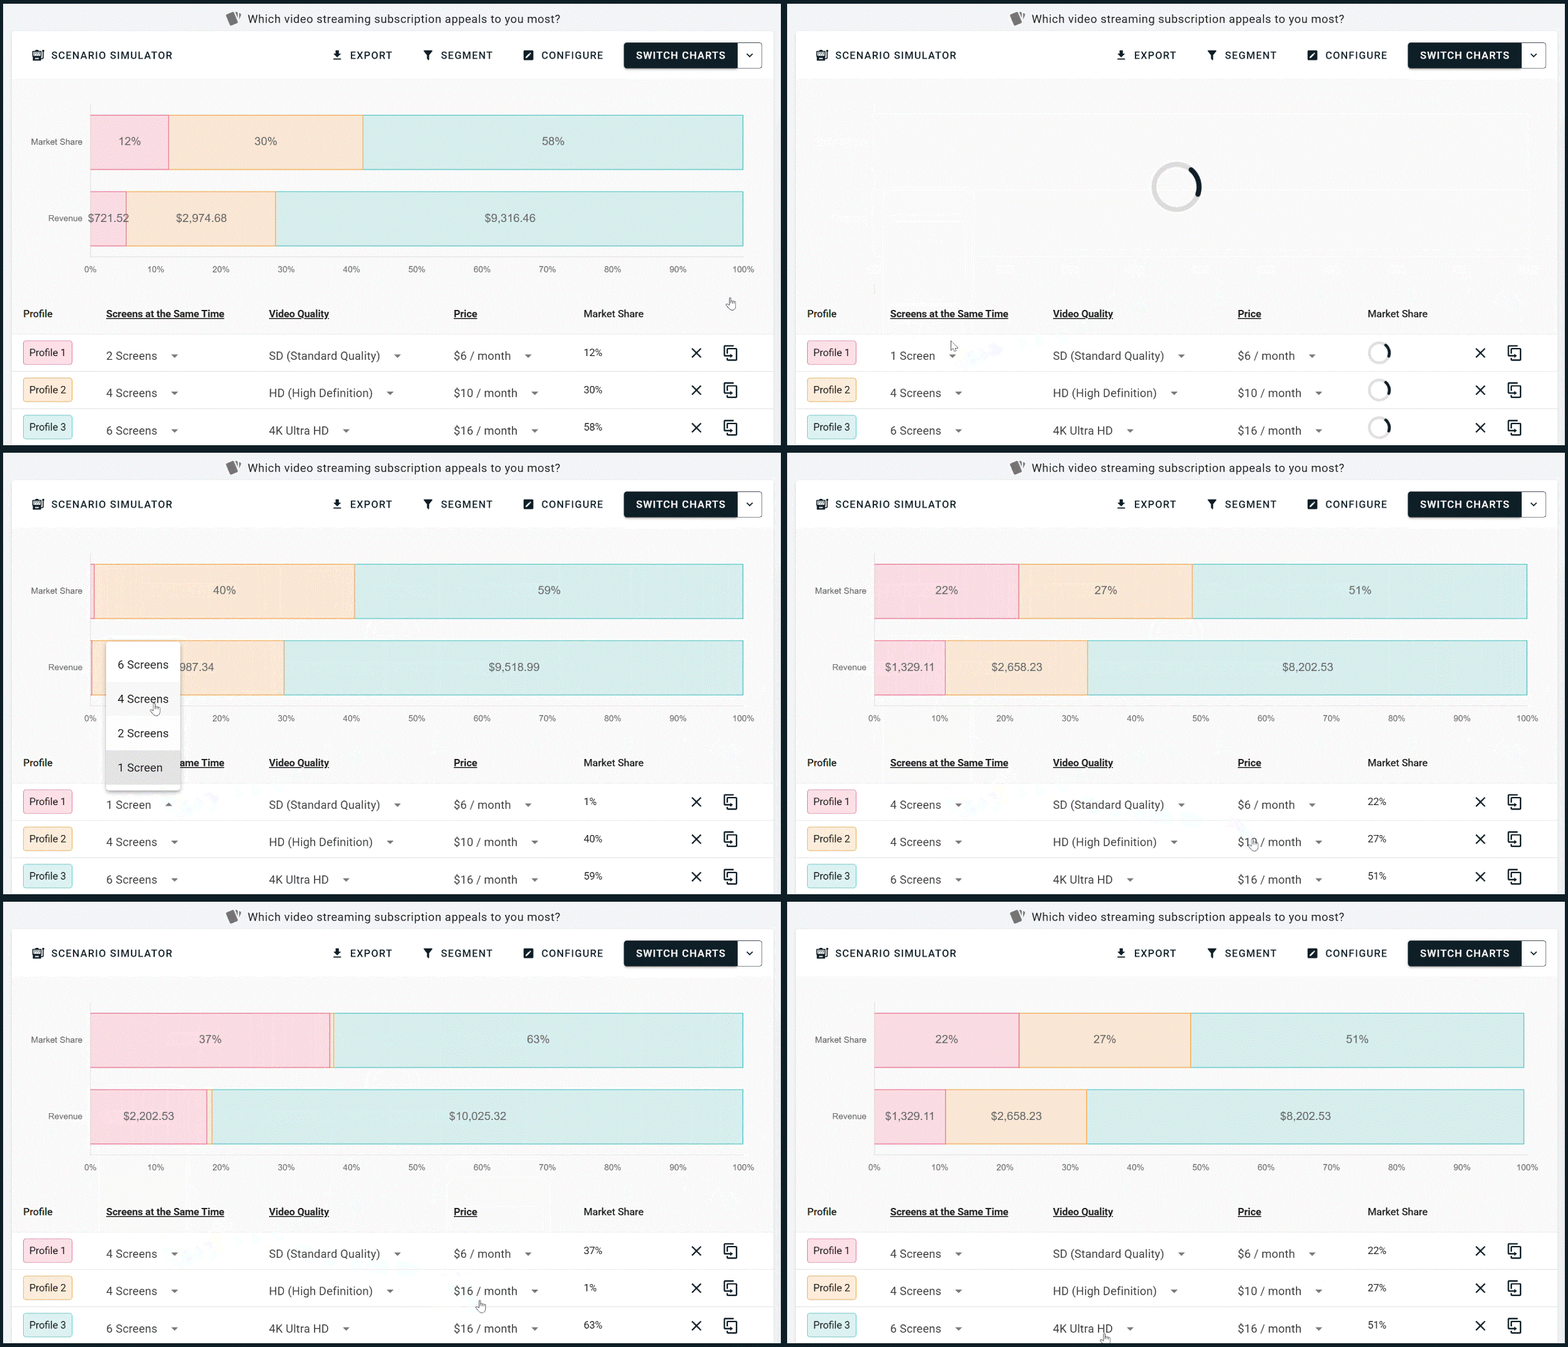
The interesting part is underneath, in how the simulator gets to those numbers.
2. Individual preferences
Once someone completes your conjoint survey, their votes are turned into a preference score (sometimes called a utility score) for every option shown, capturing what they liked and disliked.
Once your scenario is defined, the simulator uses these scores to work out which profile each person would prefer. It adds up the preference scores for the options in Profile 1, repeats for Profile 2, and compares the totals to see which is higher. This runs for every participant individually, not on overall average scores. That individual-level calculation is what makes the simulator useful: it respects how people differ instead of assuming everyone thinks the same way.

3. Aggregated predictions
After calculating each individual's predicted choice, the simulator aggregates the results. Imagine your conjoint survey had 1,000 participants in total. If the simulator calculates that 590 would pick Profile 1, then Profile 1 is given 59% market share.
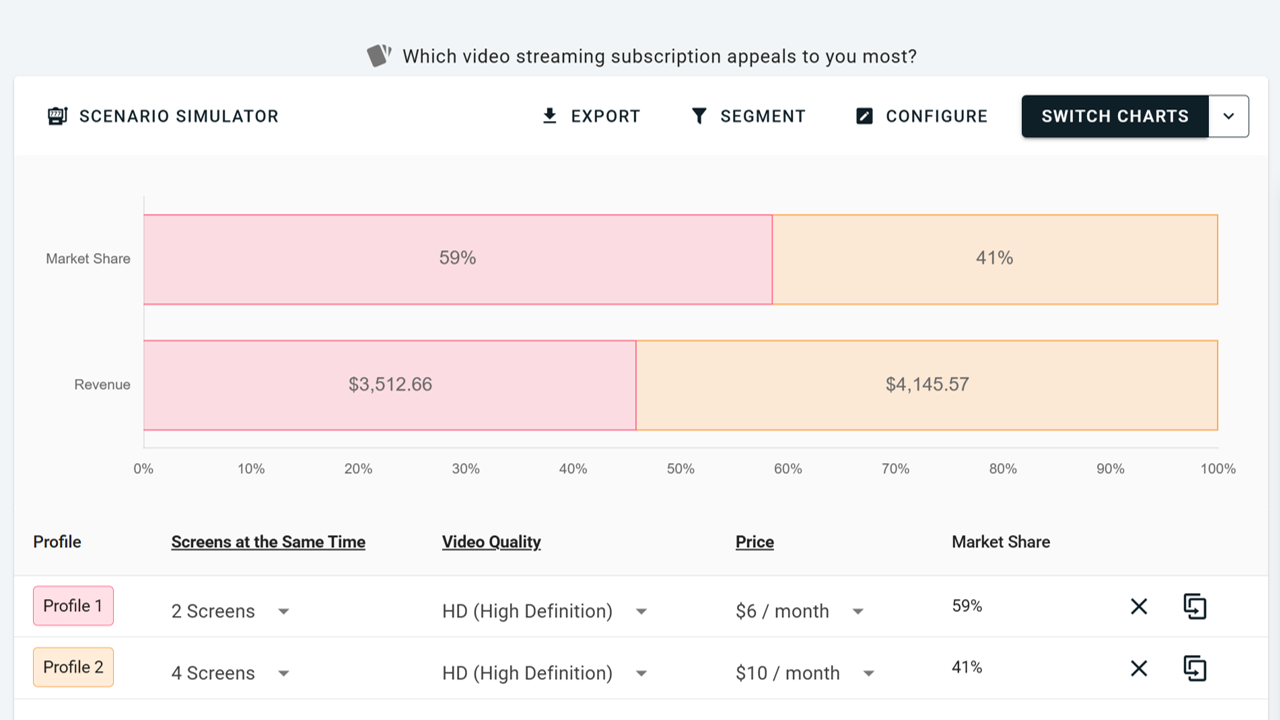
This 59% is usually called preference share or simulator market share, which is why the tool is often called a market share simulator. Be clear about what it means, though. A conjoint simulator isn't a perfect real-world forecast: actual purchase behaviour is shaped by awareness, distribution, competitor reactions, brand trust, habit and even mood, and the simulation can't easily factor any of those in. What it does do well is compare options against each other, which is what most decisions actually need.
Conjoint simulator use cases
Simulators earn their keep whenever your team is stuck on "should we do A or B here?". Five common cases:
New pricing tier launch. Will adding a mid-tier plan attract price-sensitive users without cannibalising premium revenue? Simulate current plans only, current plans plus a new mid-tier, and a redesigned pricing ladder, then compare market share and revenue for each.
Feature paywall. Which features should stay free, move behind a paywall, or become paid add-ons? Test multiple bundling strategies to see which drives the strongest preference instead of debating it internally. This is the same question the Value-Adoption Matrix tackles from the adoption side.
Price increase. Will a price rise grow revenue or shrink it through churn? Simulate current pricing against proposed pricing against an opt-out option to estimate the change in market share, revenue and churn.
Competitive repositioning. How does your offer compare to competitors? Run a conjoint survey with your offering and your competitors' features and prices, then simulate how customers choose between them. This shows how much brand perception matters against features or price.
Segmentation strategy. Do different customer segments value your plans differently? Because simulators work at the participant level, you can filter by segment (hiding freemium users to focus on premium customers, say) and the simulation reruns for that group, which uncovers opportunities for differentiated pricing or packaging. On OpinionX, the simulator and all your results filter in one click.
Revenue simulator
Market share is useful, but revenue is usually what leadership cares about most. The simulator screenshots throughout this guide show more than the percentage of participants who'd pick each profile. They also show how much revenue each profile would generate based on its projected market share.
OpinionX's revenue simulator works this out by multiplying the profile's price by its market share and an assumption of 1,000 hypothetical customers. If a product costs $8 and has 24% market share, that's $8 × 0.24 × 1,000 = $1,920 in potential revenue.

Conjoint results can feel obvious on the surface (people prefer lower prices, of course), and then revenue upends that: a higher price with slightly lower share can beat a lower price with higher share, and only the simulation tells you which.
Churn simulator
The same logic extends to churn. By simulating a proposed change against an opt-out or rejection option, you can estimate how many customers would leave rather than accept the new scenario. That puts a hard number on the downside of a price change before you ship it.

Case study: pricing a big product launch with a conjoint simulator
The big product launch: Dr Rooty
After six months of development, Florafi was preparing to launch its most ambitious feature yet: an AI plant expert called Dr Rooty, which diagnoses plant health problems, suggests treatment plans, explains unexpected changes and adapts its care plan based on a medical history it keeps for each plant.

For Florafi, Dr Rooty was the biggest launch they'd worked on. Beta testing showed strong adoption, retention and perceived value, so they were confident it would succeed. What they weren't confident about was how to price it. They could make it an optional add-on, build a new higher premium tier around it, or tie it to a price increase for existing Grow-tier customers. The challenge was a pricing model that maximised revenue without spiking churn.
Picking the right research method
Every apparent decision led the team to more questions about what customers valued most: collaboration, plant limits, or specific features. As an early-stage startup, they couldn't run large-scale pricing A/B tests inside the product. What they needed was a way to simulate pricing decisions before committing.
That's when they chose conjoint analysis. Their survey could present users with subscription plans made of randomised feature combinations and prices, and by analysing which plans users picked, they could measure how valuable Dr Rooty was relative to other features, how sensitive customers were to price, and how much plant limits and collaboration mattered.
Plugging that preference data into a conjoint simulator is what let them test pricing ideas in a virtual environment instead of arguing about them.
Survey design and results
They designed a conjoint survey covering the features, plant limits and prices in question, then ran four pricing scenarios through the simulator.

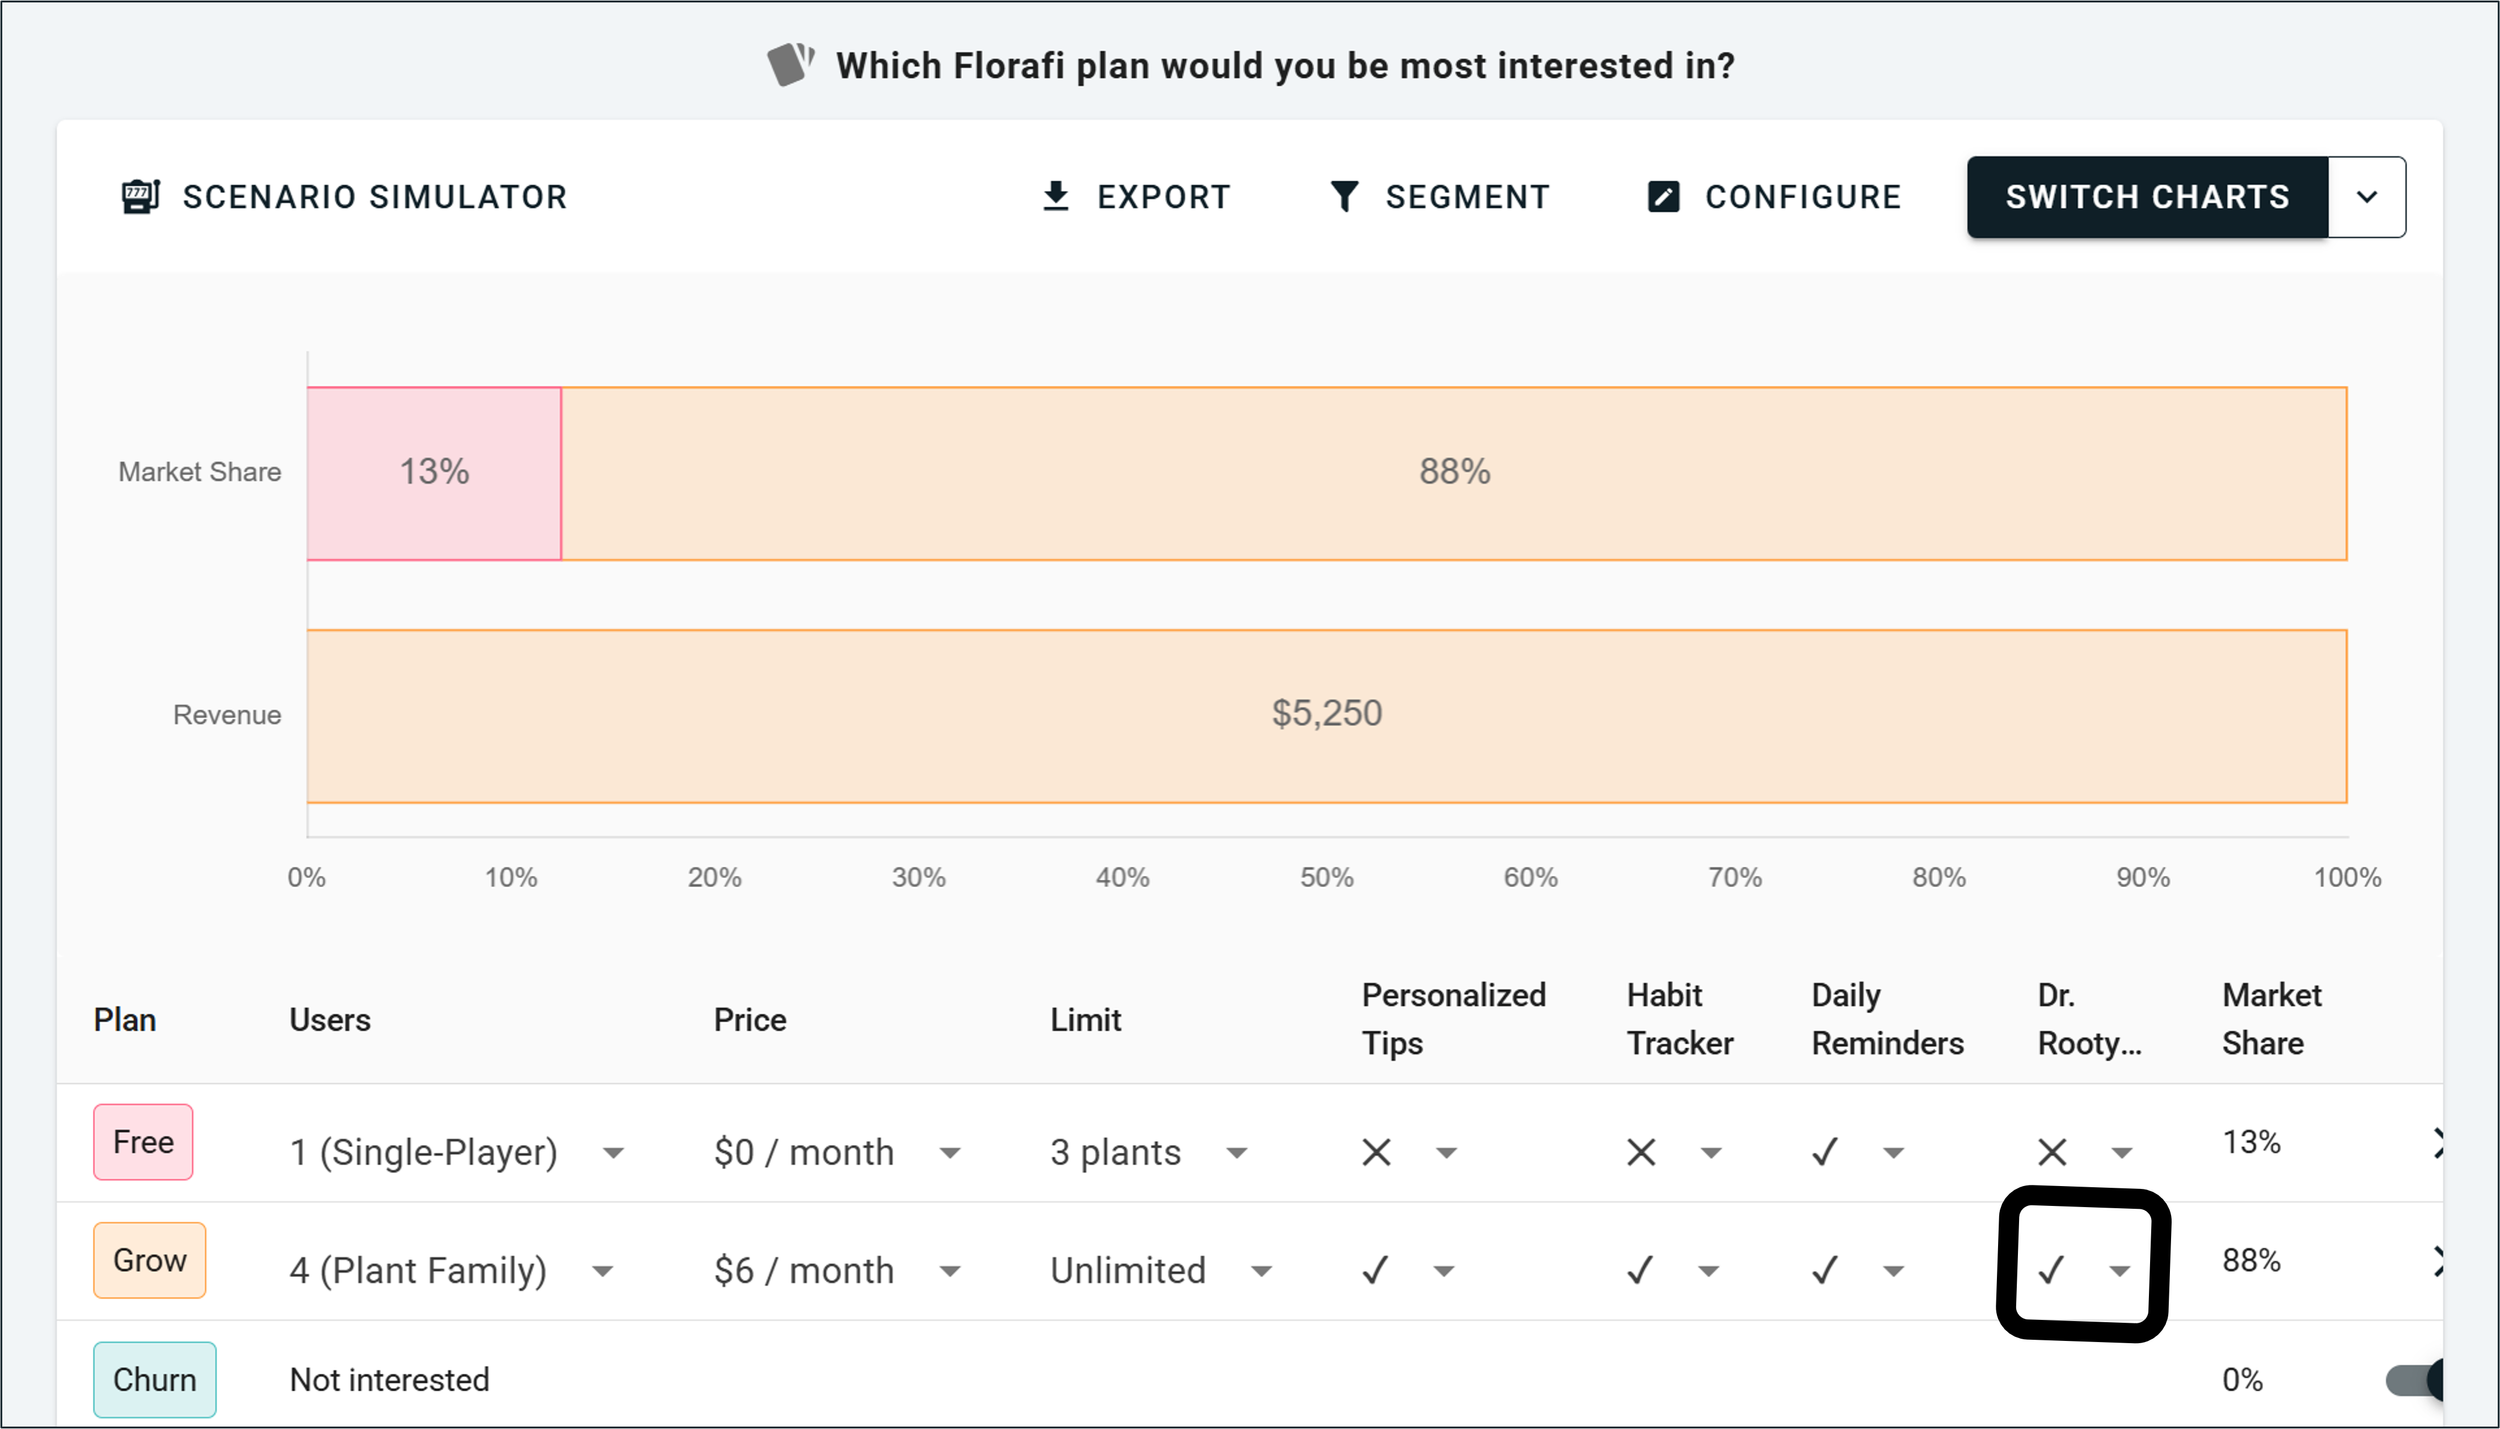
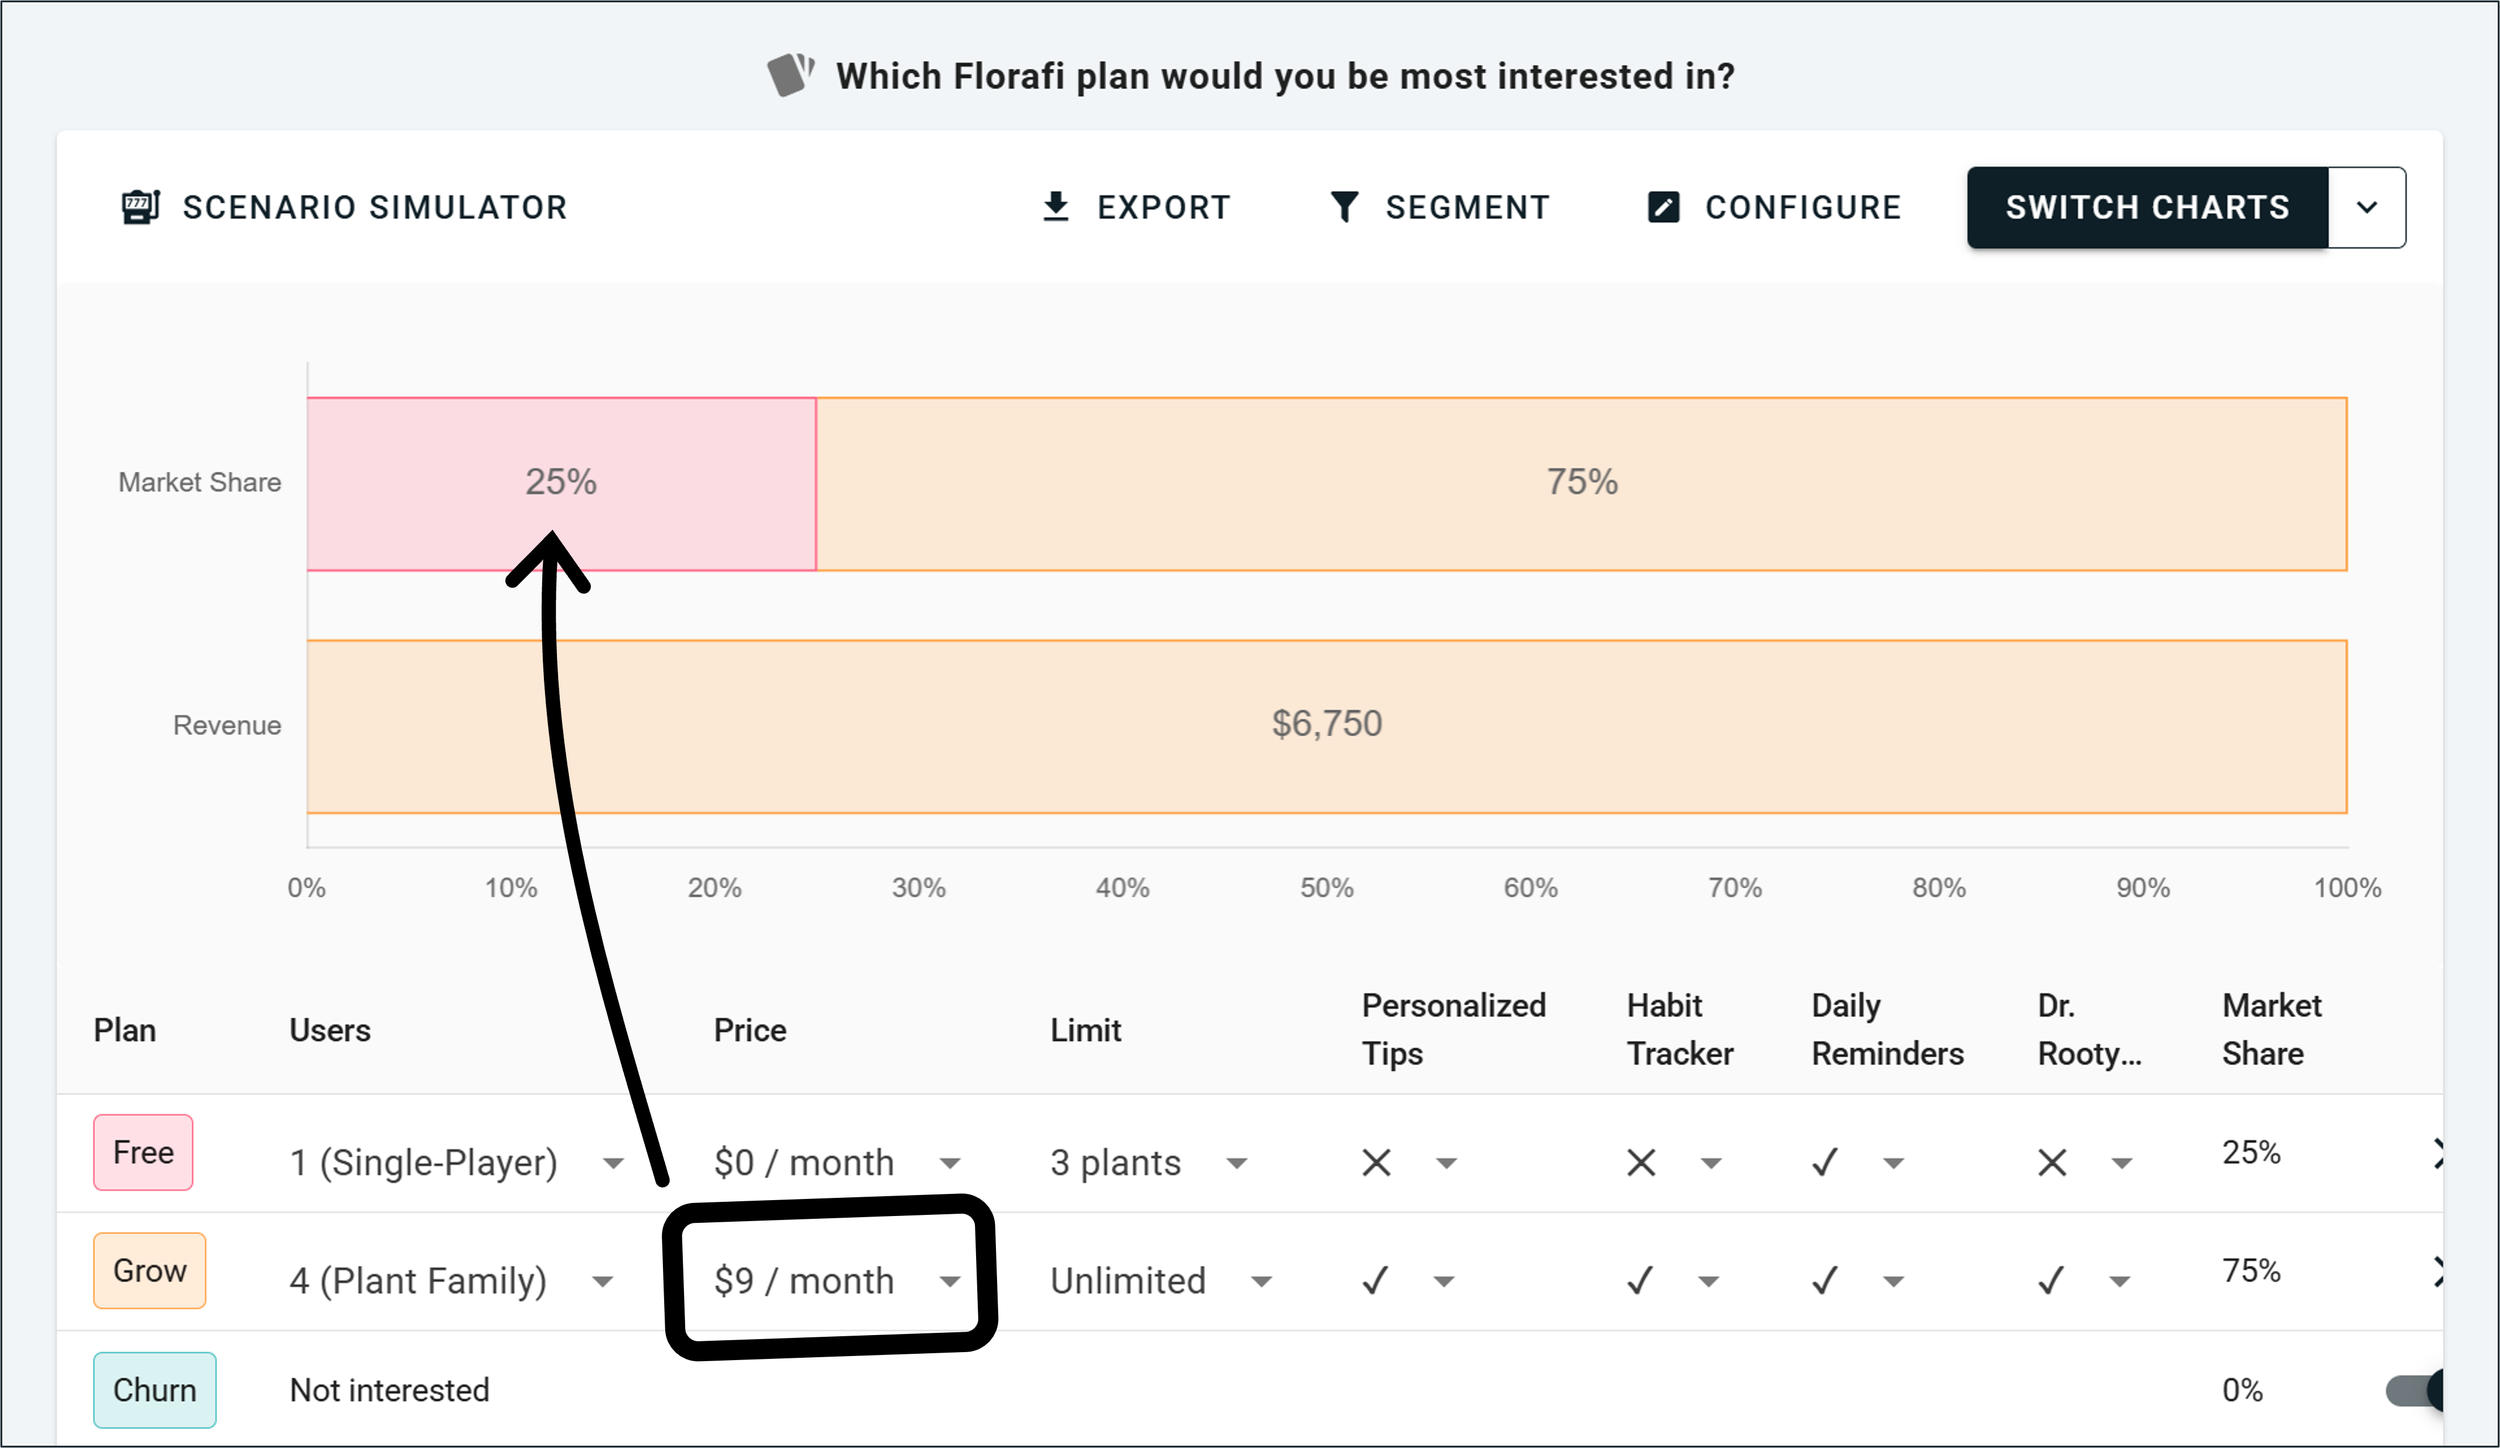
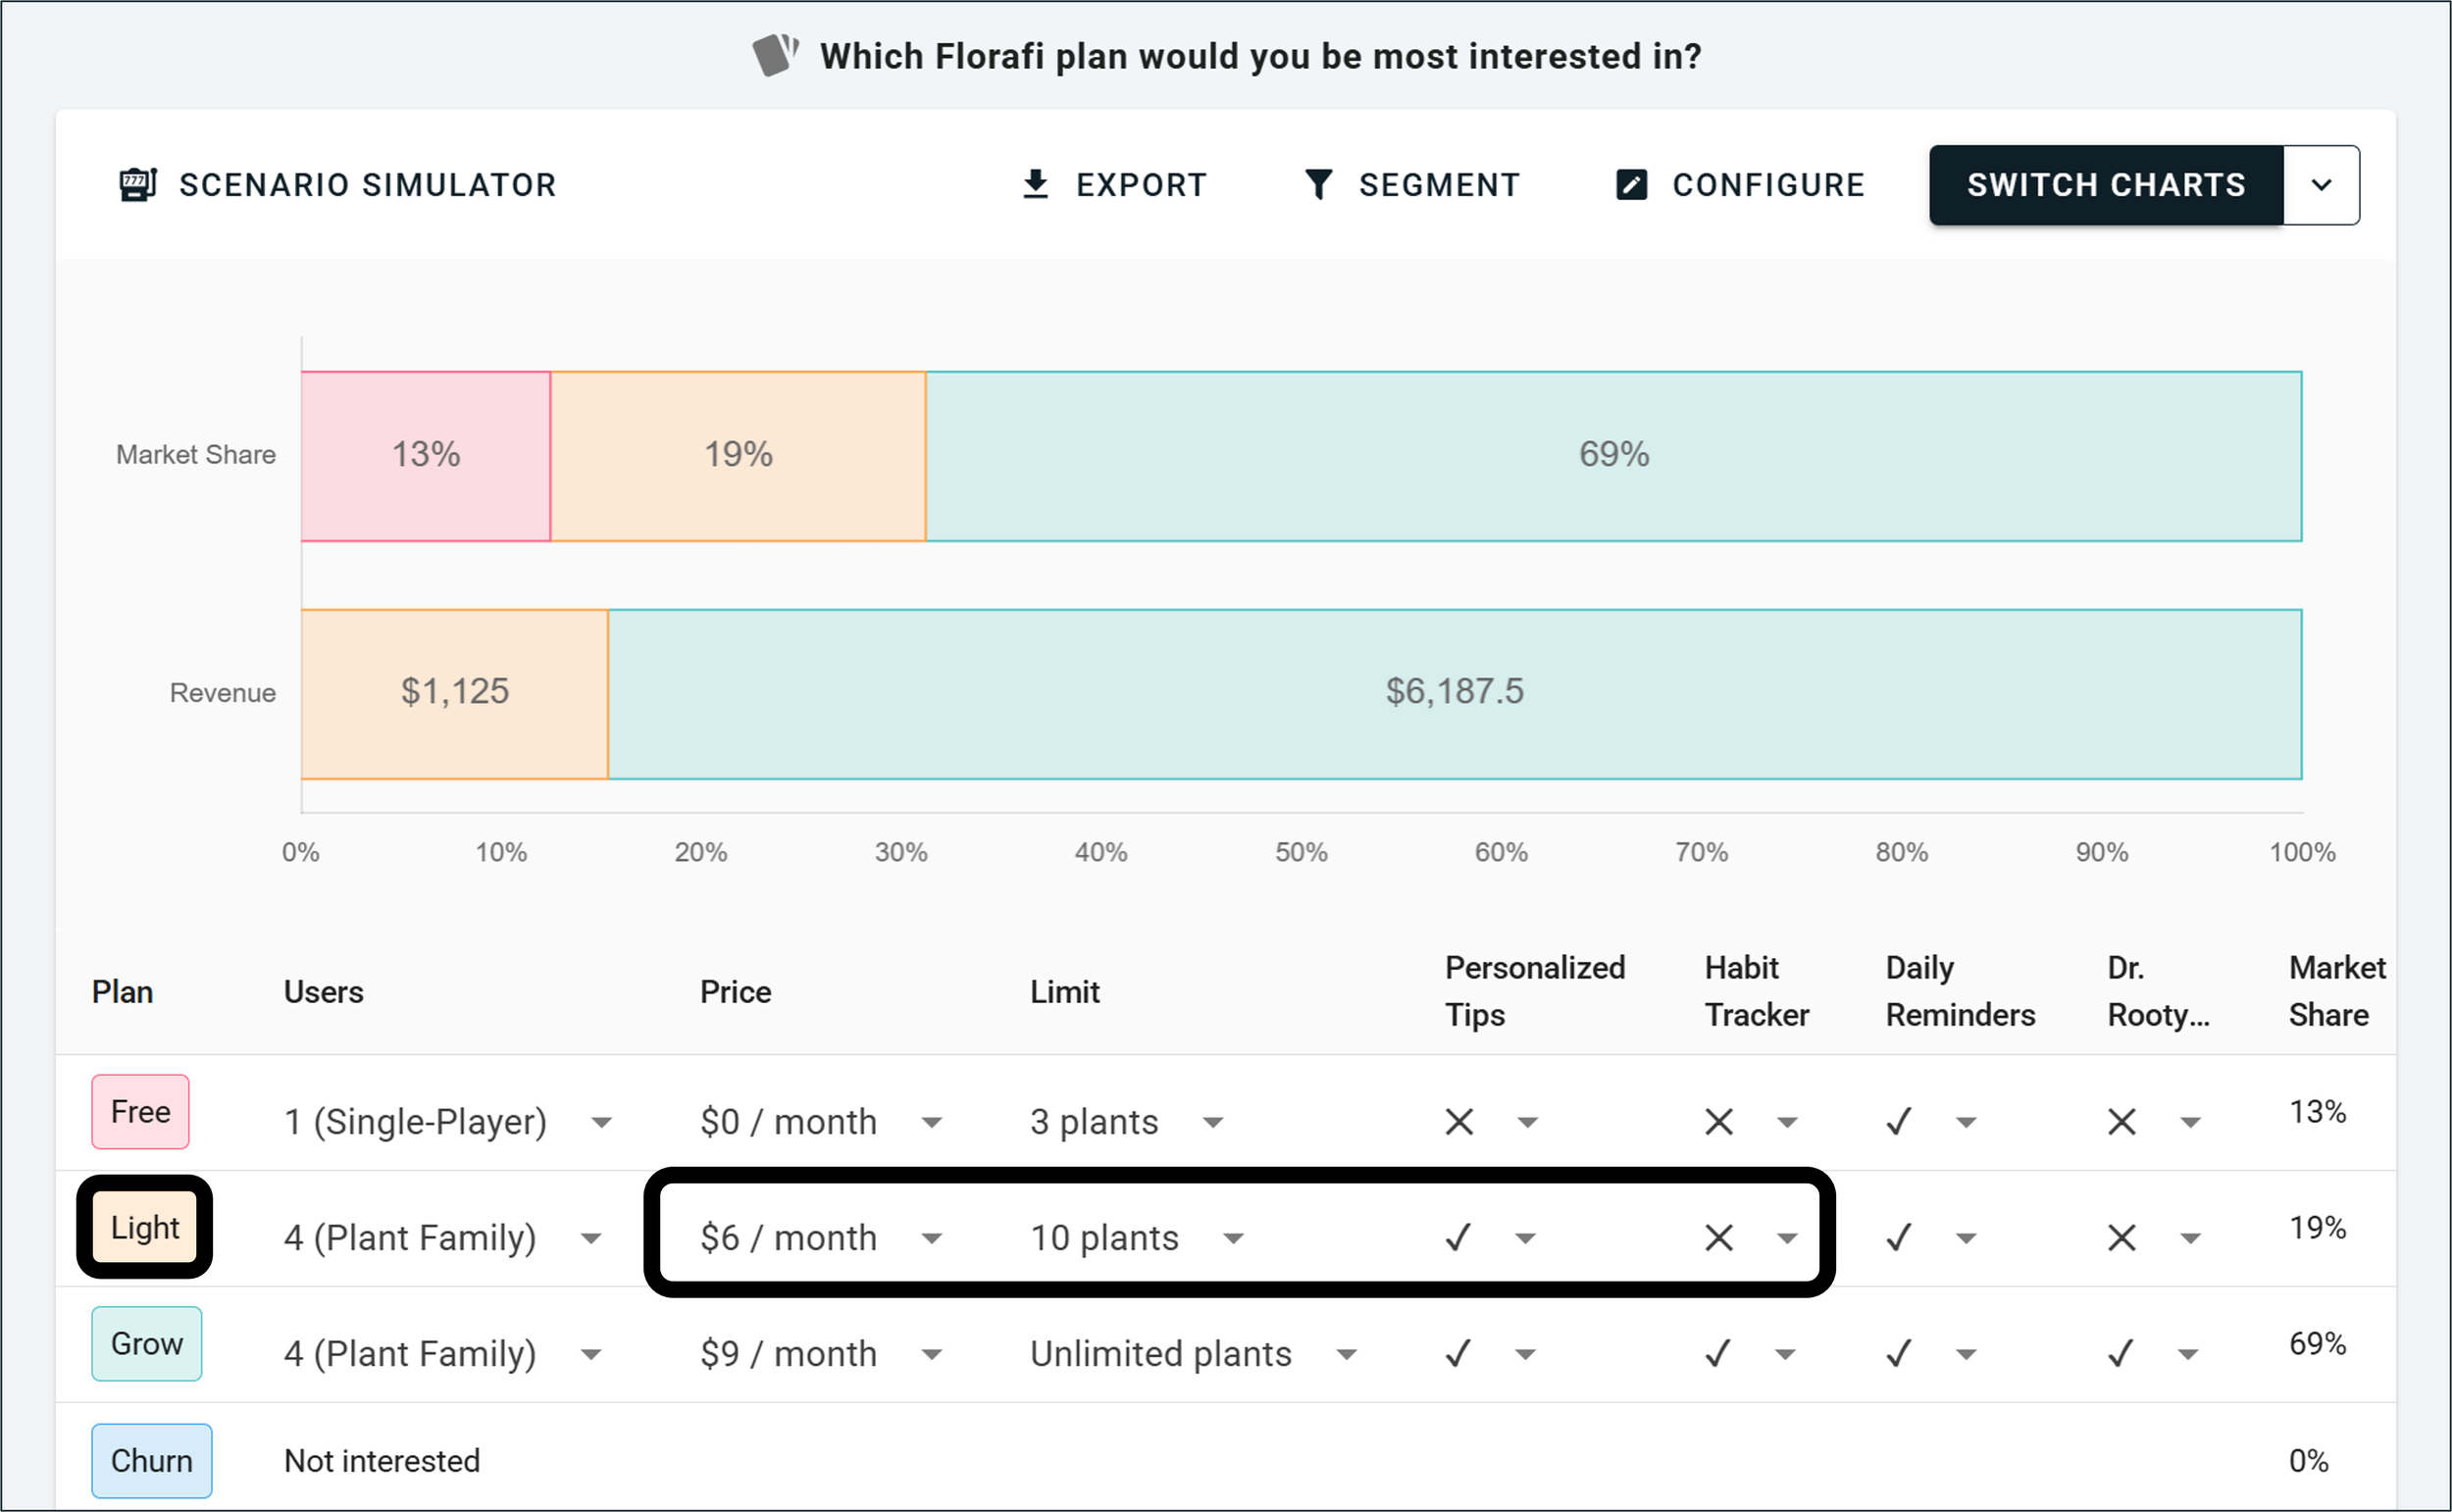
Comparing the scenarios on market share and revenue together, rather than either alone, showed Florafi which pricing model for Dr Rooty gave the best result before they committed to a launch.

Types of conjoint simulator
Not all conjoint simulators are built the same. Here's a quick overview, from simplest to the standard used by the best researchers.
Aggregate logit (basic). Doesn't check each individual's preferences. It looks at everyone's scores averaged together to predict how the typical customer might act.
Latent class (intermediate). Groups people with similar voting patterns and runs the simulator against each group. More accurate than aggregate logit, but still not down to the individual.
Hierarchical Bayes, HB (advanced). Each person gets their own preference model, which the simulation uses to model their behaviour individually before aggregating into a market share prediction. HB is the baseline standard in conjoint research, and it's the approach used to explain how simulators work throughout this guide.
HB with Hamiltonian Monte Carlo (gold standard). Instead of assuming each person's preferences are known exactly, this generates multiple possible versions of each person's preferences and simulates across them, which reduces overconfidence and makes predictions more reliable.
The simulator screenshots in this guide are from OpinionX, which uses the Hamiltonian Monte Carlo method on top of a Hierarchical Bayes Multinomial Logit scoring model. HB-MNL-HMC is the gold standard of conjoint simulation, and it's available free on OpinionX conjoint surveys.
Getting started with conjoint simulators
OpinionX's conjoint simulator is built for people who aren't specialist researchers. It takes the manual work and the jargon out of conjoint so anyone can use these advanced methods, whatever their experience. Using simple dropdown menus, you build product profiles and instantly simulate market share, revenue and churn.
This is all on the OpinionX free tier, which includes sample surveys and one-click templates so you can test a simulator for yourself. Premium customers also get prepaid consulting hours with a research expert to help with setup and analysis.
Frequently asked questions
What is a conjoint market simulator? A tool that predicts what share of customers would choose each product or plan in a hypothetical scenario, using the results of a conjoint analysis survey. It works out each participant's likely choice from their preference scores and aggregates those into a market share for each option.
What is preference share? The percentage of participants a simulator predicts would choose a given profile. If 590 of 1,000 participants would pick Profile 1, its preference share is 59%. It's a comparison between options, not a real-world sales forecast.
How accurate is a conjoint simulator? It's accurate for comparing options against each other, which is what most decisions need. It's not a perfect forecast of real-world sales, because awareness, distribution, brand and habit all affect actual purchases and can't be built into the simulation. Individual-level models like Hierarchical Bayes are more accurate than group-average approaches.
Can a conjoint simulator predict revenue and churn? Yes. A revenue simulator multiplies each profile's price by its market share (and a customer-count assumption) to estimate revenue. A churn simulator compares a proposed scenario against an opt-out option to estimate how many customers would leave rather than accept it.
Is there a free conjoint simulator? Yes. OpinionX includes the market share, revenue and churn simulator on its free tier, running the gold-standard HB-MNL-HMC model.
A conjoint simulator turns a survey full of preference scores into an answer to "what happens if we do this?". Build the scenarios, let it predict each customer's choice one person at a time, and compare the options on market share and revenue together. For choosing between A and B before you commit real money, I haven't found anything better.
Want more like this? Over 42,000 researchers and product people get The Full-Stack Researcher in their inbox. Subscribe for the next one.
OpinionX's conjoint simulator is free to use: $0, unlimited surveys, unlimited researcher seats, capped at 25 participants per survey, then $900 a year to lift the cap (full pricing). No credit card required, and it runs the gold-standard simulation model.
About The Author:
Daniel Kyne is the Founder & CEO of OpinionX, the platform for advanced market research surveys. Hundreds of the world’s top product teams use OpinionX to measure their customers needs, map customer segments, and model purchase decisions — all inside this one easy-to-use platform for advanced surveys.
→ Try OpinionX for free today