
When To Use Conjoint Analysis [5 Criteria & 10 Examples]
“Conjoint analysis is only the right method in a narrow set of situations: a simple, well-considered purchase between similar products, one decision-maker, a customer who already knows what they need, and a set of tangible attributes you understand and that don’t overlap. It’s genuinely useful for calculating willingness to pay on existing features, building a product bundle (often with TURF), and modelling market share. But most of the time it’s overkill. There are ten common scenarios where you should not use conjoint: simple trade-offs, options that live in one category, impulse buys, complex multi-stakeholder purchases, intangible attributes, no benchmark price, emerging categories, brand-new features, the wrong number of attributes, and interdependent software features. For most prioritisation work, a simpler method like pairwise comparison, MaxDiff or customer problem stack ranking is the better fit.”
What is conjoint analysis?
Conjoint analysis is a survey format that measures the importance of specific product attributes (like price, brand or features) when a customer is comparing options in a purchase decision. It assumes people evaluate products based on the combination of attributes they offer.
The result tells you the relative importance of each attribute (whether price or brand matters more) and a ranking of the options within each attribute (for brand, whether people lean Coca-Cola or Pepsi).
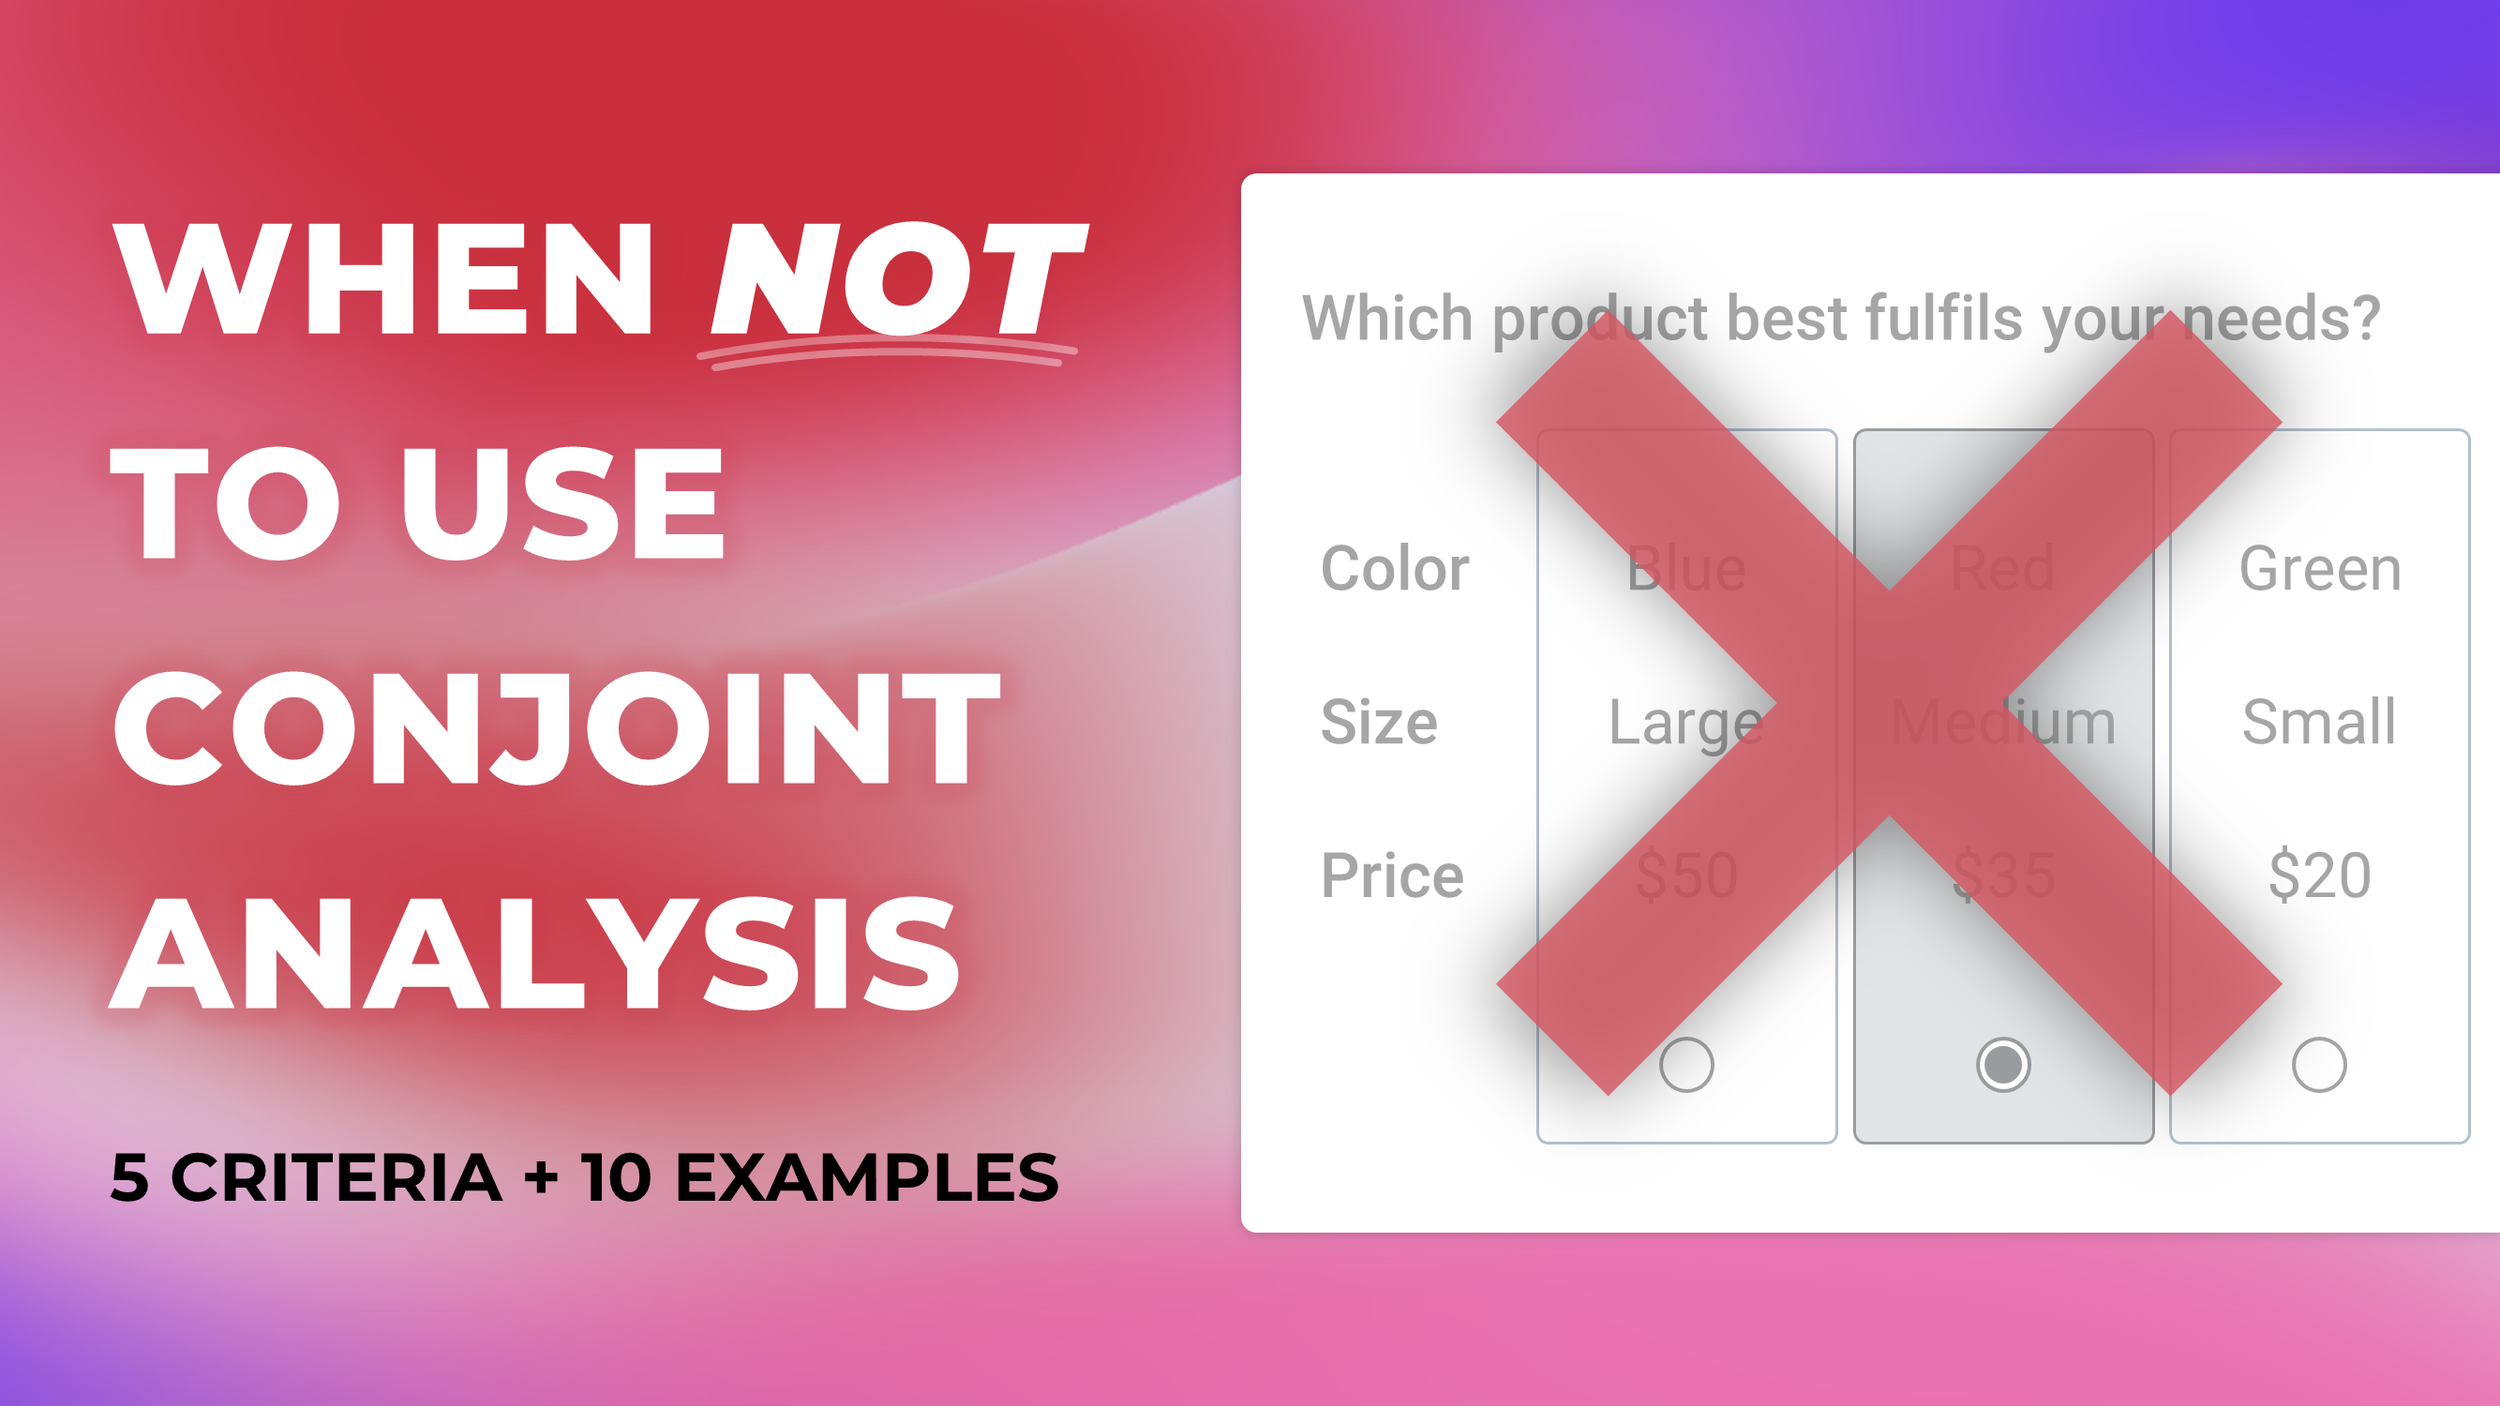
What does a conjoint analysis survey look like?
A conjoint survey shows two or more product "profiles" that represent variations of the same product. Each profile has the same attribute categories, but the options shown for those categories vary between profiles. When a participant picks their preferred profile, the vote is recorded and a new set of profiles appears.
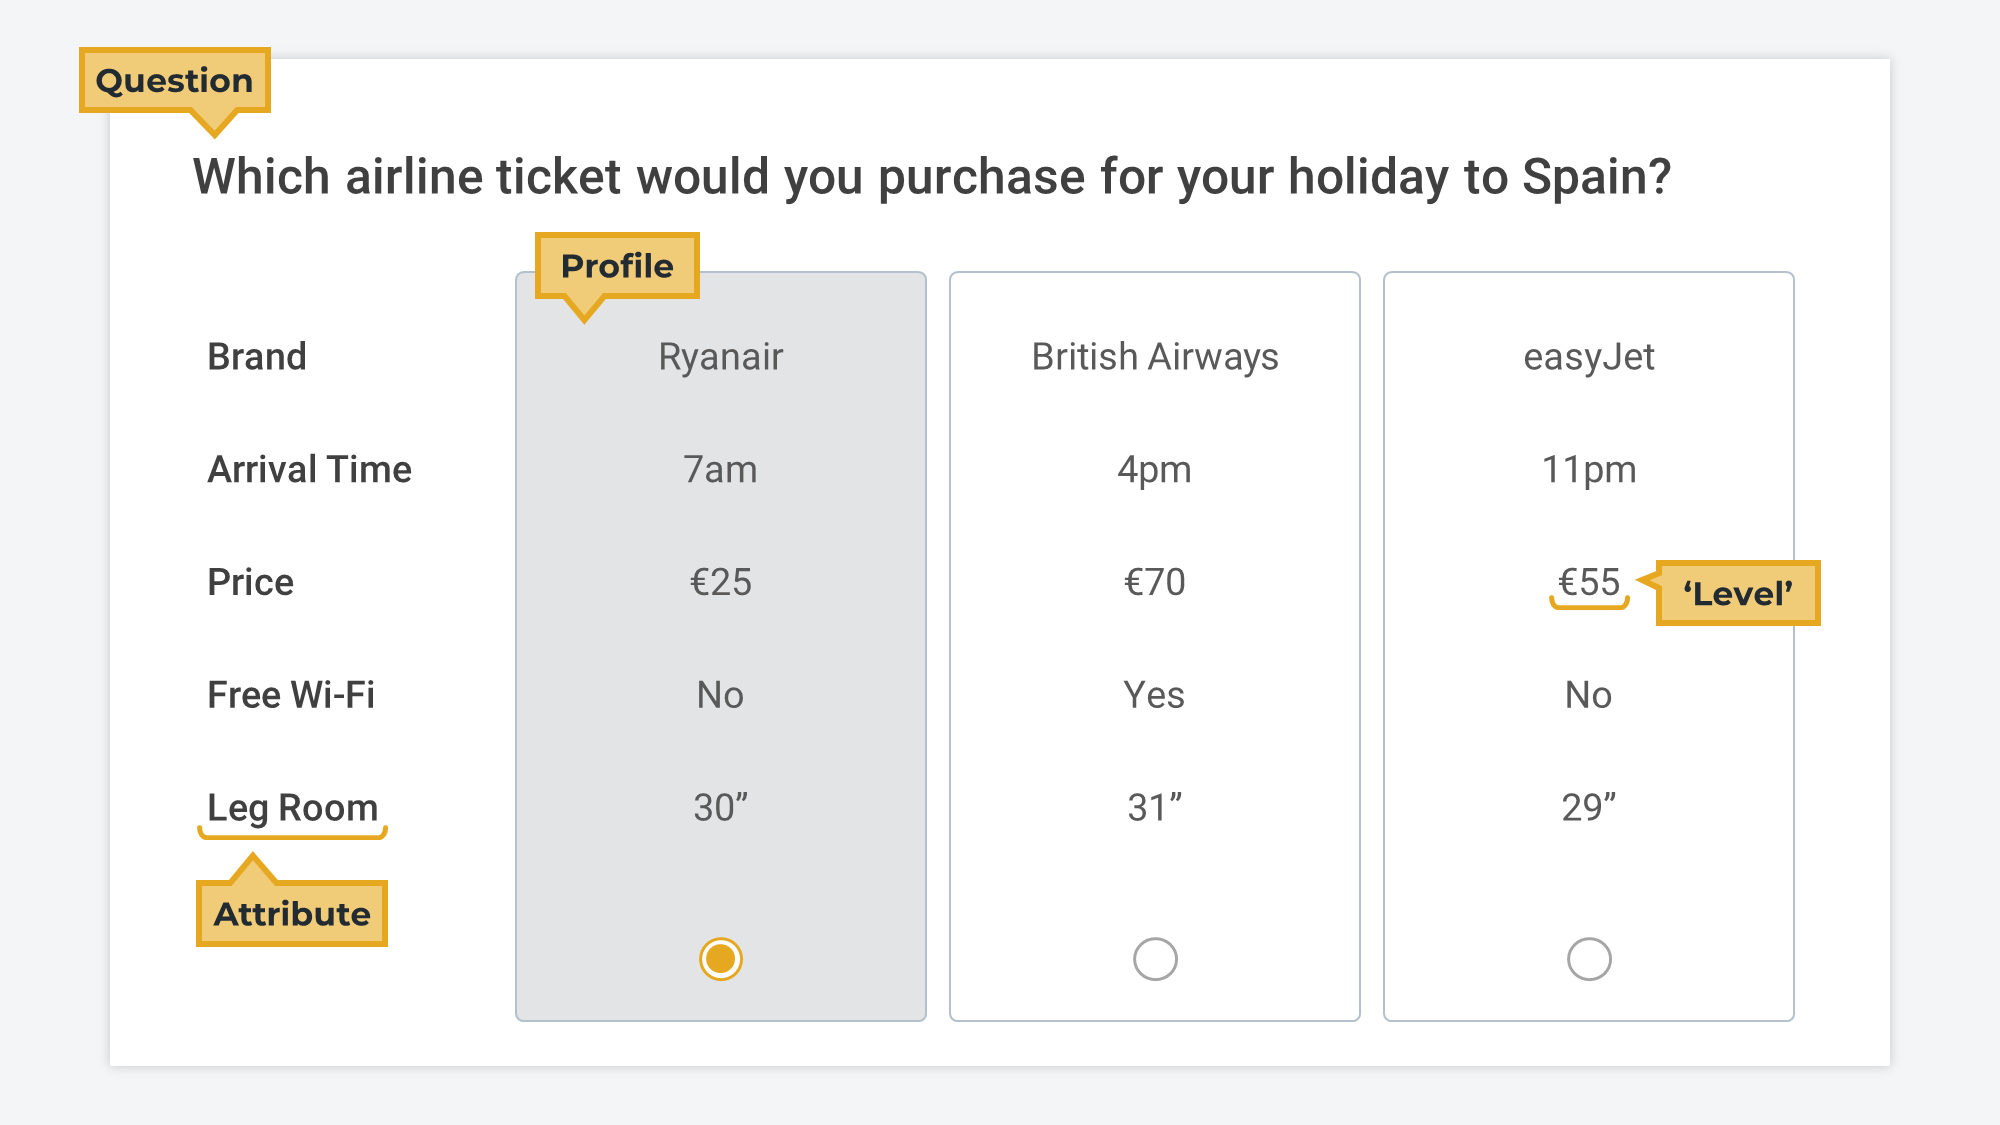
There are four components:
Question: gives the participant context about the product decision they're simulating.
Profile: a complete set of attribute values that make up a potential product offering.
Attributes: the characteristics relevant to a purchase decision (the interface calls these categories).
Levels: the range of values within each attribute (the interface calls these options).
It comes in several types, and there's an interactive demo you can vote on yourself in the full conjoint guide.
The 5 criteria required for using conjoint analysis
Conjoint simulates a purchase decision where a customer compares a set of similar products. It takes a rational view: that customers decide by comparing individual attributes like price, brand and features, and combine those into an overall value they weigh against other products.
That's a sterile view of how people buy, and it misses a lot, which is why conjoint only suits scenarios where all five of these hold:
You're simulating a simple, well-considered purchase between similar products.
Only one person is involved in the purchase decision.
The customer already knows what kind of product they need.
You know which attributes the customer uses to compare products.
Those attributes have no overlap in meaning or possible options.
These are very specific requirements, because conjoint is a very specific format. Plenty of other methods also model preferences through forced trade-offs, with far more flexibility than a hypothetical purchase scenario.
3 research projects suited to conjoint analysis
(i) Calculating willingness to pay for existing features
Conjoint produces utility scores, which show the relative importance of each attribute or level. If one attribute is price, you can convert the utility scores into a currency equivalent to work out how many dollars equal one utility unit, and from there how much more customers will pay for some attributes than others. This is marginal willingness to pay. You need existing price estimates to do it, so it only suits existing products; with no pricing starting point, use a Van Westendorp survey instead.
(ii) Assembling the optimal product mix or bundle
You can use the willingness-to-pay data to build your product mix, or use TURF, an analysis applied on top of conjoint data to find the optimal attribute mix. TURF stands for Total Unduplicated Reach and Frequency: which combination of features reaches the most people while hitting a desirable level of saturation. Since conjoint has already mapped preferences toward attributes, TURF matches the options with the highest combined preference to appeal to as many people as possible.
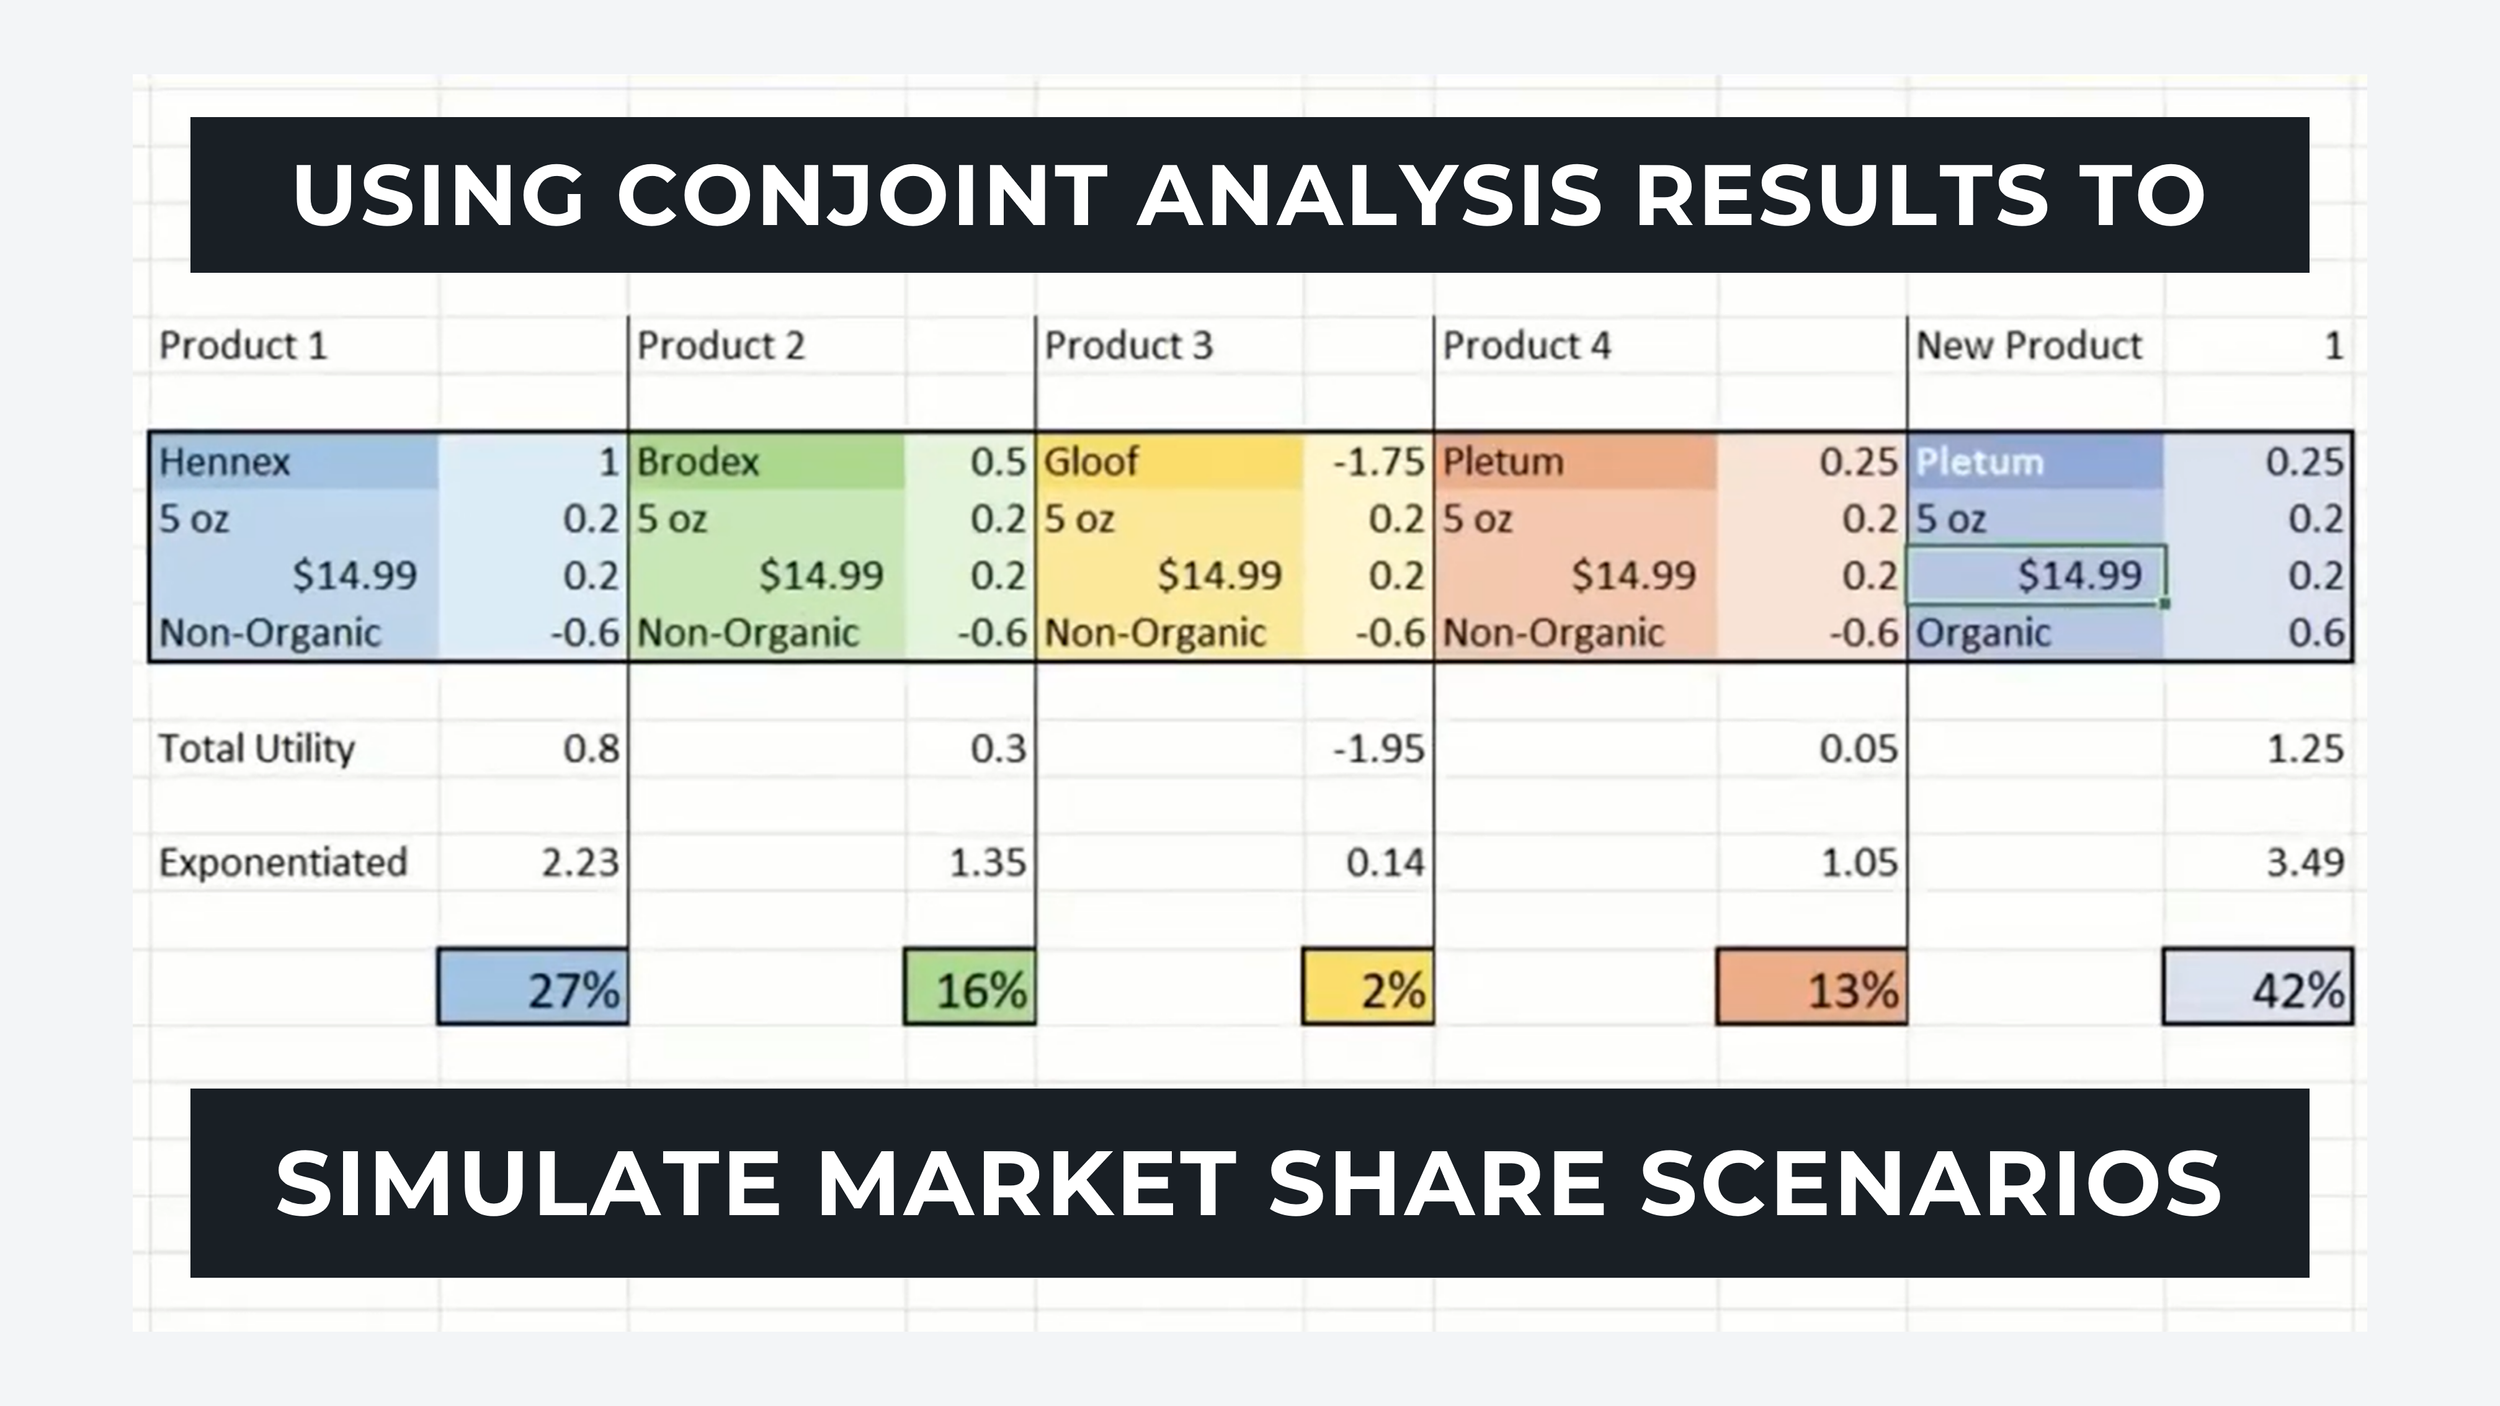
(iii) Modelling market share scenarios
You can also use utility scores to simulate which attribute choices would produce the largest market share for your concept against competitors. The conjoint market simulator does this automatically.
10 research scenarios where you should NOT use conjoint analysis
This is the part most guides skip. Conjoint has a reputation as the serious pricing method, so people reach for it in situations it was never built for. Here are ten where something simpler is the right call.
1. Simple trade-offs. ❌ Most of the time conjoint is overkill, because you're just trying to rank a set of options by importance to customers or colleagues. You can do that far more easily with pairwise comparison, rank ordering or points allocation. No need to spend on a conjoint tool and a specialist agency for setup and analysis; just pick a simpler choice-based ranking method.
2. One category. ❌ In a well-known Reddit example, an HR manager asks about using conjoint to plan an employee benefits programme. Conjoint requires attribute categories, so they'd have to split benefits into wellness, healthcare, professional development, and so on. The catch: conjoint won't let them compare benefits placed in separate categories, so they'd spend a lot of time and money on inconclusive data that doesn't answer their question.
3. Impulse purchases. ❌ The method assumes people compare products against alternatives before buying. That isn't how impulse buys work, like consumer goods, sale items, or products bought straight off an online ad, where no considered comparison happens.
4. Complex purchases. ❌ Complex purchases don't simulate well, like buying B2B software, where attributes are hard to compare directly or where multiple stakeholders are involved (the buyer and the end user being different people).
5. Intangible attributes. ❌ The method only measures tangible attributes like brand, price and quality. Many decisions, especially in B2B, are driven by intangibles: the customer's need, pain or desire. Conjoint focuses on features and capabilities at the expense of the real drivers of motivation. A better fit there is customer problem stack ranking.
6. No benchmark price. ❌ Conjoint is famous for pricing research, but it tests pricing rather than sets it. You need 2 to 7 candidate price points just to build the survey. Starting from zero, conjoint forces you to guess estimates that may be far off, so you're better off starting with a Van Westendorp survey (our guide walks through it).
7. Emerging opportunity. ❌ Designing a conjoint survey is genuinely tricky, especially defining the attributes and levels. You need 2 to 7 attribute groups with 2 to 7 levels each, and every attribute must meet criteria like MECE (mutually exclusive and collectively exhaustive), unidimensionality (each attribute is a single dimension of variation), and salience (attributes are genuine factors customers use to compare). You need a well-understood product space, so conjoint isn't suited to emerging categories or innovations where the comparison attributes aren't yet defined.
8. New features. ❌ If the market hasn't seen a feature, you probably can't explain it in under five words (there's a 20 to 30 character limit on conjoint levels). Every participant interprets it differently, creating messy, inconclusive results. And conjoint simulates a purchase, which isn't how you should prioritise a roadmap anyway; use something like customer problem stack ranking to find the highest-priority problems to solve next.
9. Attribute quantity. ❌ Conjoint is a fixed format: 2 to 7 attribute categories, 2 to 7 levels each. Many researchers have more or fewer and force their research into the conjoint shape when it doesn't fit. There are plenty of other ways to do comparison-based ranking, including formats for long lists, so don't let conjoint's rigid requirements stop you.
10. Relationship complexity. ❌ The format was designed in the 1970s and 80s for simulating purchases between physical products. For many software products it's not easy to split feature capabilities into neat categories like battery life, storage and packaging colour. Software features have complex, interdependent relationships that are hard to isolate and explain in 20 to 30 characters, especially in B2B, while also meeting MECE, unidimensionality and salience.
When conjoint is the wrong tool, and what that costs
The most common mistake I see is that conjoint encourages you to split options into separate attributes that can't be compared at the end of your research. You can avoid it three ways: hire a conjoint specialist, understand when not to use conjoint in the first place, and know the alternative methods for modelling trade-offs and priorities. Used inside its five criteria, conjoint is excellent. Used outside them, it's an expensive way to answer the wrong question.
Frequently asked questions
When should you use conjoint analysis? When you're simulating a simple, well-considered purchase between similar products, with one decision-maker, a customer who knows what they need, and a set of tangible, non-overlapping attributes you understand. It's strong for willingness to pay on existing features, bundling, and market-share modelling.
When should you NOT use conjoint analysis? When you only need to rank a list (use a simpler method), when options don't split into separate comparable categories, for impulse or complex multi-stakeholder purchases, when the drivers are intangible, when you have no benchmark price, for emerging categories or brand-new features, when your attribute count doesn't fit 2 to 7, or when features are too interdependent to isolate.
What should you use instead of conjoint analysis? For simple prioritisation, pairwise comparison, rank ordering or points allocation. For customer problems and roadmap priorities, customer problem stack ranking. For pricing with no benchmark, Van Westendorp. For ranking a long list, a method built for long lists.
Can conjoint analysis set a price from scratch? No. Conjoint tests pricing rather than sets it, since you need 2 to 7 candidate price points to build the survey. With no starting point, use Van Westendorp first to find a plausible range, then conjoint to test within it.
Why is conjoint analysis so hard to design? Because every attribute has to meet MECE, unidimensionality and salience, you need 2 to 7 attributes with 2 to 7 levels each, and each level has to be explained in 20 to 30 characters. That's a lot of constraints, which is why it needs a well-understood product space.
So learn the five criteria and the ten scenarios where conjoint is the wrong tool. The mistake it saves you from is the expensive one: a clean, well-run study that answers a question you never needed answered.
Want more like this? Over 42,000 researchers and product people get The Full-Stack Researcher in their inbox. Subscribe for the next one.
When conjoint is the right tool, you can run it on OpinionX for free: $0, unlimited surveys, unlimited researcher seats, capped at 25 participants per survey, then $900 a year to lift the cap (full pricing). And when it isn't, the same free tier runs the simpler methods this guide points you to. Create a conjoint survey, or read the full conjoint guide first.
About The Author:
Daniel Kyne is the Co-Founder of OpinionX, a free research tool for stack ranking people’s priorities — used by tens of thousands of teams to better understand what matters most to their customers.