
“A website A/B test needs a huge audience to reach statistical significance (Ronny Kohavi puts it at around 200,000 users for a retail site), which puts it out of reach for most teams. A/B testing surveys sidestep that. Instead of splitting live traffic, you show people the options directly and measure which wins, so you can test images, ad copy, ideas, sales messaging or problem statements with far fewer participants.”
There are two survey approaches: comparative preference testing (forced head-to-head choices, usually pairwise comparison) and monadic studies (each option shown in isolation and scored separately). Pairwise comparison is the workhorse: ranking 20 options needs a minimum of about 29 participants, not tens of thousands. Whichever you pick, plan for segmentation, because the option "people" prefer on average is often not the one your best-fit customers pick.
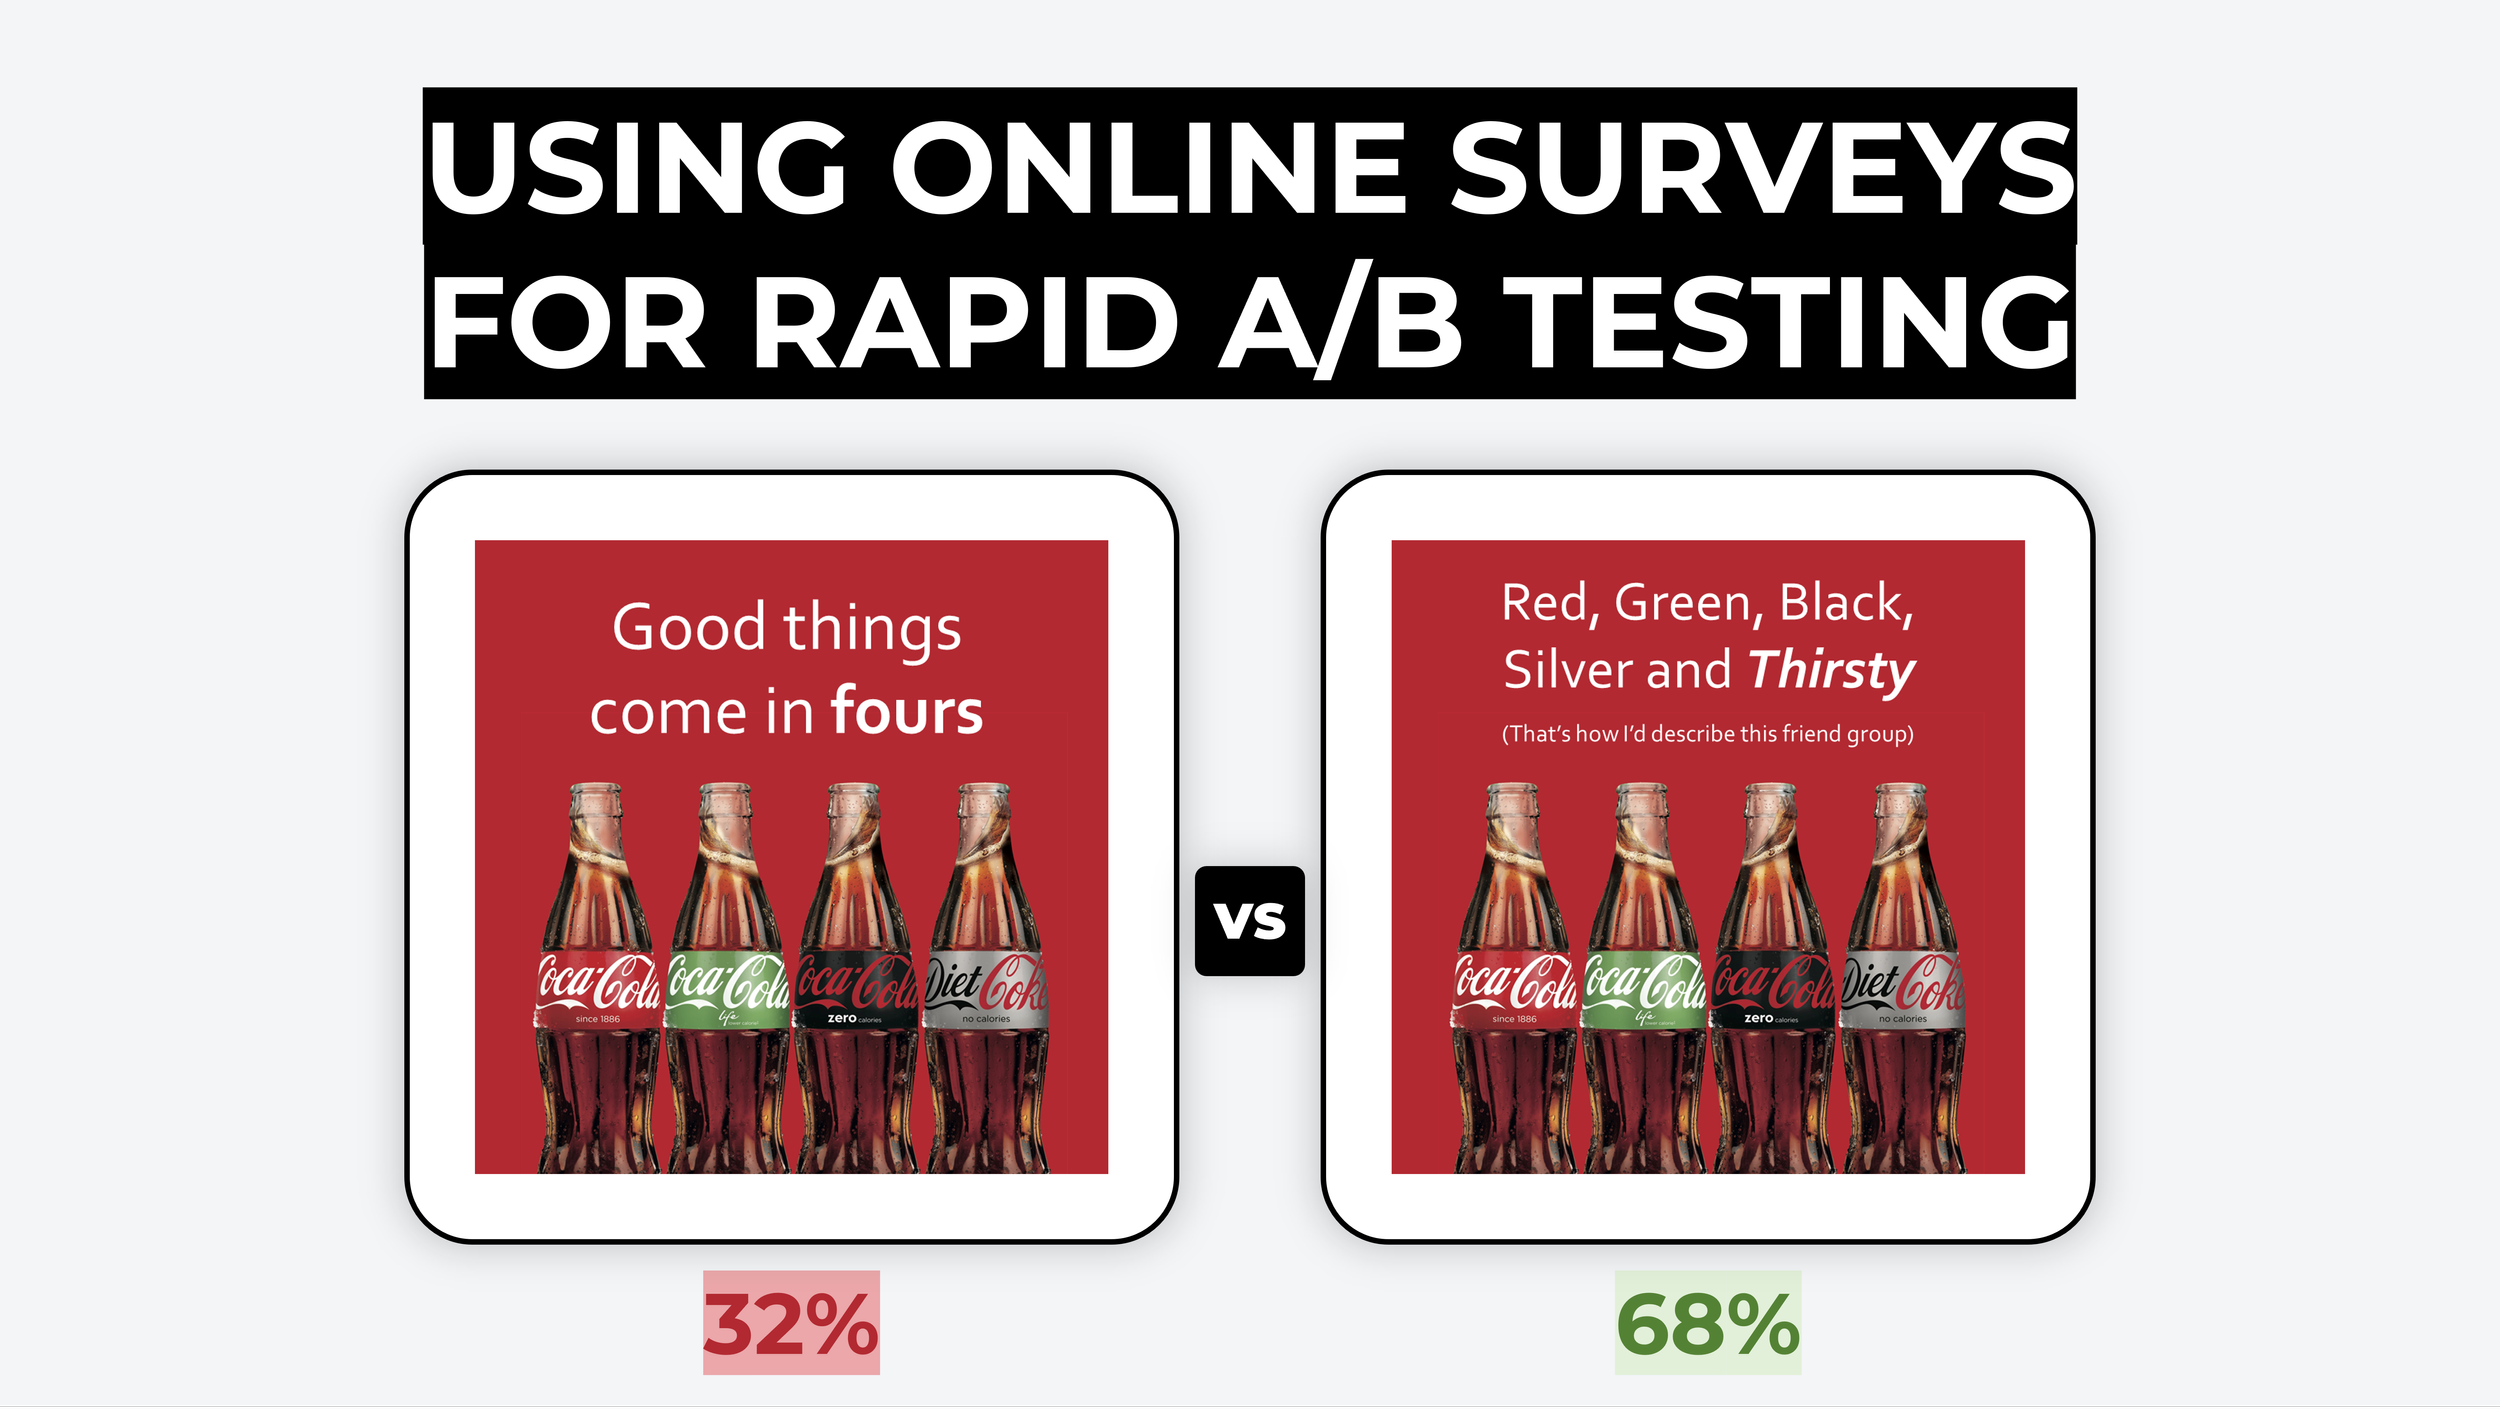
What is A/B testing?
An A/B test is an experiment that compares two or more versions of something (a webpage, an advert, a message) to see which performs better. Usually you split people into groups, show each group a different version, and measure which one gets the most clicks or customers.
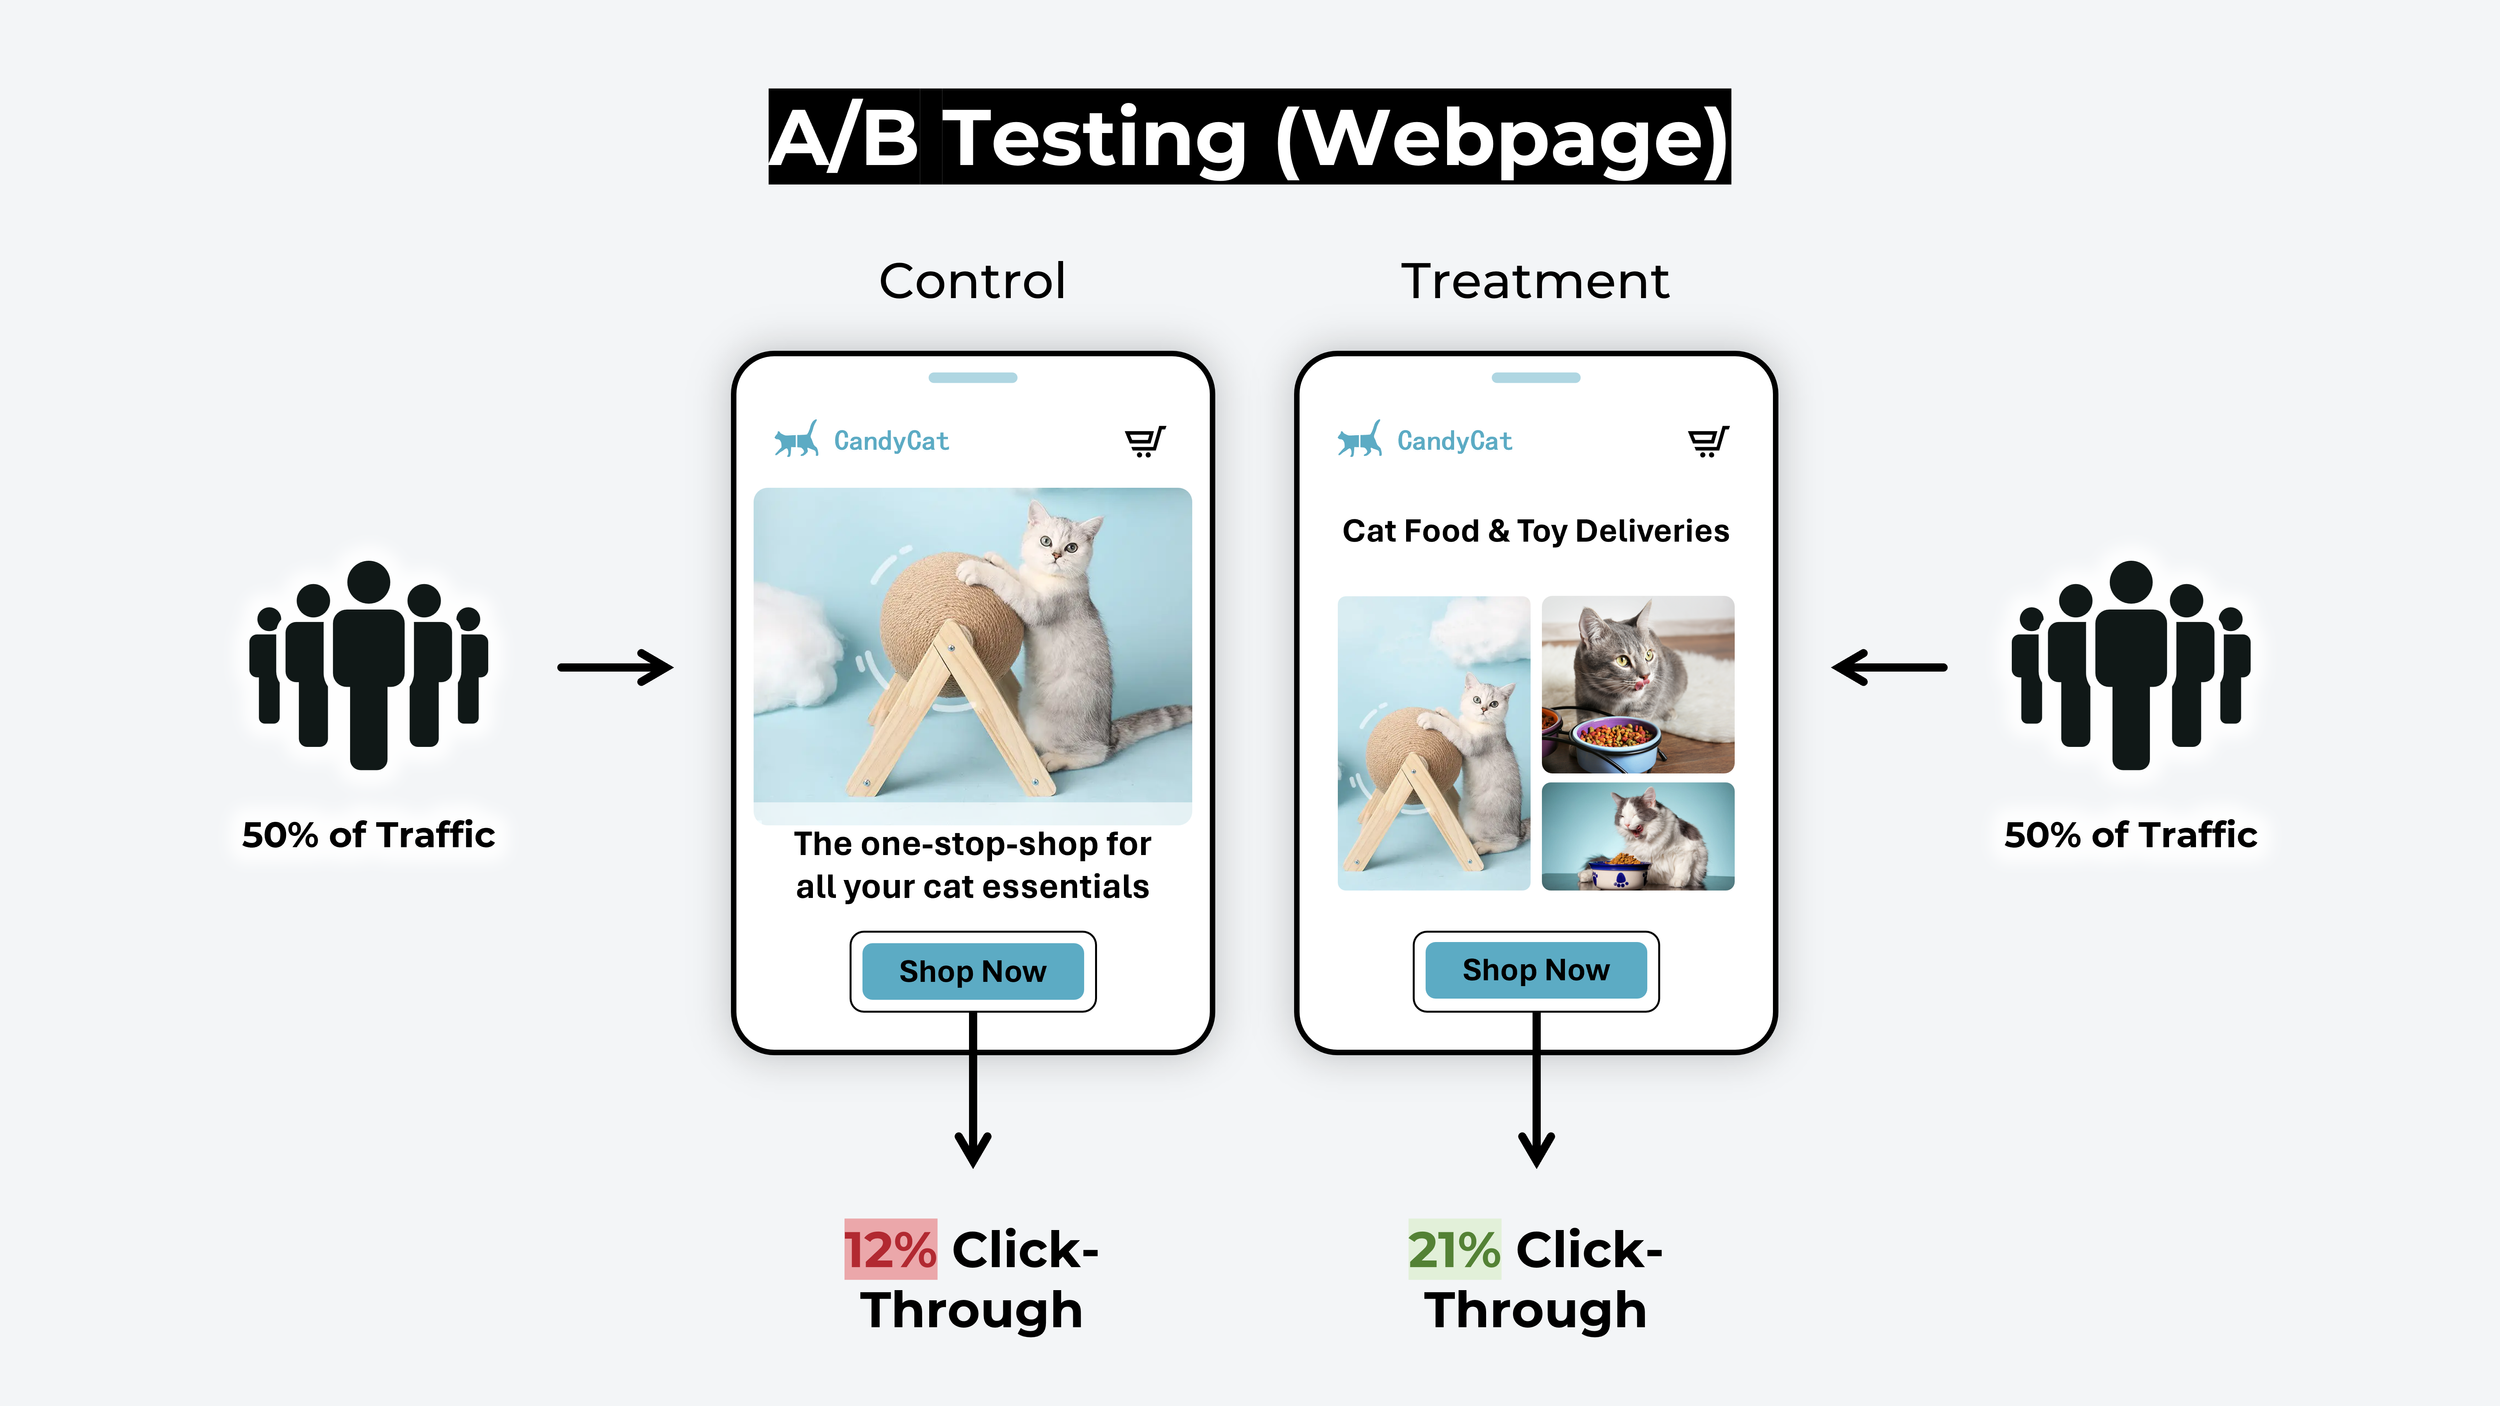
One of the biggest challenges with an A/B test is that you need a LOT of people to get statistically valid results. Ronny Kohavi (former Vice President at Airbnb, Microsoft and Amazon) says that "unless you have at least tens of thousands of users for an A/B test, the statistics just don't work out. A retail site trying to detect changes will need something like 200,000 users".
Well, that's disappointing… most of us don't have 200,000 people waiting around for an experiment! The good news is you can use the principles of A/B testing with far smaller samples when comparing design mockups, concept images, ad copy, problem statements, sales messaging, and loads more.
So what would an A/B testing survey look like?
How do you run an A/B testing survey?
There are two ways you can run an A/B testing survey online:
Regardless of which you choose, it's essential that your analysis also includes:
1. Comparative preference testing
Comparative Preference Testing (also known as discrete choice analysis) is a research technique that forces people to compare options head-to-head and analyses their votes to work out which they like or dislike most.
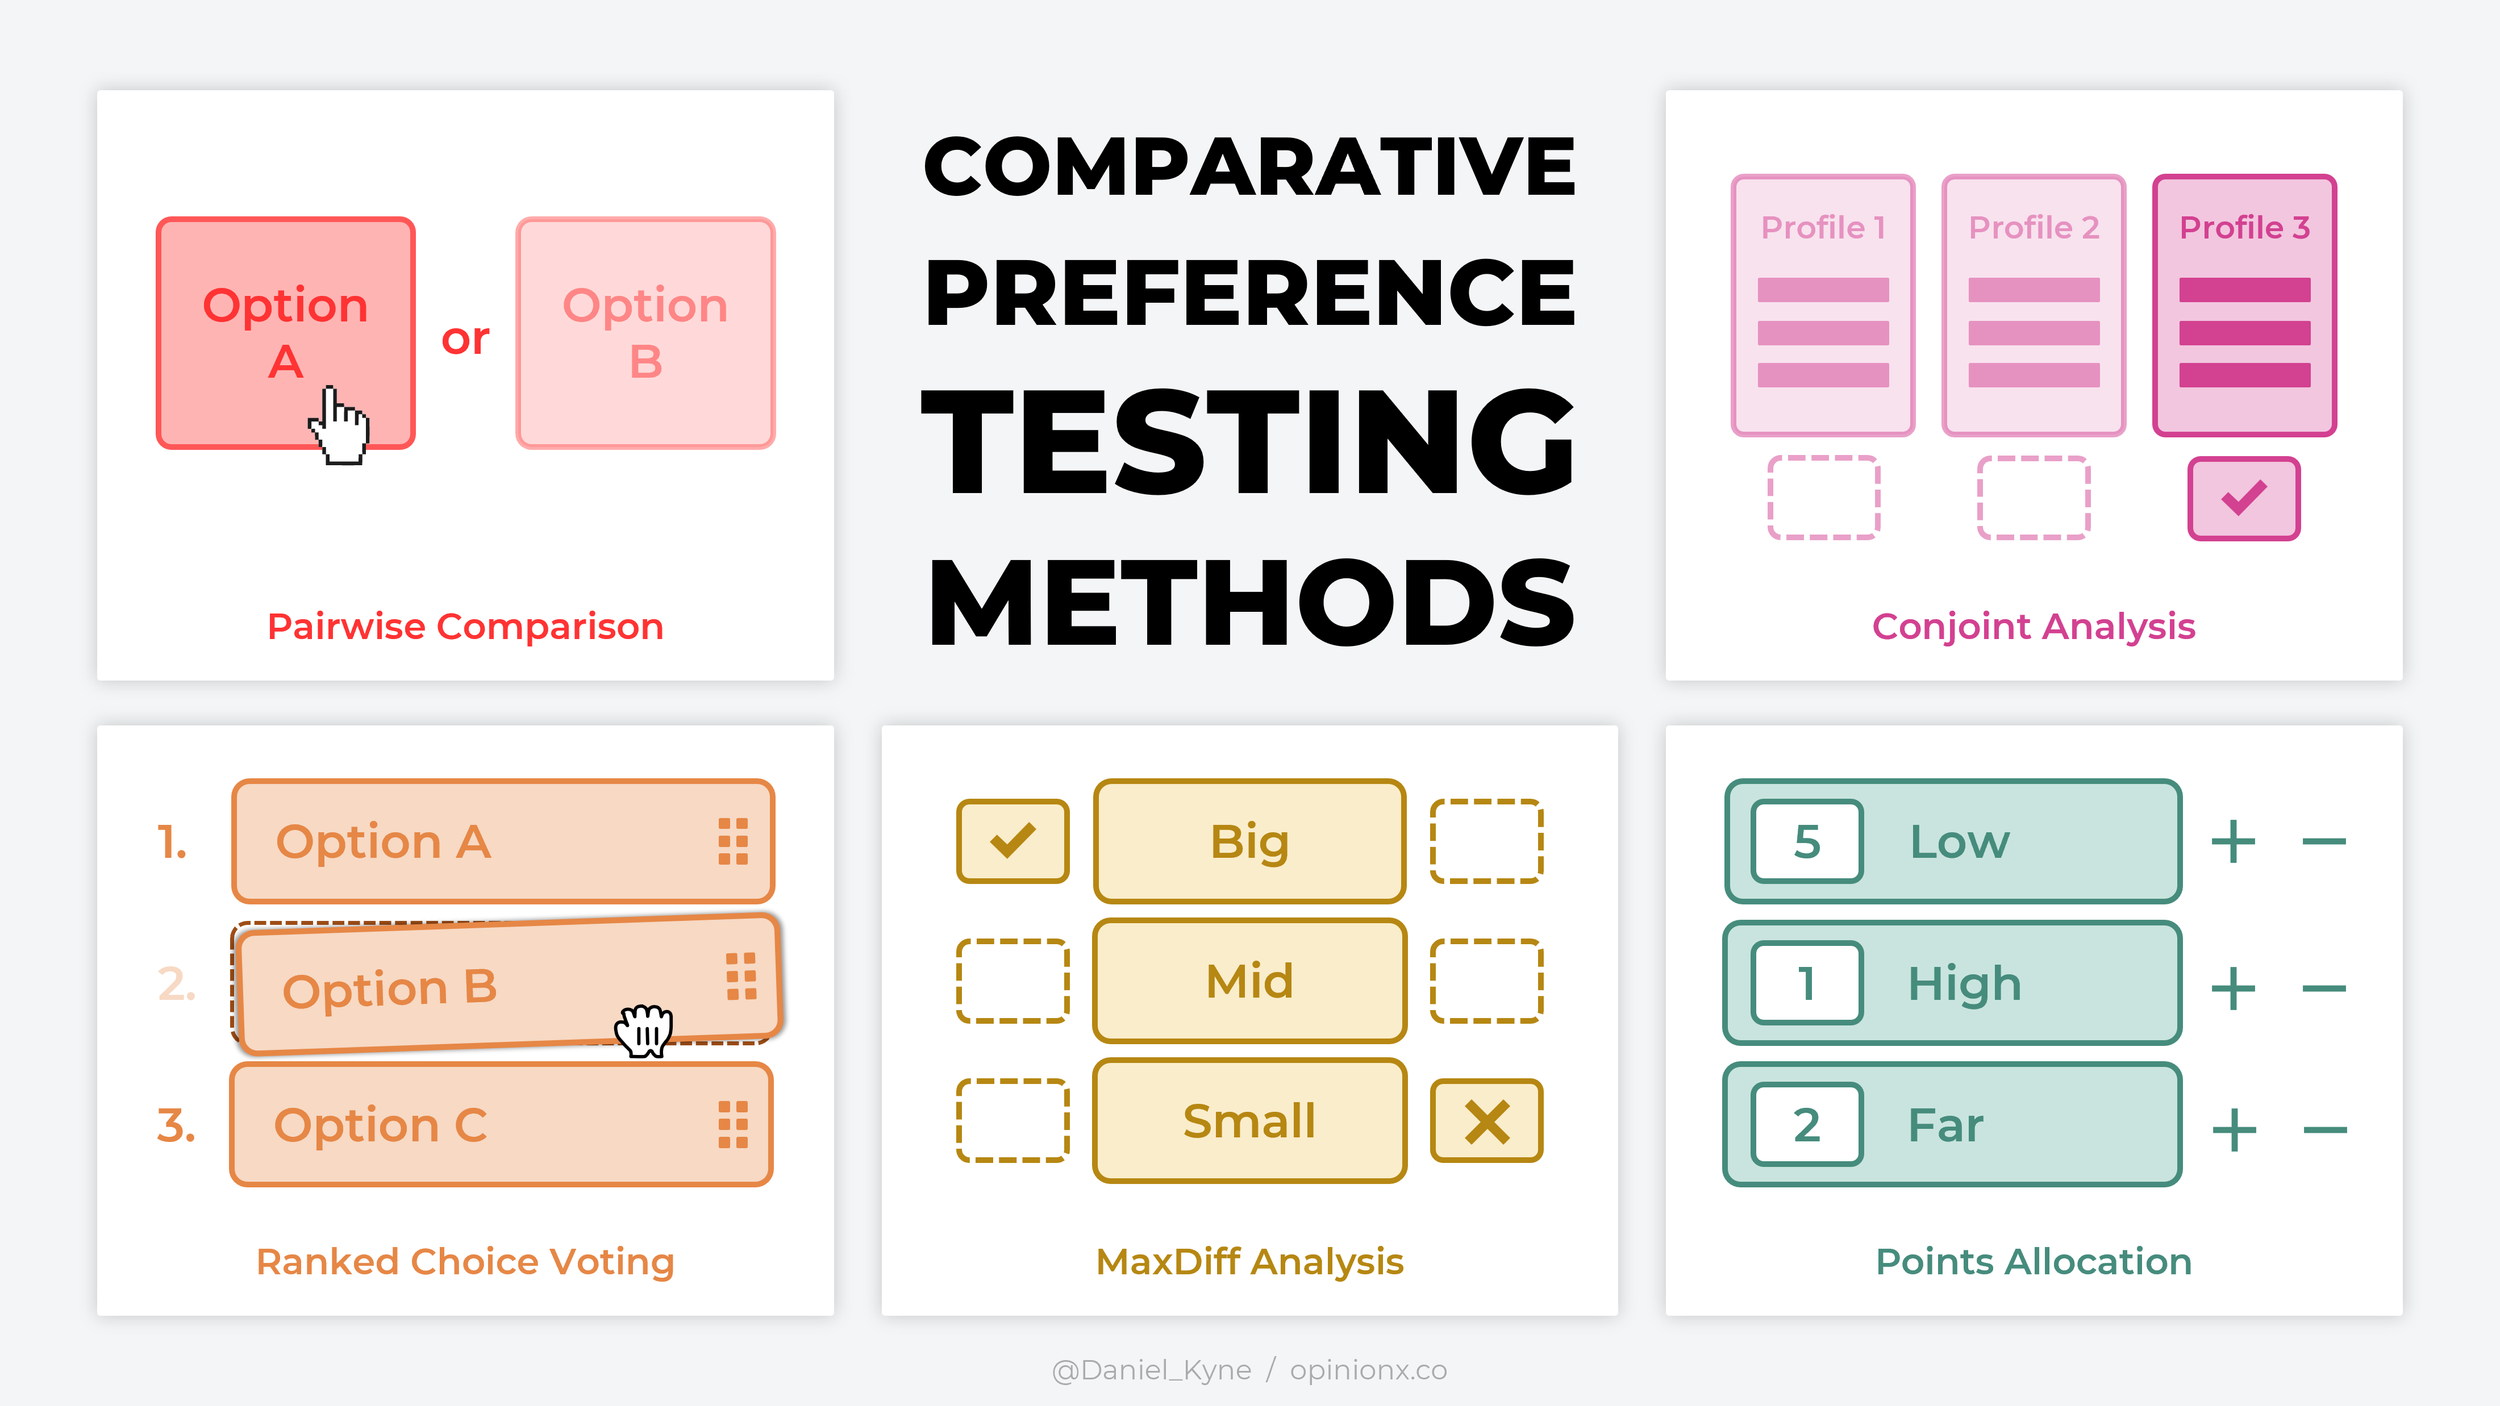
Forced-comparison formats that suit an A/B testing survey:
Pairwise Comparison, shows two options at a time in a series of head-to-head votes.
Points Allocation, distribute a pool of points by preference.
Ranked Choice Voting, rank the options by preference.
MaxDiff Analysis, pick the best and worst options from a list of 3-6 choices.
Conjoint Analysis, pick the best 'profile' (made up of a series of category-based variables) to identify the most important category and the ranked order of variables within each.
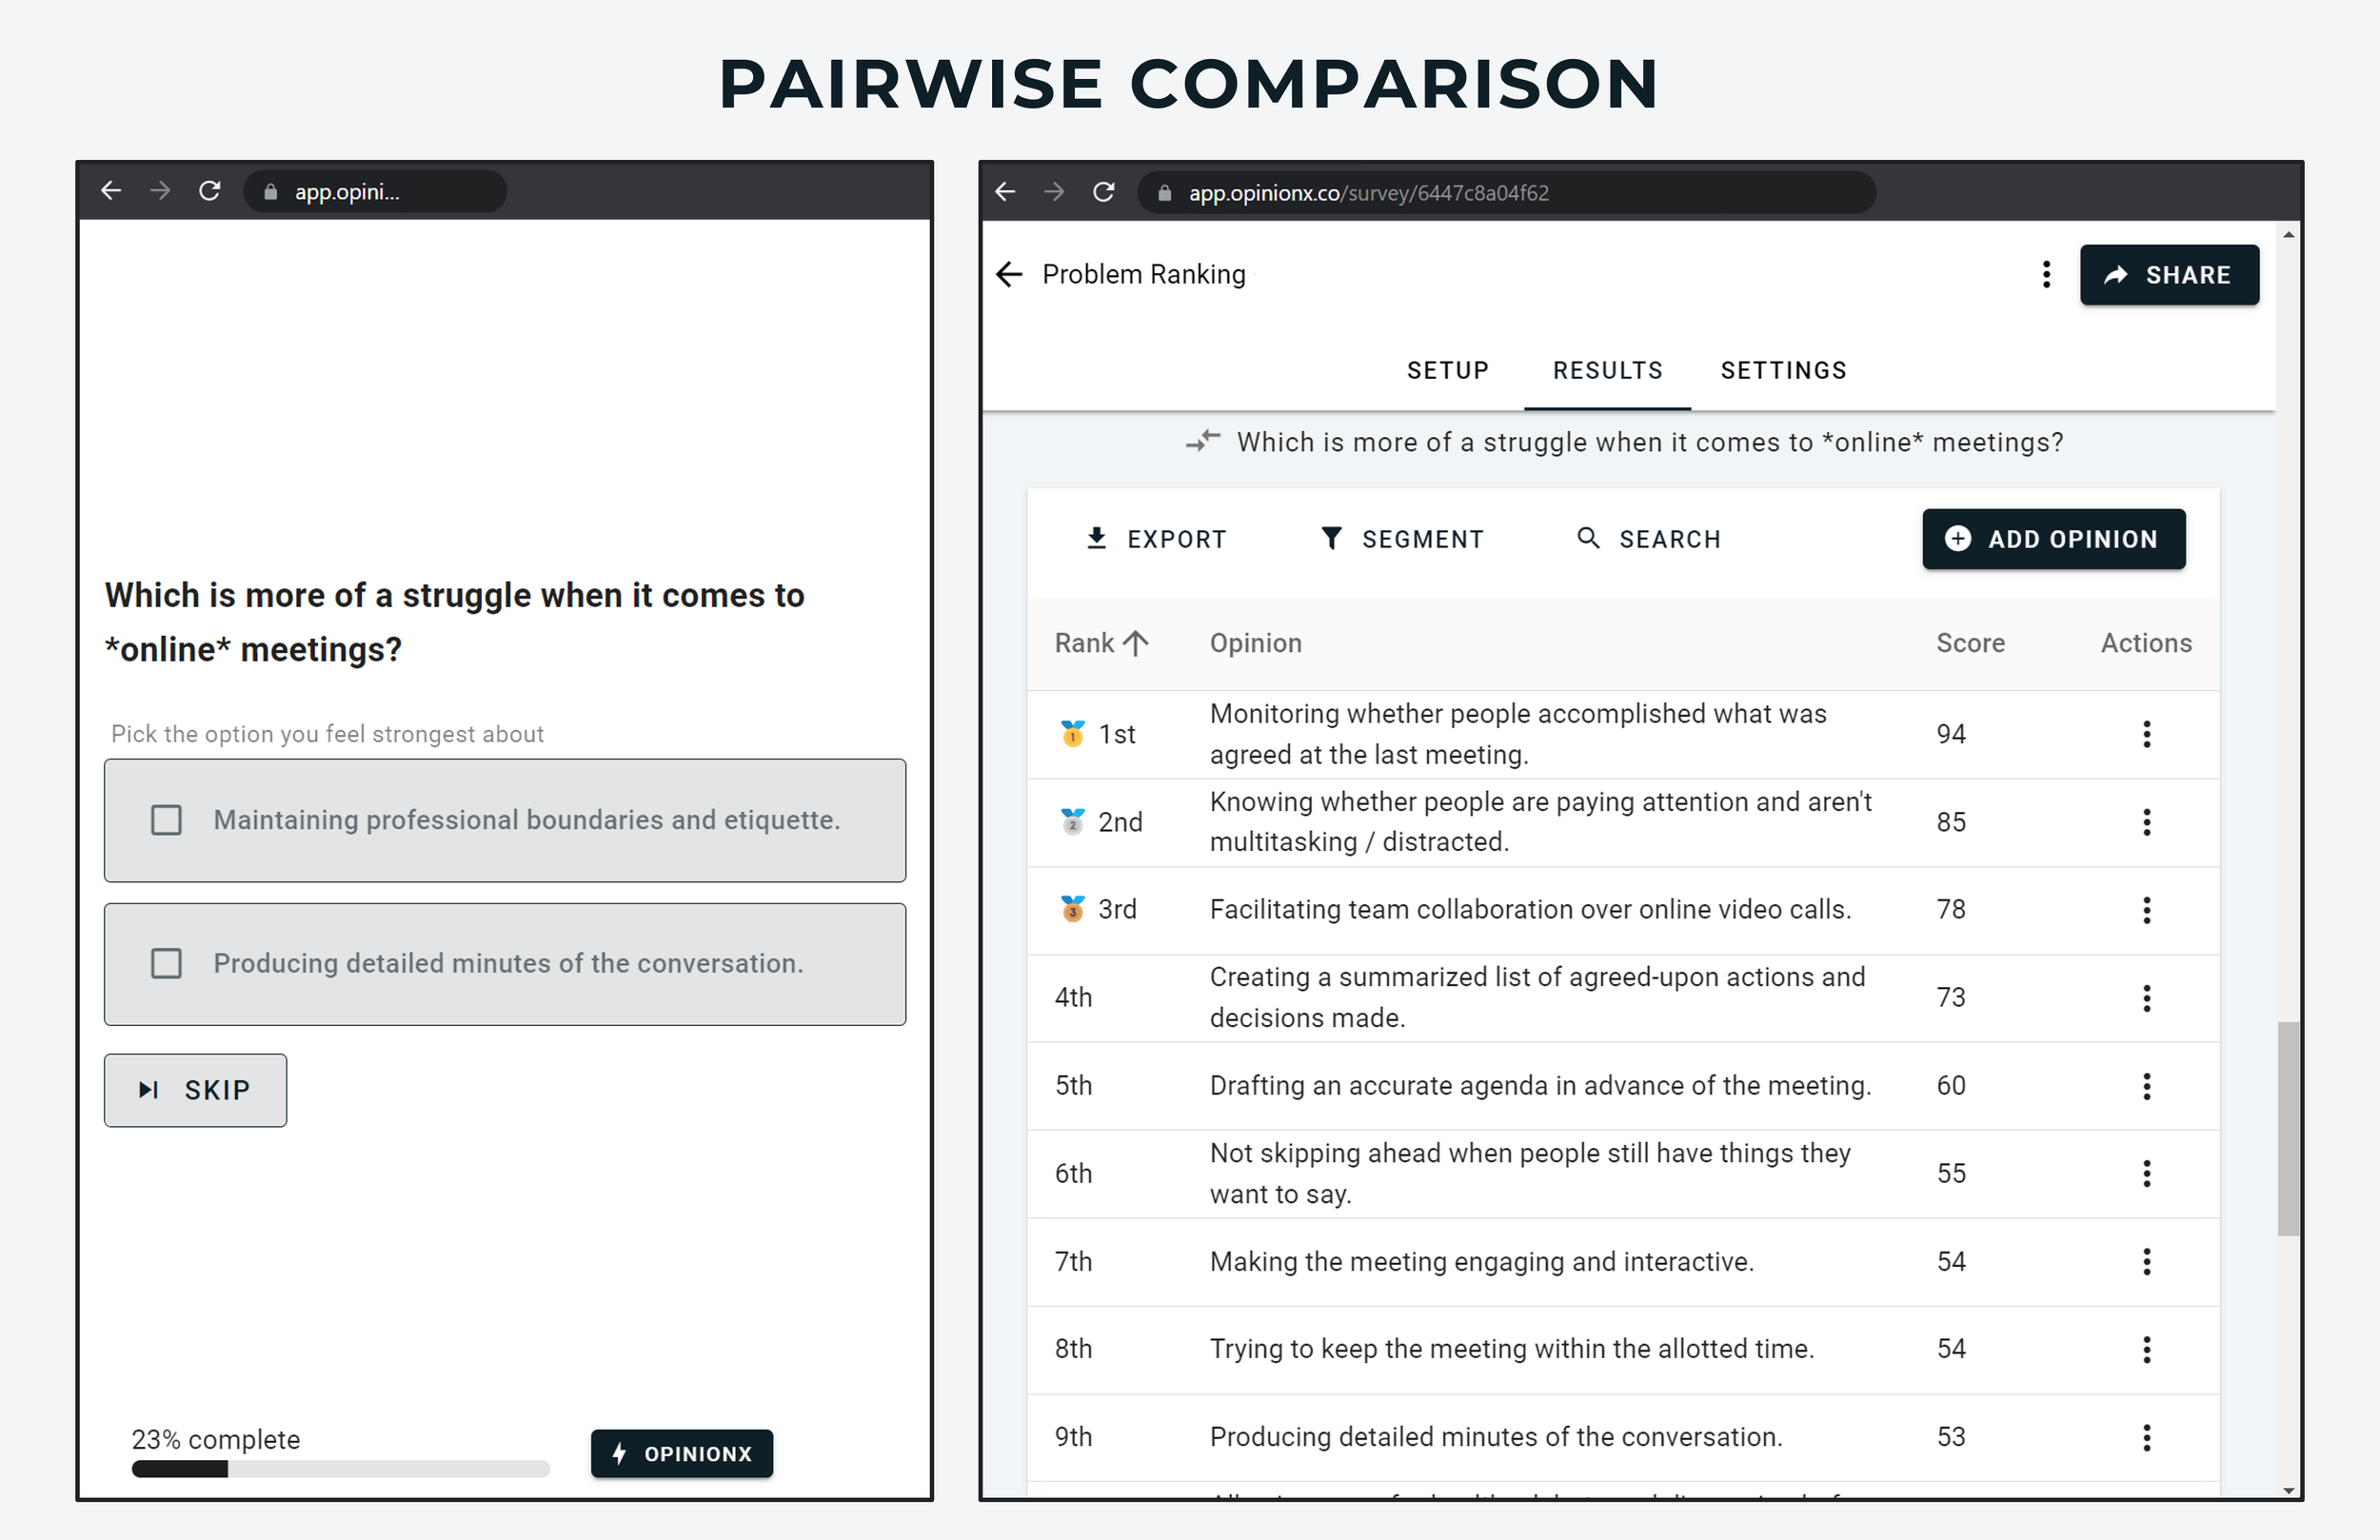
Pairwise comparison is a simple format: it shows two options at a time and asks the person to pick the one they feel strongest about (most preferred, most urgent, most disliked, whatever context you set). Each time they choose, two new options replace the pair. Those choices calculate a "win rate" for each option, i.e. how often it got picked across all the pairs it appeared in.
The big benefit of a comparative method like pairwise is that it matches how people actually decide in real life: comparing the options in front of them and picking the one that fits their current needs, pains or desires.
Pairwise comparison needs WAY fewer participants than a website A/B test. If I have 20 options to rank and show each participant 20 pairs, I need a minimum of 29 participants to hit my sample-size requirement (detailed calculation here).
So how do you use pairwise comparison for an A/B test? An A/B test has two parts: controlled variables and a behavioural scenario. The controlled variables are your list of similar options (say, ten identical Instagram ad images, each with a different caption). The behavioural scenario is the context the participant pictures when they look (e.g. casually scrolling their Instagram feed).
Both map neatly onto a pairwise survey: the behavioural scenario goes in the question, and the controlled variables are the options you rank. Here's an example:
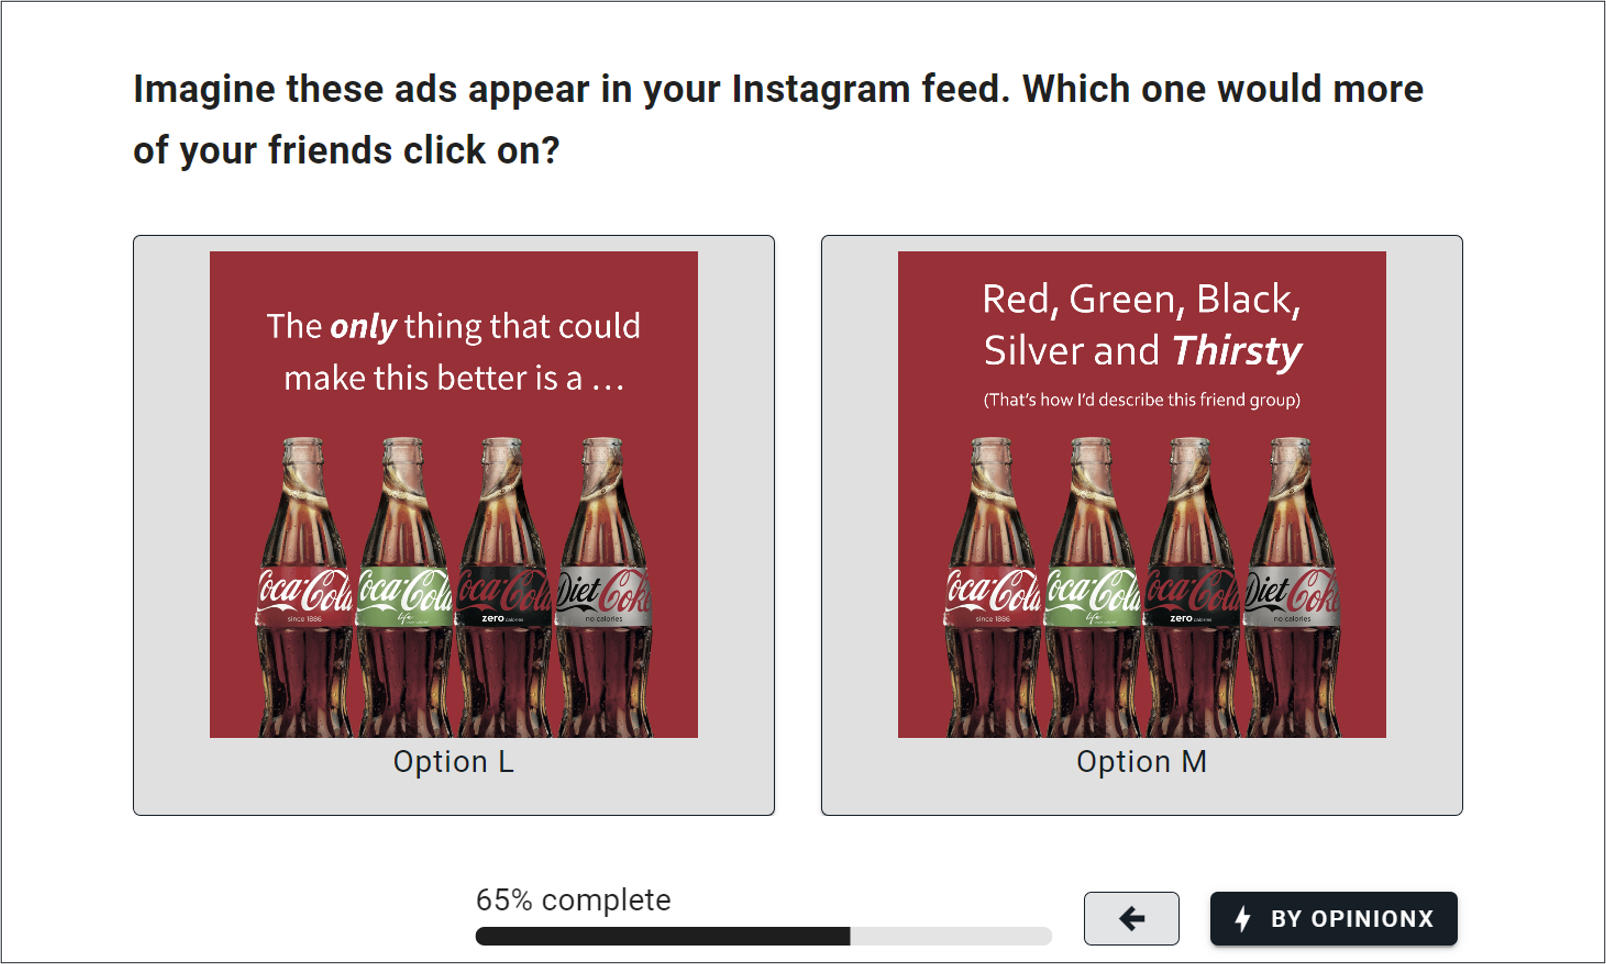
Once people have voted, you rank the options from 1st to last by "win rate". In the screenshot below, "Option H" scores 89: it appeared in 9 pairs and won 8 of them (8/9 = 89%).
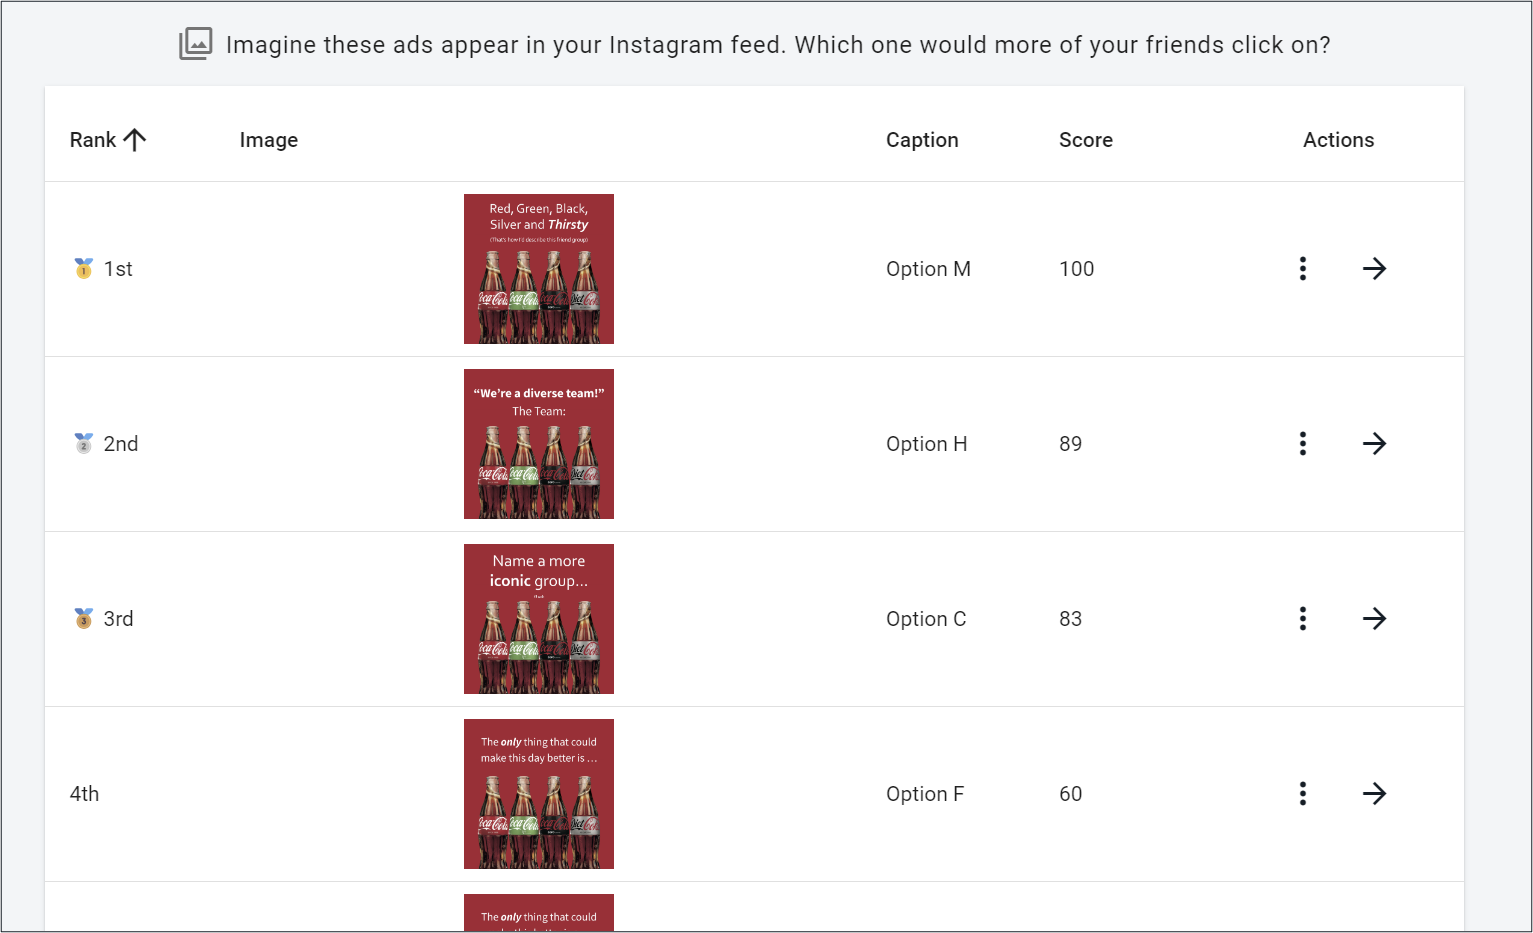
Both screenshots come from OpinionX, a free ranking survey tool with a bunch of comparison-based formats.
Setting up your first comparative A/B test and want a second pair of eyes on the design? Book a free 30-minute call and a research expert will help you frame the comparison, pick the right format and size the survey, no cost, no obligation.
2. Monadic studies
Monadic studies are basically the opposite of a comparative preference test. Instead of showing options together, you isolate them and show one at a time. Each option gets its own survey (with the same list of questions), sent to a separate group of participants. At the end, you aggregate and compare the results across all the surveys.
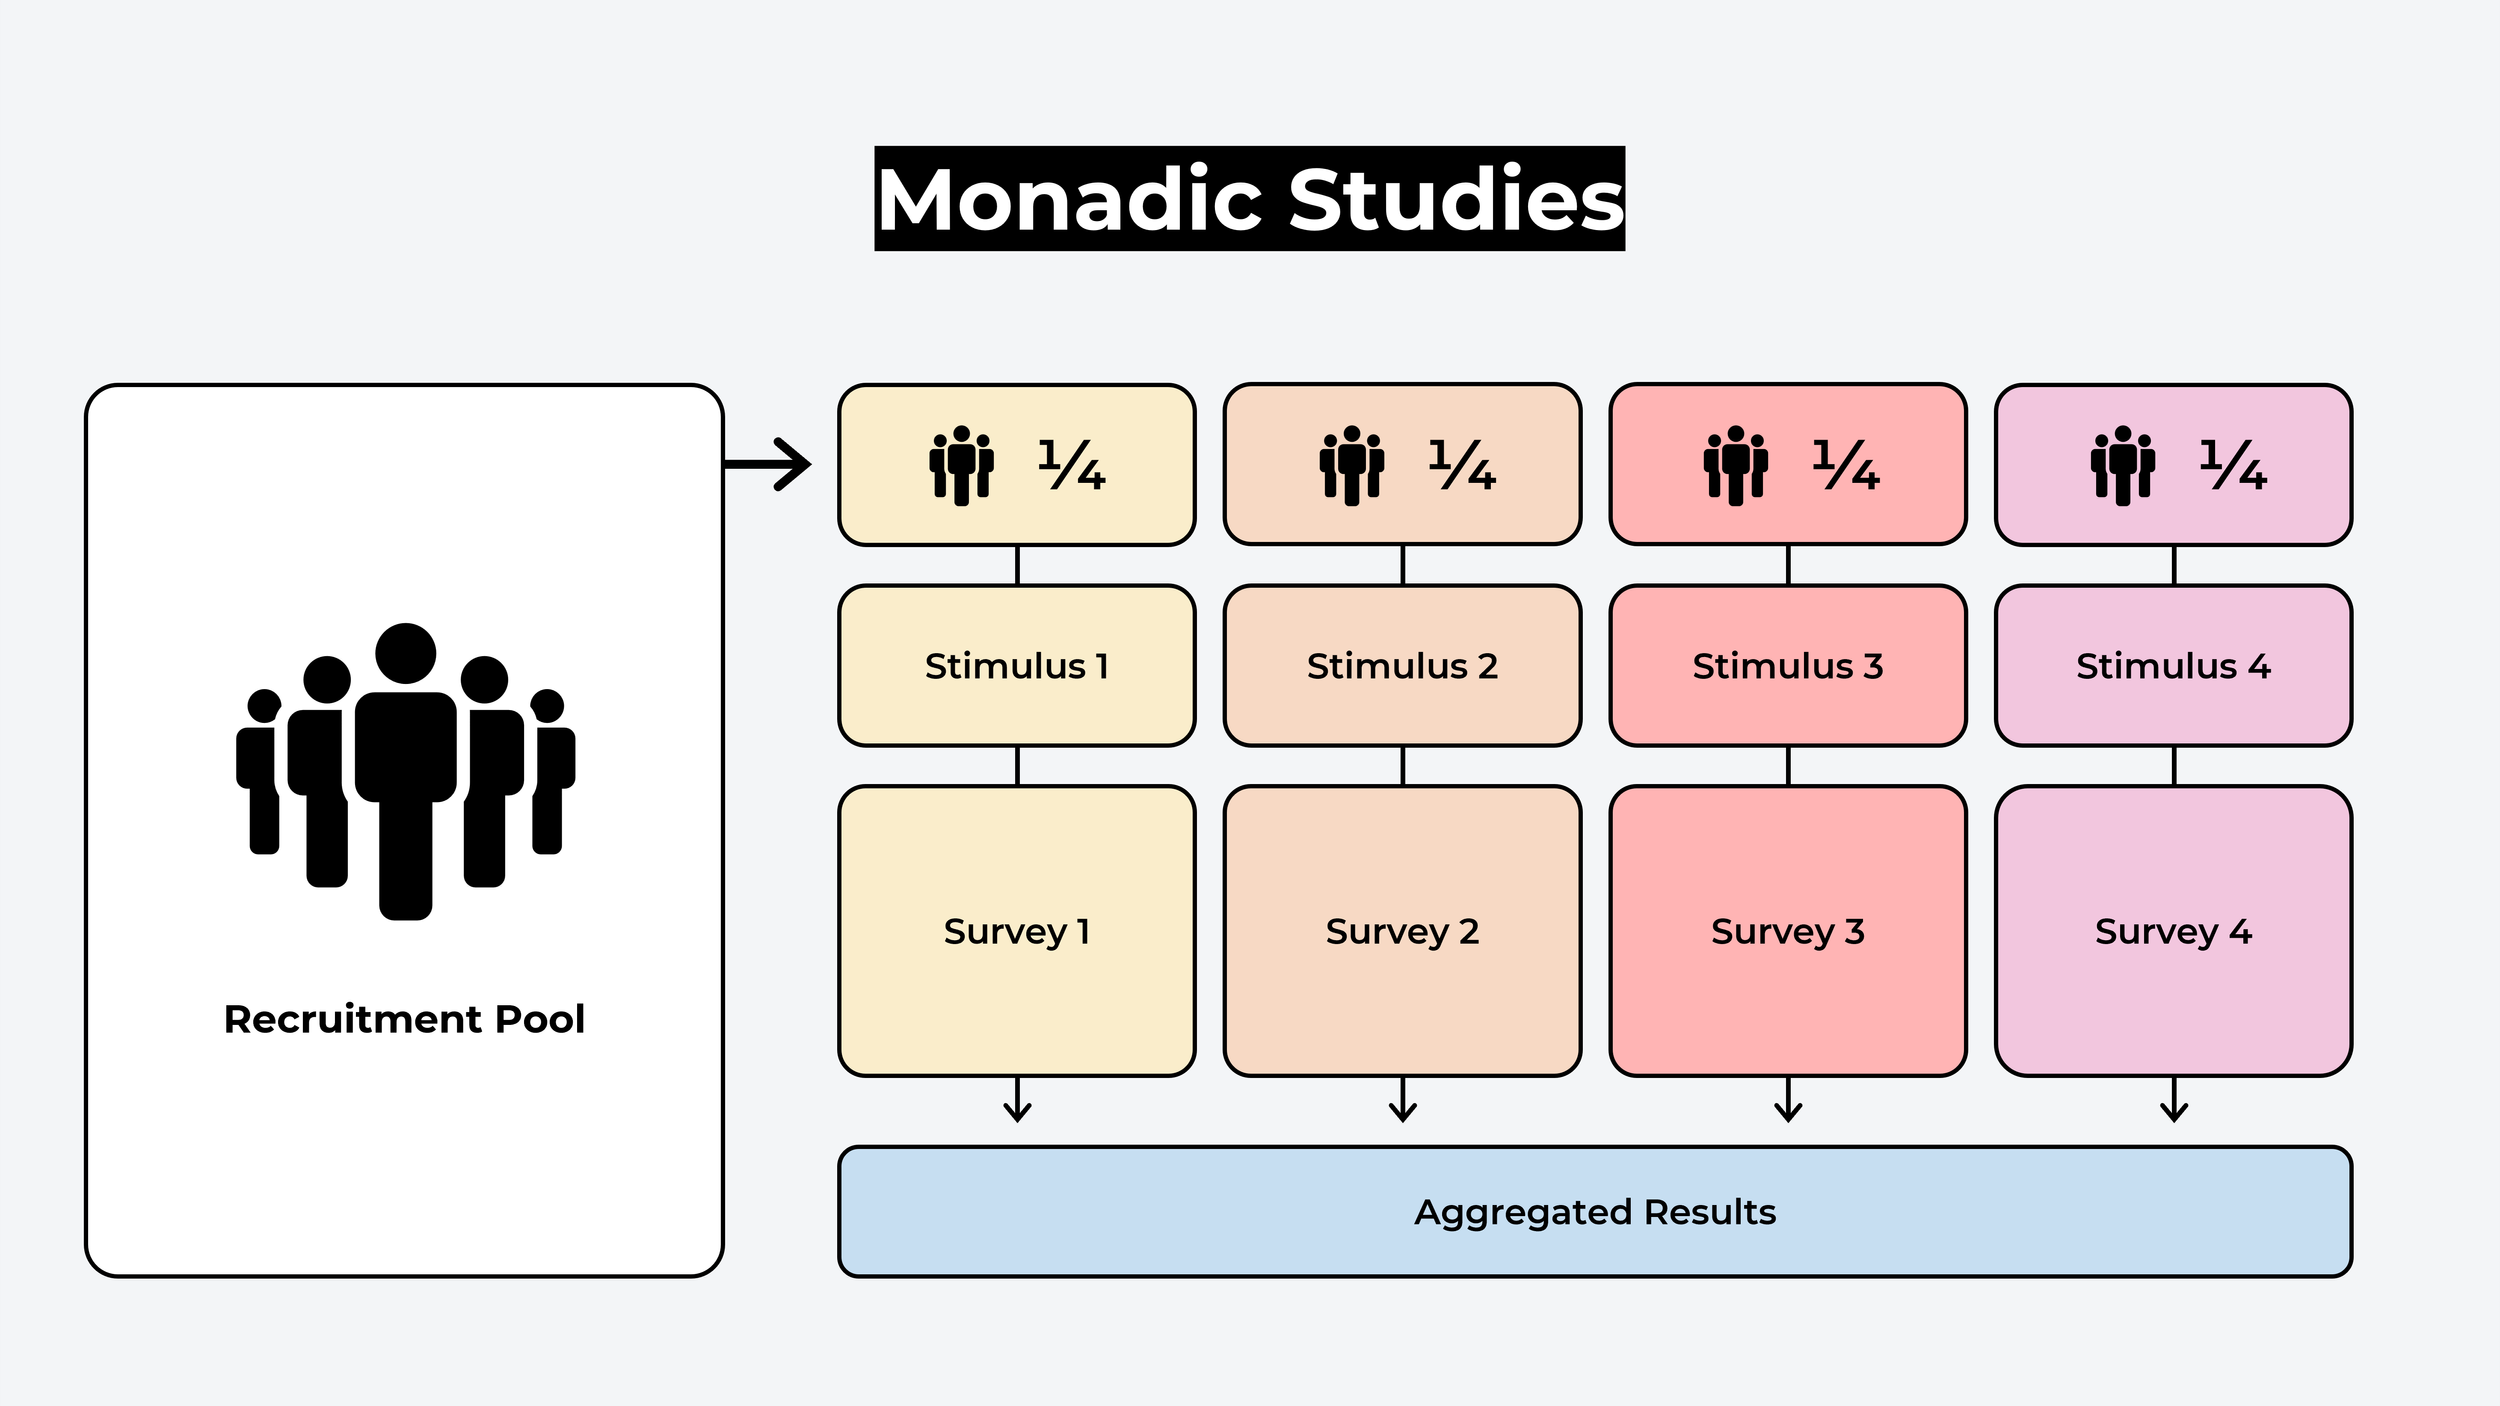
Unlike preference testing, monadic studies can't compare the main options against each other directly, so they generally rely on non-comparative question types such as:
Likert scales → e.g. "rate this mockup on a 5-point scale from disinterested to interested."
Open-ended questions → e.g. "what do you like most about the design of this product?"
Semantic differential scales → e.g. "rate this advert on a 5-point scale from budget to luxury."
Brand perception → e.g. "how would you describe this brand's personality?"
Price sensitivity → e.g. "at what price point would you consider this product too expensive?"
Recommendation → e.g. "how likely are you to recommend [product] to a friend or colleague?"
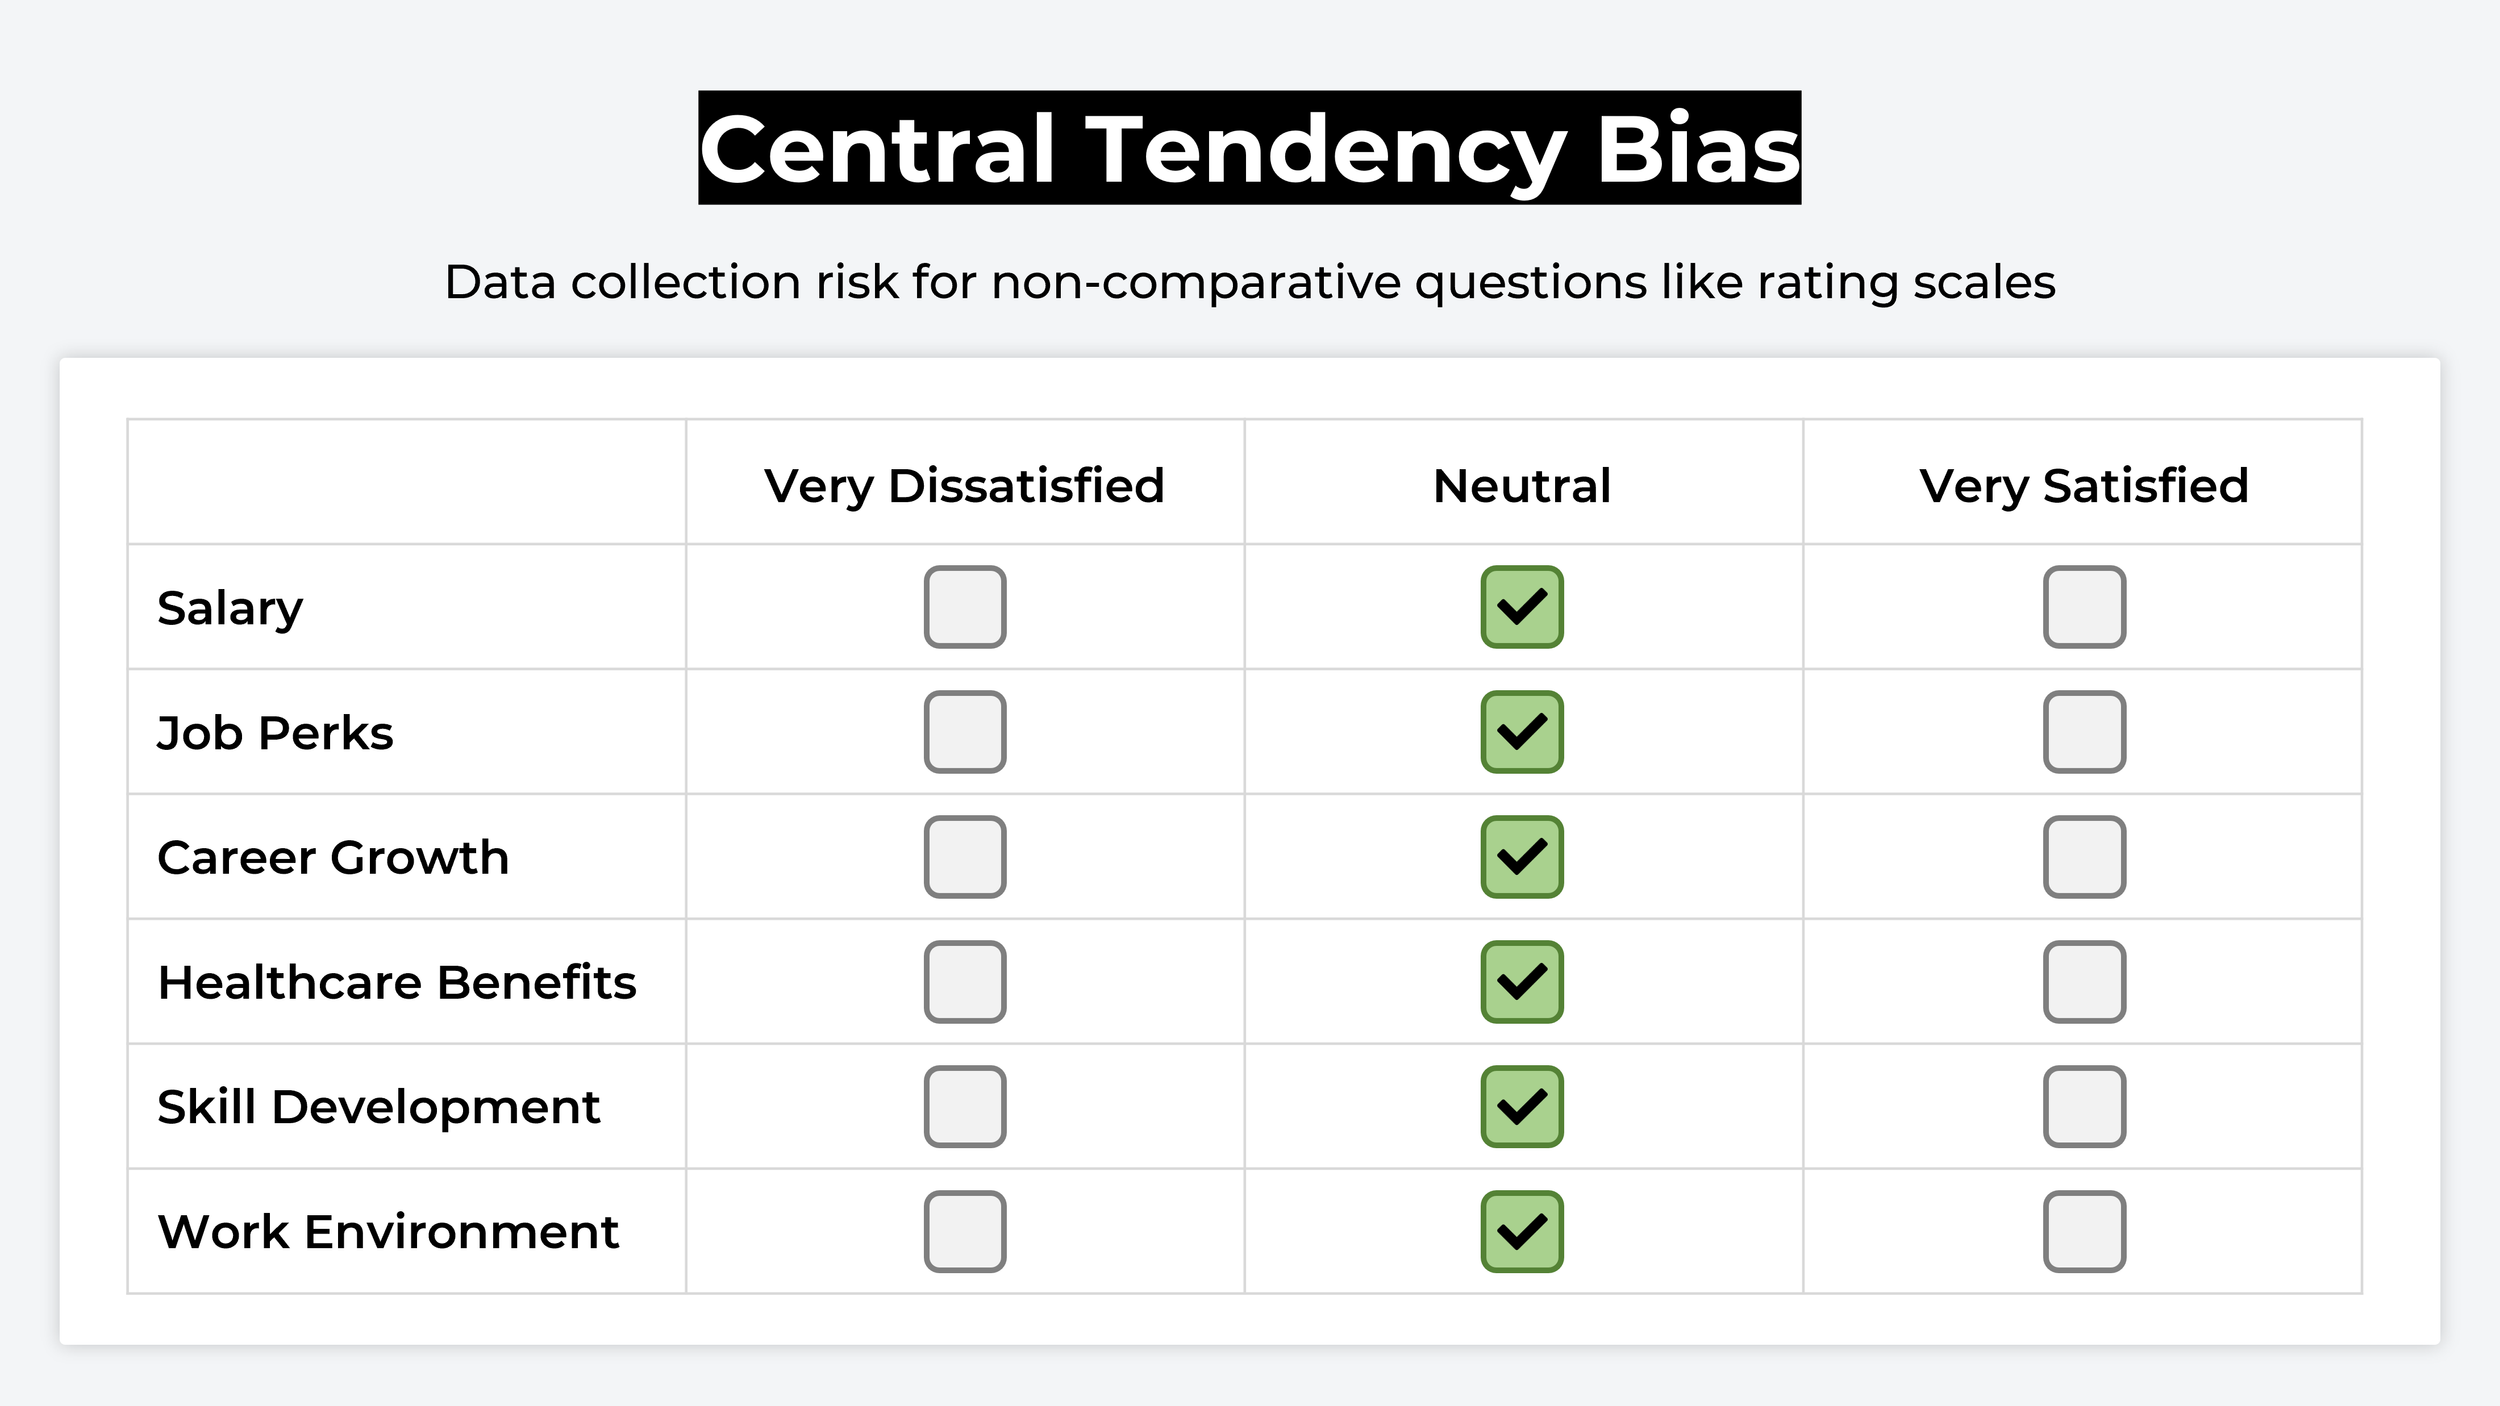
The catch with non-comparative formats is central tendency bias: people tend to give everything the same score, like rating everything "neutral" or "3/5 stars".
You can get around it by putting comparison-based questions inside a monadic study. Say you want to understand how people perceive some concept designs: a ranked choice voting question can show a list of brand attributes ("luxurious", "budget", "basic") to rank against each concept image. That tells you which version reads most as your target attribute, like "luxurious".
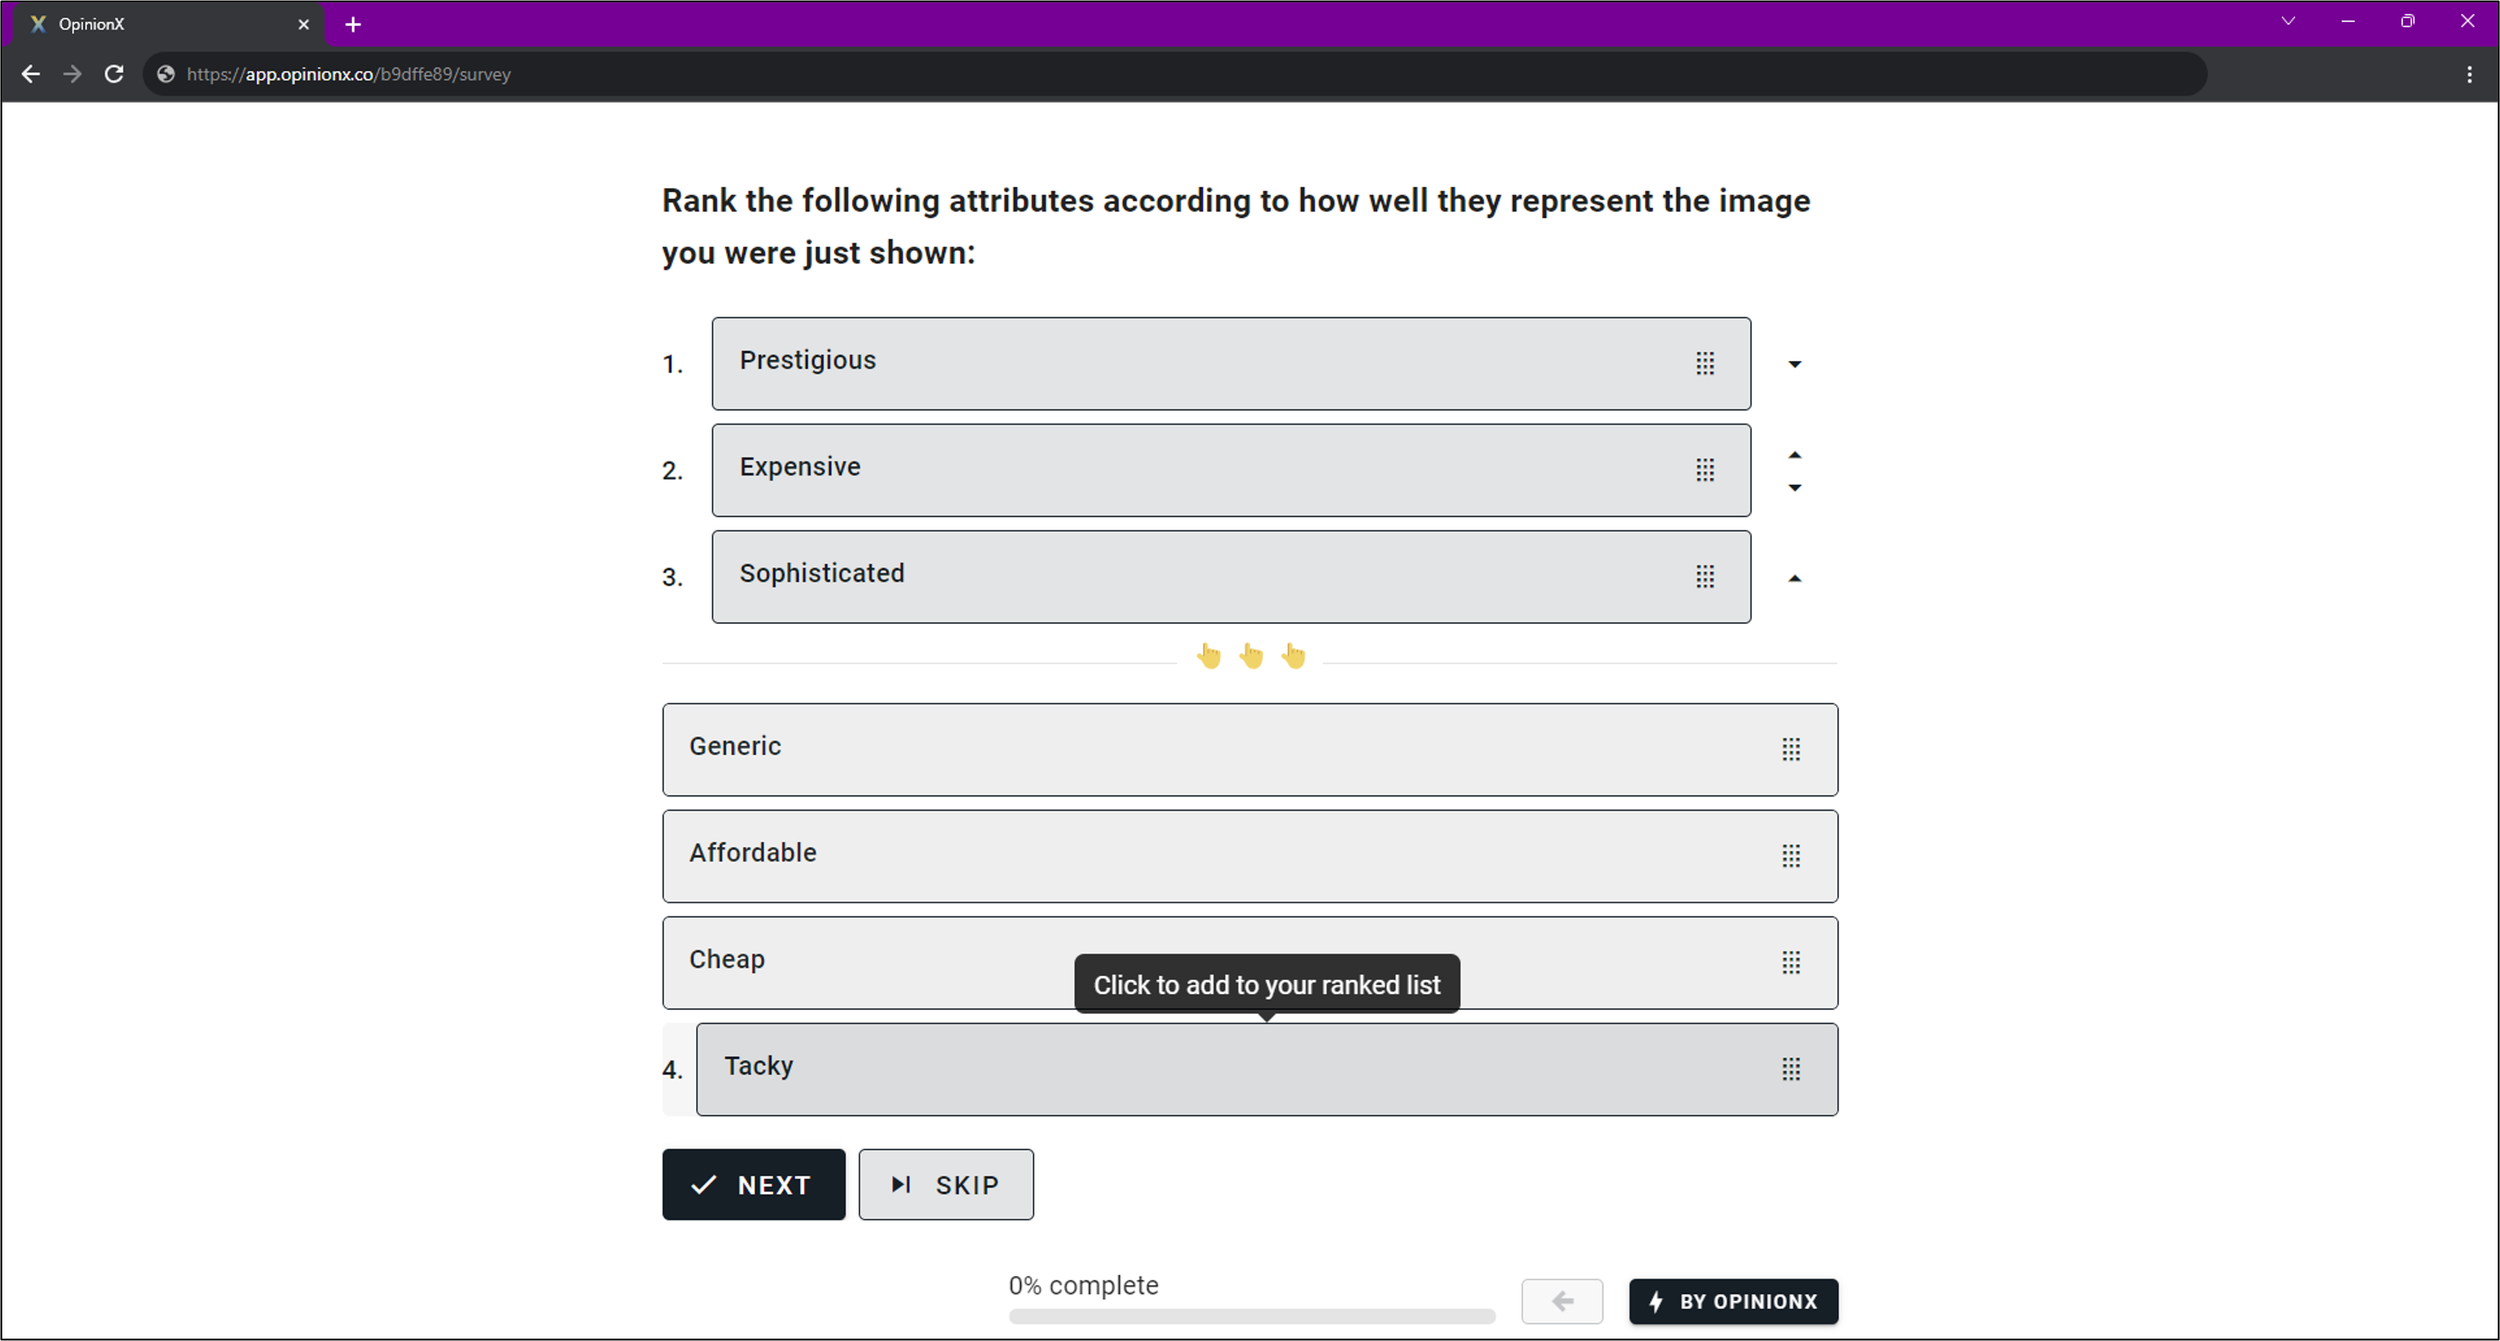
Screenshot from a Ranked Choice Voting survey on OpinionX
3. Segmentation Analysis
Whichever approach you run, a single comparative-preference survey or a series of monadic studies, plan ahead for segmentation analysis.
What is segmentation analysis? It's filtering your results down to the participants in a group you care about. You might view only female participants, or compare male vs female.
Segmentation matters because a representative sample gives you vague, average results. The option most "people" pick often isn't the one your best-fit customers go for, and segmenting can flip the ranking: a weak option becomes the winner once you look at the right group.
How do you segment an A/B testing survey? You need participant profile data, information about who each person is. The simplest way is to ask multiple-choice questions that let people self-identify their segment. Better still, if you already hold this data, import it and enrich your results with demographic, firmographic, and financial fields.
Some survey tools have built-in segmentation features. OpinionX, for example, does everything from one-click filtering to visualisations of every possible segment in your participant data.
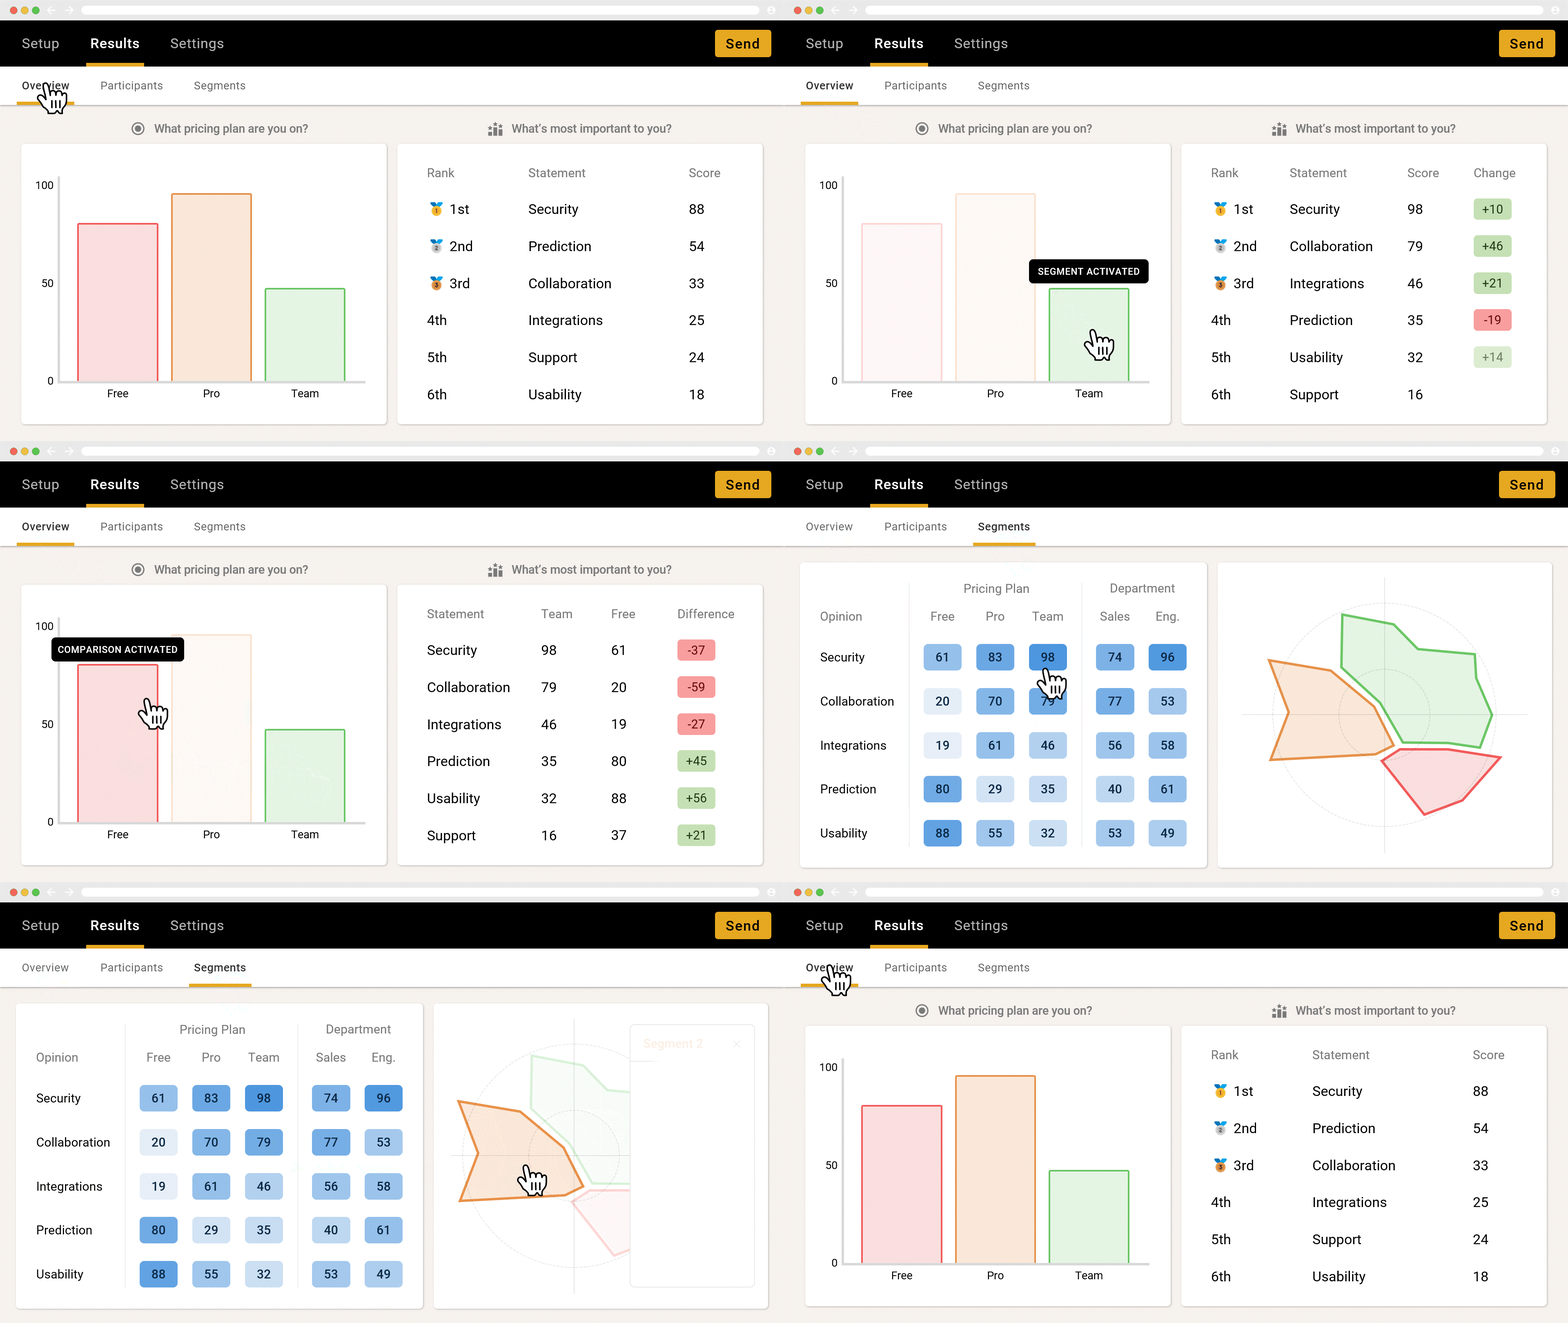
Illustrated example of segmentation analysis on OpinionX
Or you can segment by hand: download an aggregated, participant-oriented spreadsheet from your survey provider (example of how that looks on OpinionX), then filter it in Excel or Google Sheets to work out each segment's results.
Conclusion
A/B testing is popular because it gives you concrete data about how people behave and how that feeds business outcomes. But the sample sizes usually limit website A/B testing to big companies, and it doesn't have to be that way! Comparative preference methods like pairwise comparison, or monadic studies, let you apply the same principles far more flexibly, to find your best-performing image, feature idea, ad copy, sales message, or problem statement.
OpinionXis a free research tool for building comparative ranking surveys, used by thousands of product teams. It comes with a range of question formats and one-click segmentation, so you can get advanced insight without being a data scientist or trained researcher.
Create your own free A/B test today at app.opinionx.co
Frequently asked questions
Can you run an A/B test with a survey? Yes. Instead of splitting live traffic, you show people the competing options in a survey and measure which wins. The two approaches are comparative preference testing (forced head-to-head choices) and monadic studies (each option shown and scored on its own).
How many people do you need for a survey A/B test? Far fewer than a website test. A website A/B test can need around 200,000 users; a pairwise comparison of 20 options needs a minimum of about 29 participants, because each person votes on many pairs.
What's the difference between comparative preference testing and monadic studies? Comparative preference testing shows options together and forces a choice, so it ranks them directly. Monadic studies show one option at a time and score each in isolation, then compare the aggregated results afterwards.
What is central tendency bias in A/B testing surveys? It's the tendency for participants to rate everything the same, usually the neutral middle, on rating-scale questions. It mostly affects monadic studies, and you reduce it by using forced-comparison questions instead.
Why does segmentation matter in an A/B test survey? Because the option most people prefer on average is often not the one your best-fit customers prefer. Filtering results by segment can flip a low-performing option into the winner for the group you actually care about.