
How to Measure Company Culture using the OCAI Assessment
The Organizational Culture Assessment Instrument (OCAI) is a popular research method for quantitatively mapping a company’s culture. It offers a simple yet empirically-validated way to analyze both an organization’s present and preferred culture, helping leadership teams create data-driven strategies for transforming how their company works.
This blog post covers everything you need to know about OCAI — from what it is and where it came from, to how to run your own OCAI questionnaire and analyze the results, plus some advice from HR leaders who have run their own culture assessment projects in the past.

What is the OCAI?
The OCAI is a survey template that measures a company’s culture and how it compares to the four archetypes of organizations. The survey has six main questions where employees are asked to allocate 100 points between 4 statements which each represent one of the four culture archetypes. By calculating the average share of points that each archetype receives, you can visually map how employees perceive the overall organization’s culture.
The four archetypes that the OCAI is based on come from The Competing Values Framework, which is one of the most popular theories in academia for how organizations act. The OCAI turns the Competing Values Framework from theory into a practical way to measure how strongly an organization is represented within each of the four culture types.
In this blog post, I cover both of these topics in detail — first, what the Competing Values Framework is and how it models the four types of organizational culture, and second, the structure of the OCAI survey and how you can use it to assess your own organization’s culture.
1. The Competing Values Framework
There are two main sources of tension within every organization — the competing values of internal vs external and flexible vs stable.
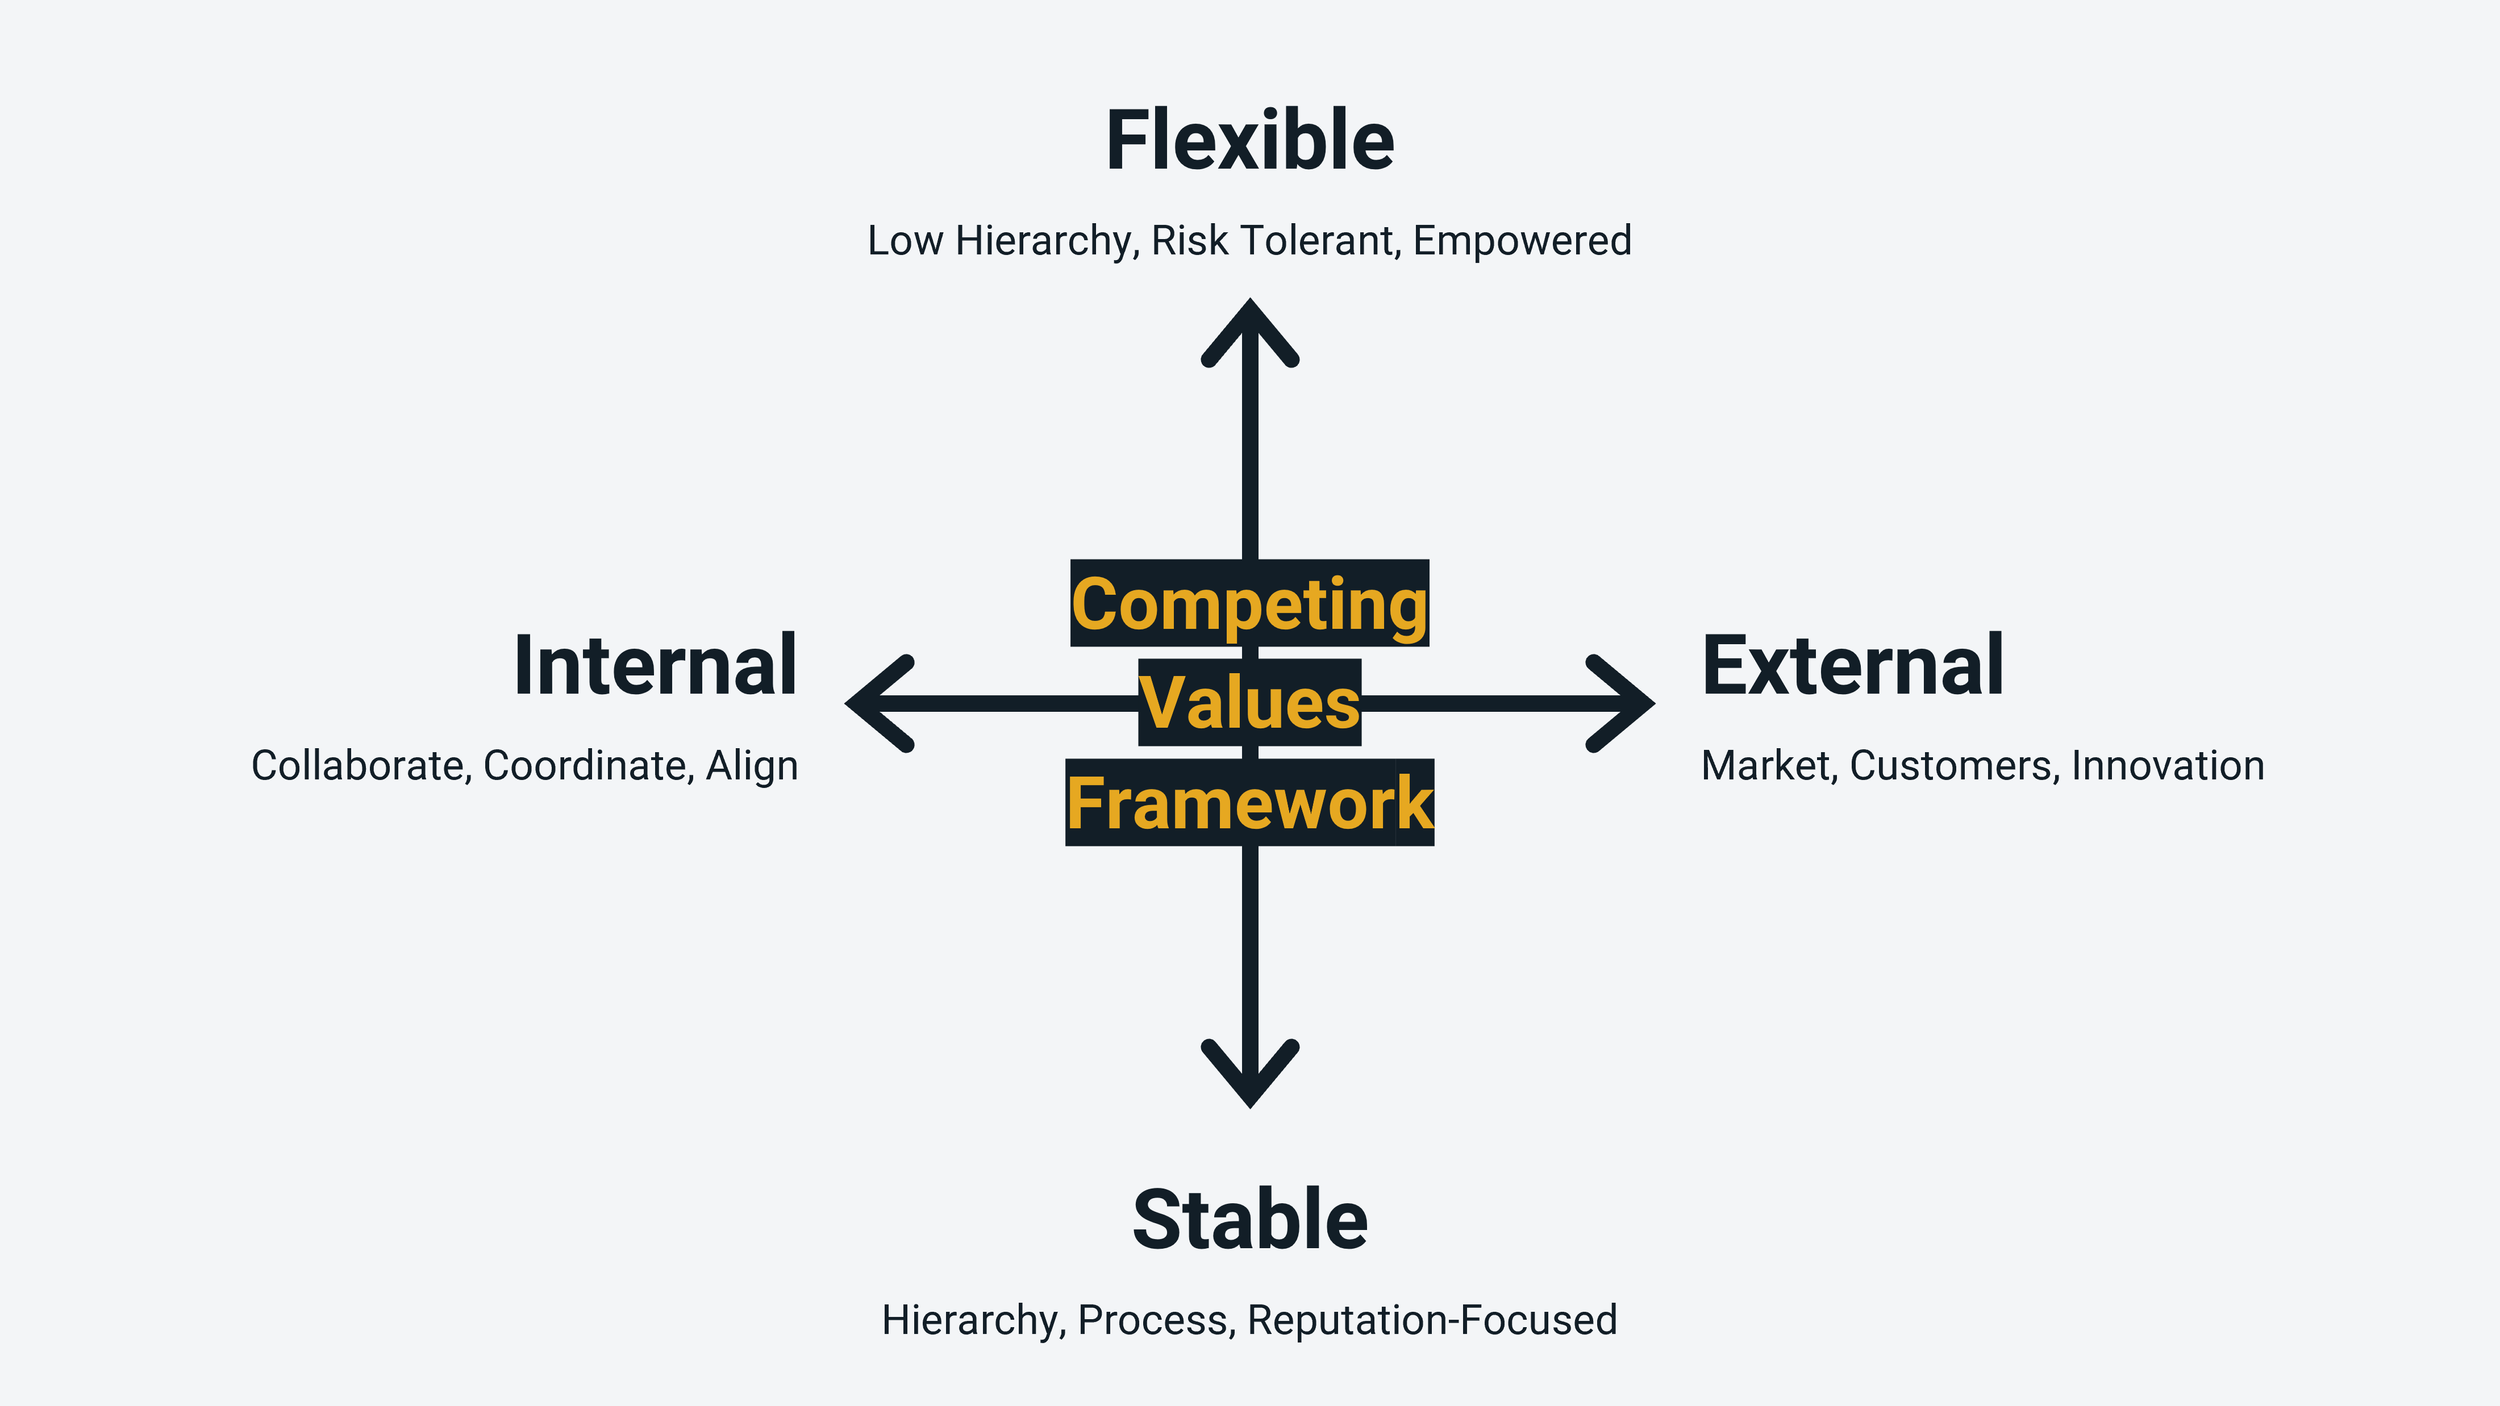
Internal vs External: an internally-dominant culture focuses on collaborating, coordinating, and developing employees, whereas an externally-dominant culture focuses on the broader market of technological change, customer needs, and competitor updates. Stable markets tend to encourage internally-focused cultures and volatile markets push companies towards external orientation.
Stable vs Flexible: a culture that prioritizes stability will build clear structures of hierarchy, processes for planning and budgeting, and a reputation for reliability and standards, whereas a culture that prioritizes flexibility will prioritize adaptability and a bias for action, risk-taking and experimentation, and empowered teams with less hierarchy.
These two pairs are known as “Competing Values” (hence the name of the framework) and when they are mapped on a 2x2 matrix, we see four organizational cultures emerge in the resulting quadrants:
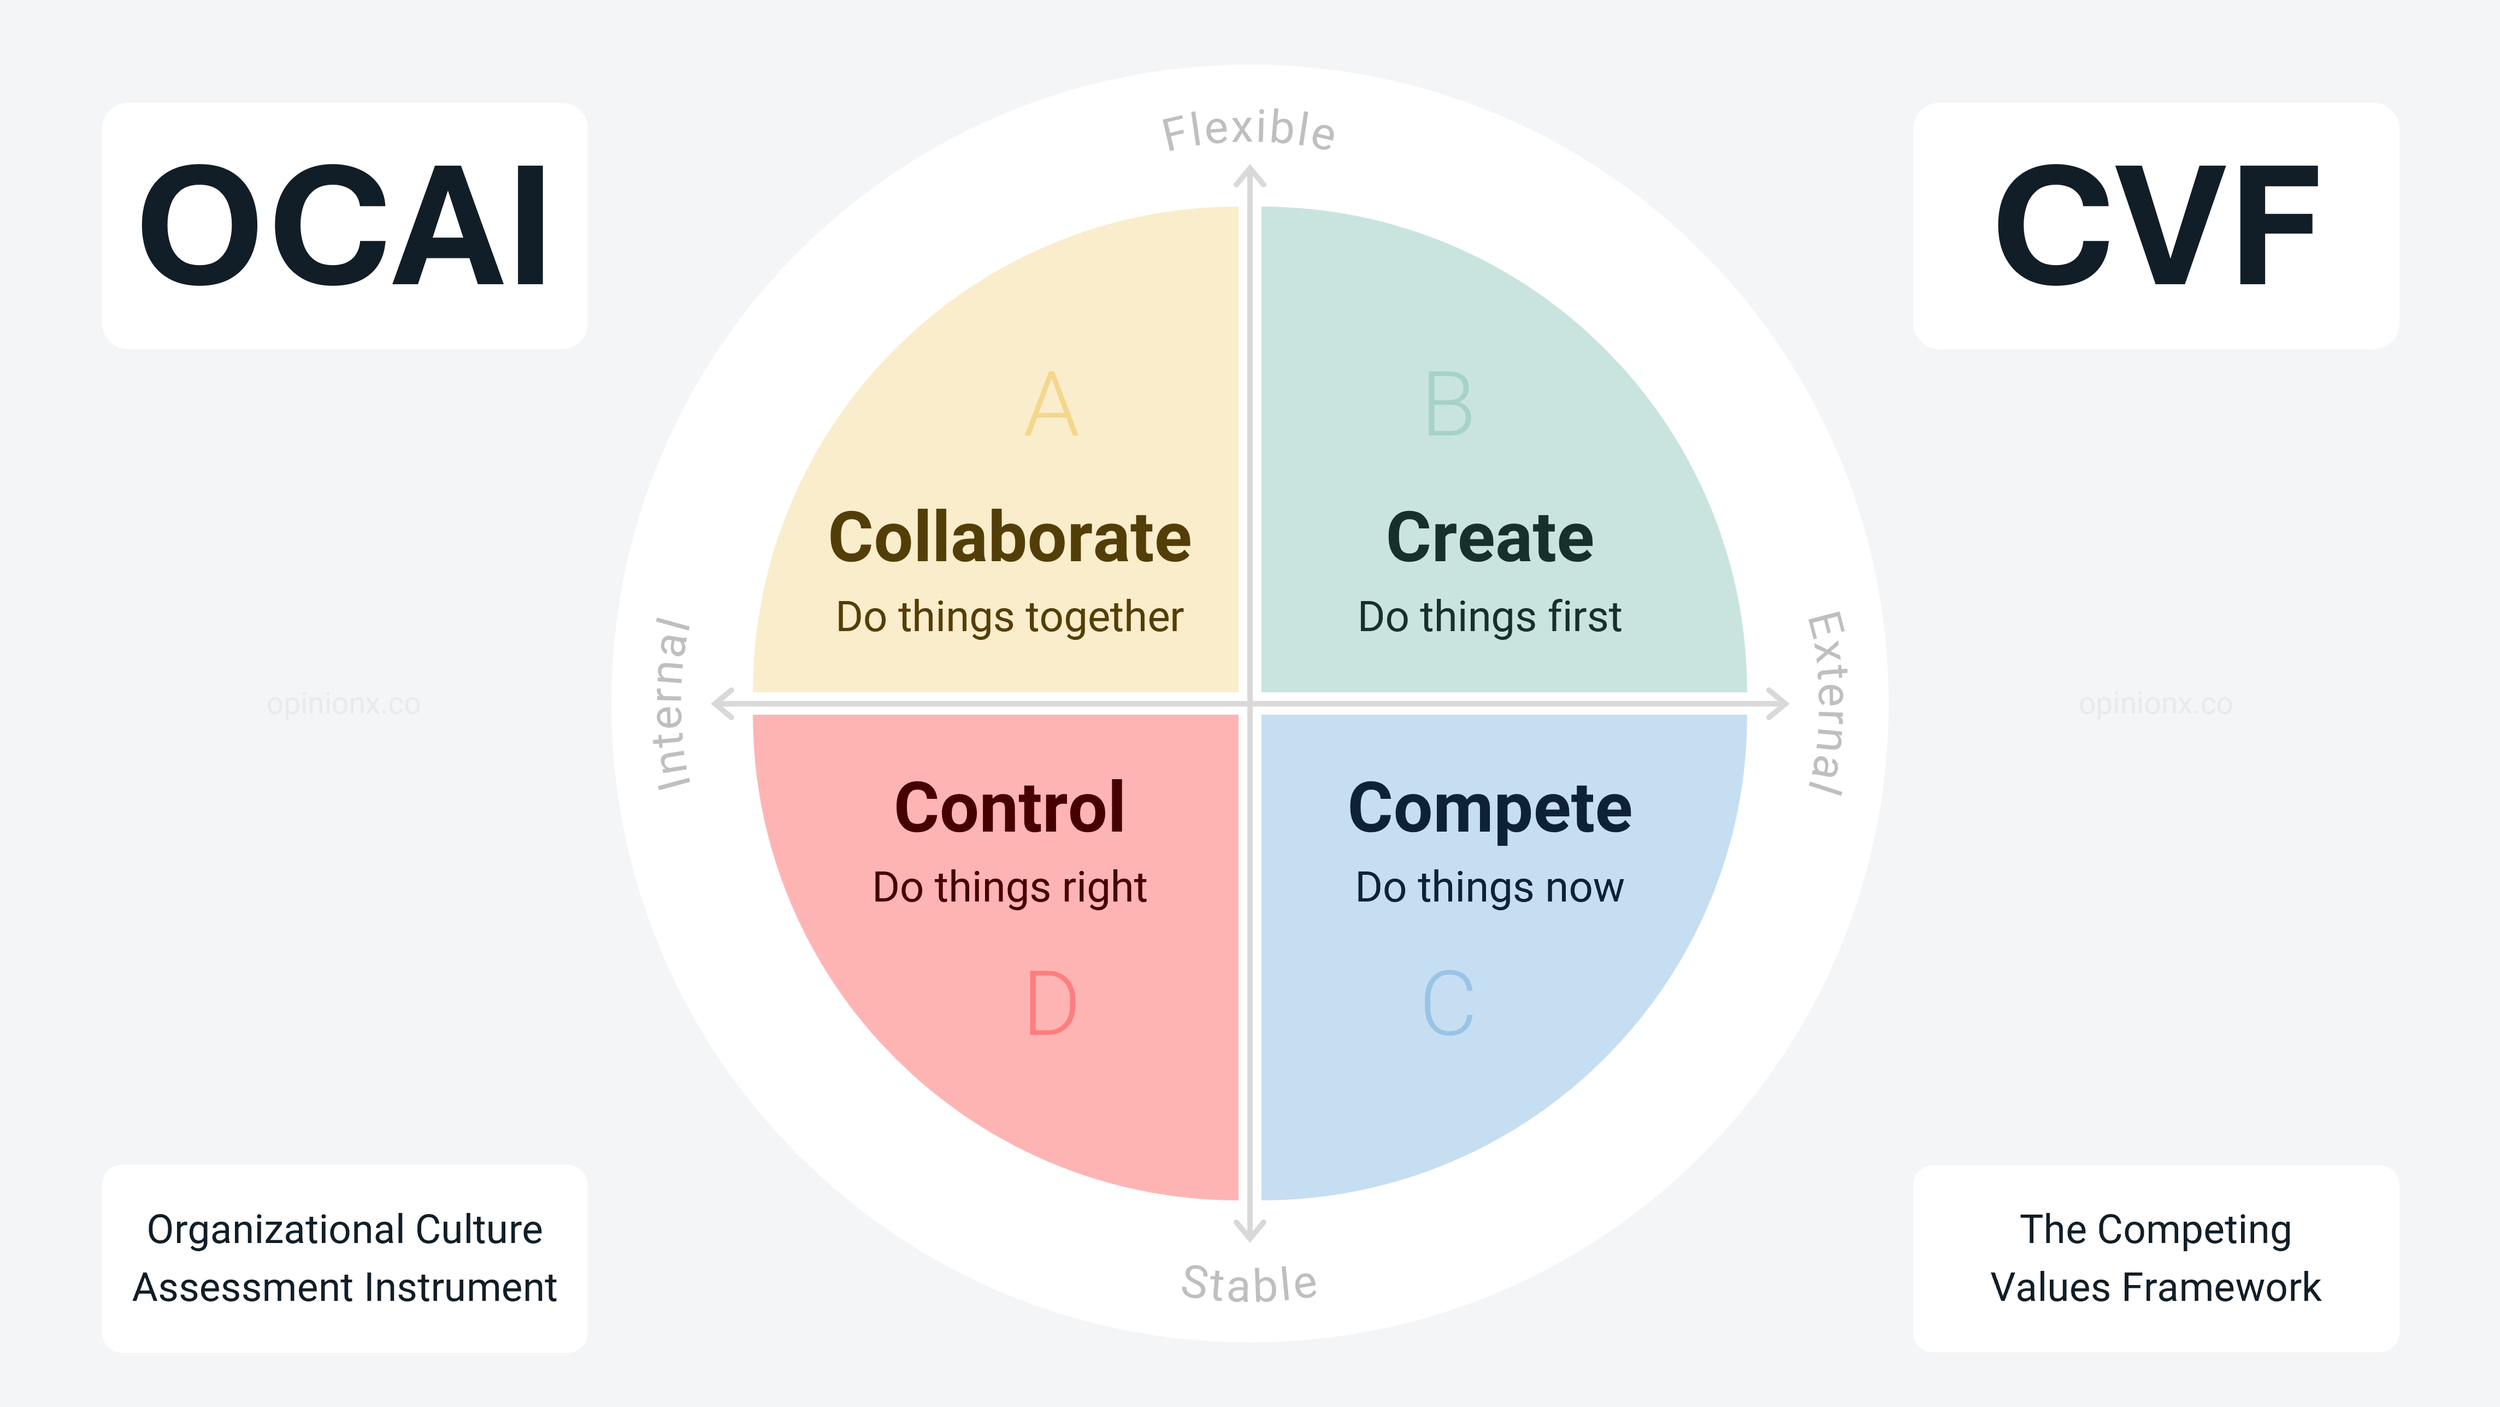
Flexible + Internal = Collaborate
Collaborative cultures are people-focused organizations that create a family-like atmosphere that promotes teamwork, participation, and decision-making by consensus. Associated with sectors like healthcare, education, and non-profits.
Flexible + External = Create
Creative cultures are risk-taking and innovative companies that break established rules and paint a vision of a better future for their teams to pursue. Associated with organizations like tech startups.
Stable + External = Compete
The Competitive culture moves fast, thrives through process, and is focused on achieving ambitious targets. Results are the main currency in these organizations and winning is the ultimate goal. Associated with professional services, consumer goods, and larger tech companies.
Stable + Internal = Control
Controlling cultures are formal, structured, and hierarchical. Formal rules are the norm, reliability is essential, and errors are not taken lightly. These cultures are often seen as more conservative, traditional, and cautious. Associated with industries like military and banking.
Implementing the OCAI
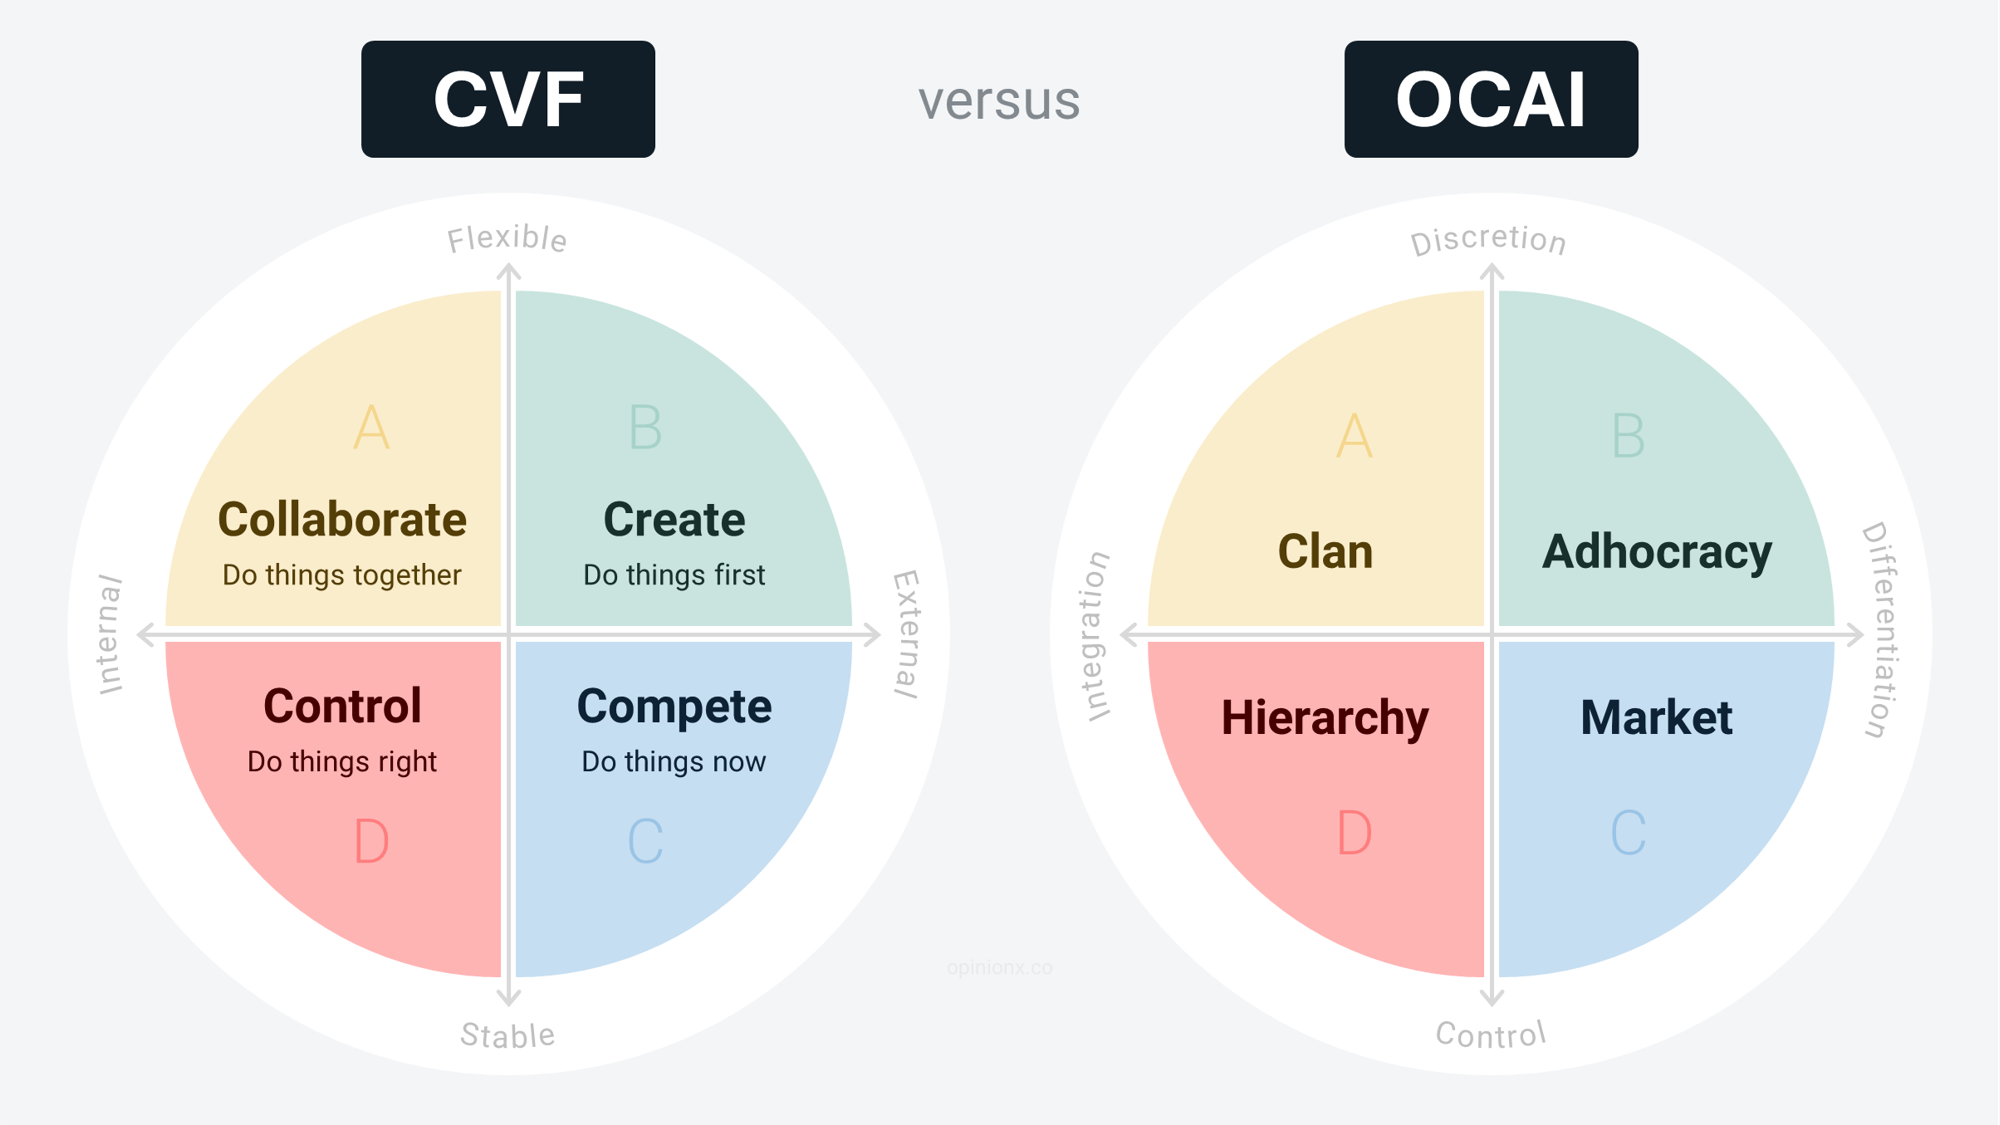
The Competitive Values Framework was just a theoretical concept when first published by Robert E. Quinn and John Rohrbaugh in 1981. It wasn’t until 10 years later that Robert E. Quinn teamed up with Kim Cameron to turn the Competing Values Framework into a usable research method.
Quinn and Cameron changed some of the previously used terms so that the Organizational Culture Assessment Instrument could be copyrighted, but the two versions share basically the exact same underlying model, so I’ll continue using the CVF terms we’ve already covered for the remainder of this article to keep things simple. Here’s side-by-side comparison:
The OCAI examines how an organization works by measuring employee’s perception of the company’s culture across six key themes. Within each of these six themes, employees are given 100 points to distribute between four statements that each represent one of the four culture archetypes. Here’s an example of what that points-based voting looks like on OpinionX:
Below are the six themes and each of their four statements. For each theme, statement A represents Collaborate, B is Create, C is Compete, and D is Control.
OCAI Survey Template
Using the Points Rank survey format on OpinionX → you can one-click copy this template using OpinionX’s sample OCAI survey (sign-in required).
1. Dominant Characteristics
A. The organization is a very personal place. It is like an extended family. People seem to share a lot of themselves.
B. The organization is a very dynamic entrepreneurial place. People are willing to stick their necks out and take risks.
C. The organization is very results oriented. A major concern is with getting the job done. People are very competitive and achievement oriented.
D. The organization is a very controlled and structured place. Formal procedures generally govern what people do.
2. Organizational Leadership
A. The leadership in the organization is generally considered to exemplify mentoring, facilitating, or nurturing.
B. The leadership in the organization is generally considered to exemplify entrepreneurship, innovating, or risk taking.
C. The leadership in the organization is generally considered to exemplify a no-nonsense, aggressive, results-oriented focus.
D. The leadership in the organization is generally considered to exemplify coordinating, organizing, or smooth-running efficiency.
3. Management of Employees
A. The management style in the organization is characterized by teamwork, consensus, and participation.
B. The management style in the organization is characterized by individual risk-taking, innovation, freedom, and uniqueness.
C. The management style in the organization is characterized by hard-driving competitiveness, high demands, and achievement.
D. The management style in the organization is characterized by security or employment, conformity, predictability, and stability in relationships.
4. Organization Glue
A. The glue that holds the organization together is loyalty and mutual trust. Commitment to this organization runs high.
B. The glue that holds the organization together is innovation and development. There is an emphasis on being on the cutting edge.
C. The glue that holds the organization together is the emphasis on achievement and goal accomplishment. Aggressiveness and winning are common themes.
D. The glue that holds the organization together is formal rules and policies. Maintaining a smooth-running organization is important.
5. Strategic Emphases
A. The organization emphasizes human development. High trust, openness, and participation persist.
B. The organization emphasizes acquiring new resources and creating new challenges. Trying new things and prospecting for opportunities are valued.
C. The organization emphasizes competitive actions and achievement. Hitting stretch targets and winning in the marketplace are dominant.
D. The organization emphasizes permanence and stability. Efficiency, control and smooth operations are important.
6. Criteria of Success
A. The organization defines success on the basis of the development of human resources, teamwork, employee commitment, and concern for people.
B. The organization defines success on the basis of having the most unique or newest products. It is a product leader and innovator.
C. The organization defines success on the basis of winning in the marketplace and outpacing the competition. Competitive market leadership is key.
D. The organization defines success on the basis of efficiency. Dependable delivery, smooth scheduling and low-cost production are critical.
In a full OCAI assessment, these six sections are completed twice — first, a full run-through focuses on the organization’s existing culture in the present day, and then a second run-through afterwards focuses on the preferred or ideal culture that employees would like to see the company develop in the future.
The best way to run an OCAI survey is using a Points-Based Ranking or Constant Sum format, which gives respondents a pool of points to “spend” on a list of options according to their personal preferences.
Why does the OCAI questionnaire not use a more common method like a 5-Star Rating or Likert Scale? Rating scale formats like these allow people to score everything the same amount, like giving all four statements five out of five stars. Points Rank introduces scarcity by giving each respondent a limited pool of points, which forces them to compare the options, consider the trade-offs, and spend their points on the options they feel strongest about.
OpinionX is an online survey tool that comes with a free Points Rank question type and offers unlimited surveys, unlimited participants, and unlimited questions. The premium plans on OpinionX allow for more advanced survey design like logic branching and analysis like segmentation filtering. Here’s an example of an OCAI survey that I created on OpinionX for you to test out:
Analyzing OCAI Questionnaire Results
When users complete your survey, you’ll see the average percentage of points that each statement received like this:
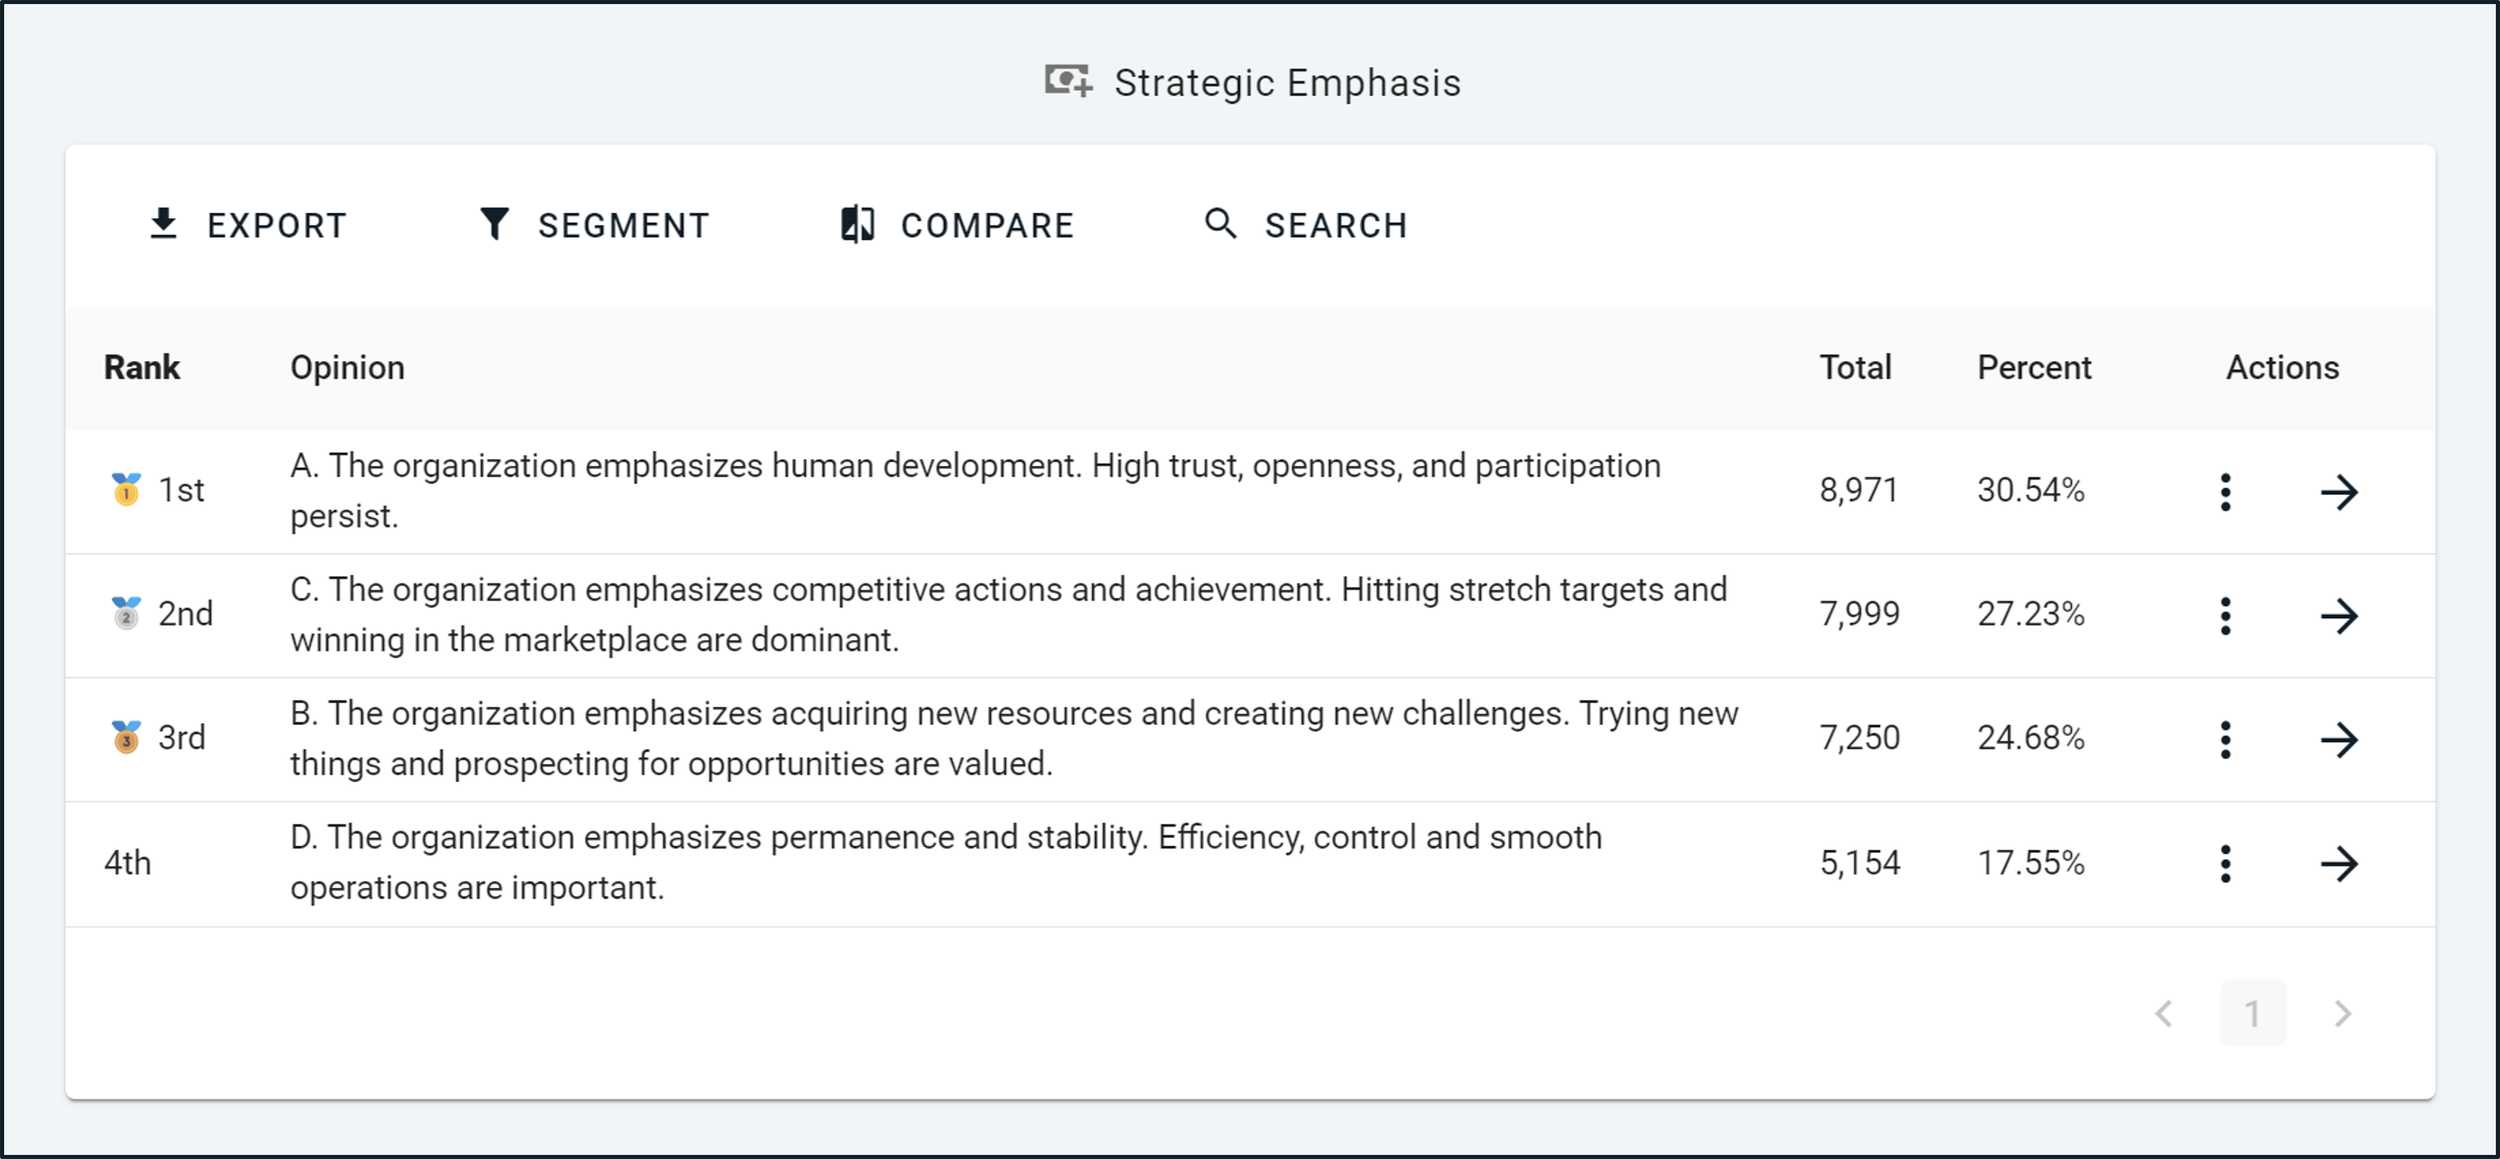
Take the percentages from each of the 6 sections and create an aggregated spreadsheet on your tool of choice (in my case that’s Google Sheets). You can see that keeping the “A, B, C, D” tags in the statements makes this process a lot faster when it comes to analysis, but you can remove these tags and set your Points Rank questions on OpinionX to randomize the order they appear for each section so that your data is more robust and unbiased.

Both Excel and Google Sheets require some fine-tuning to get the radar graph to appear in the typical OCAI style:
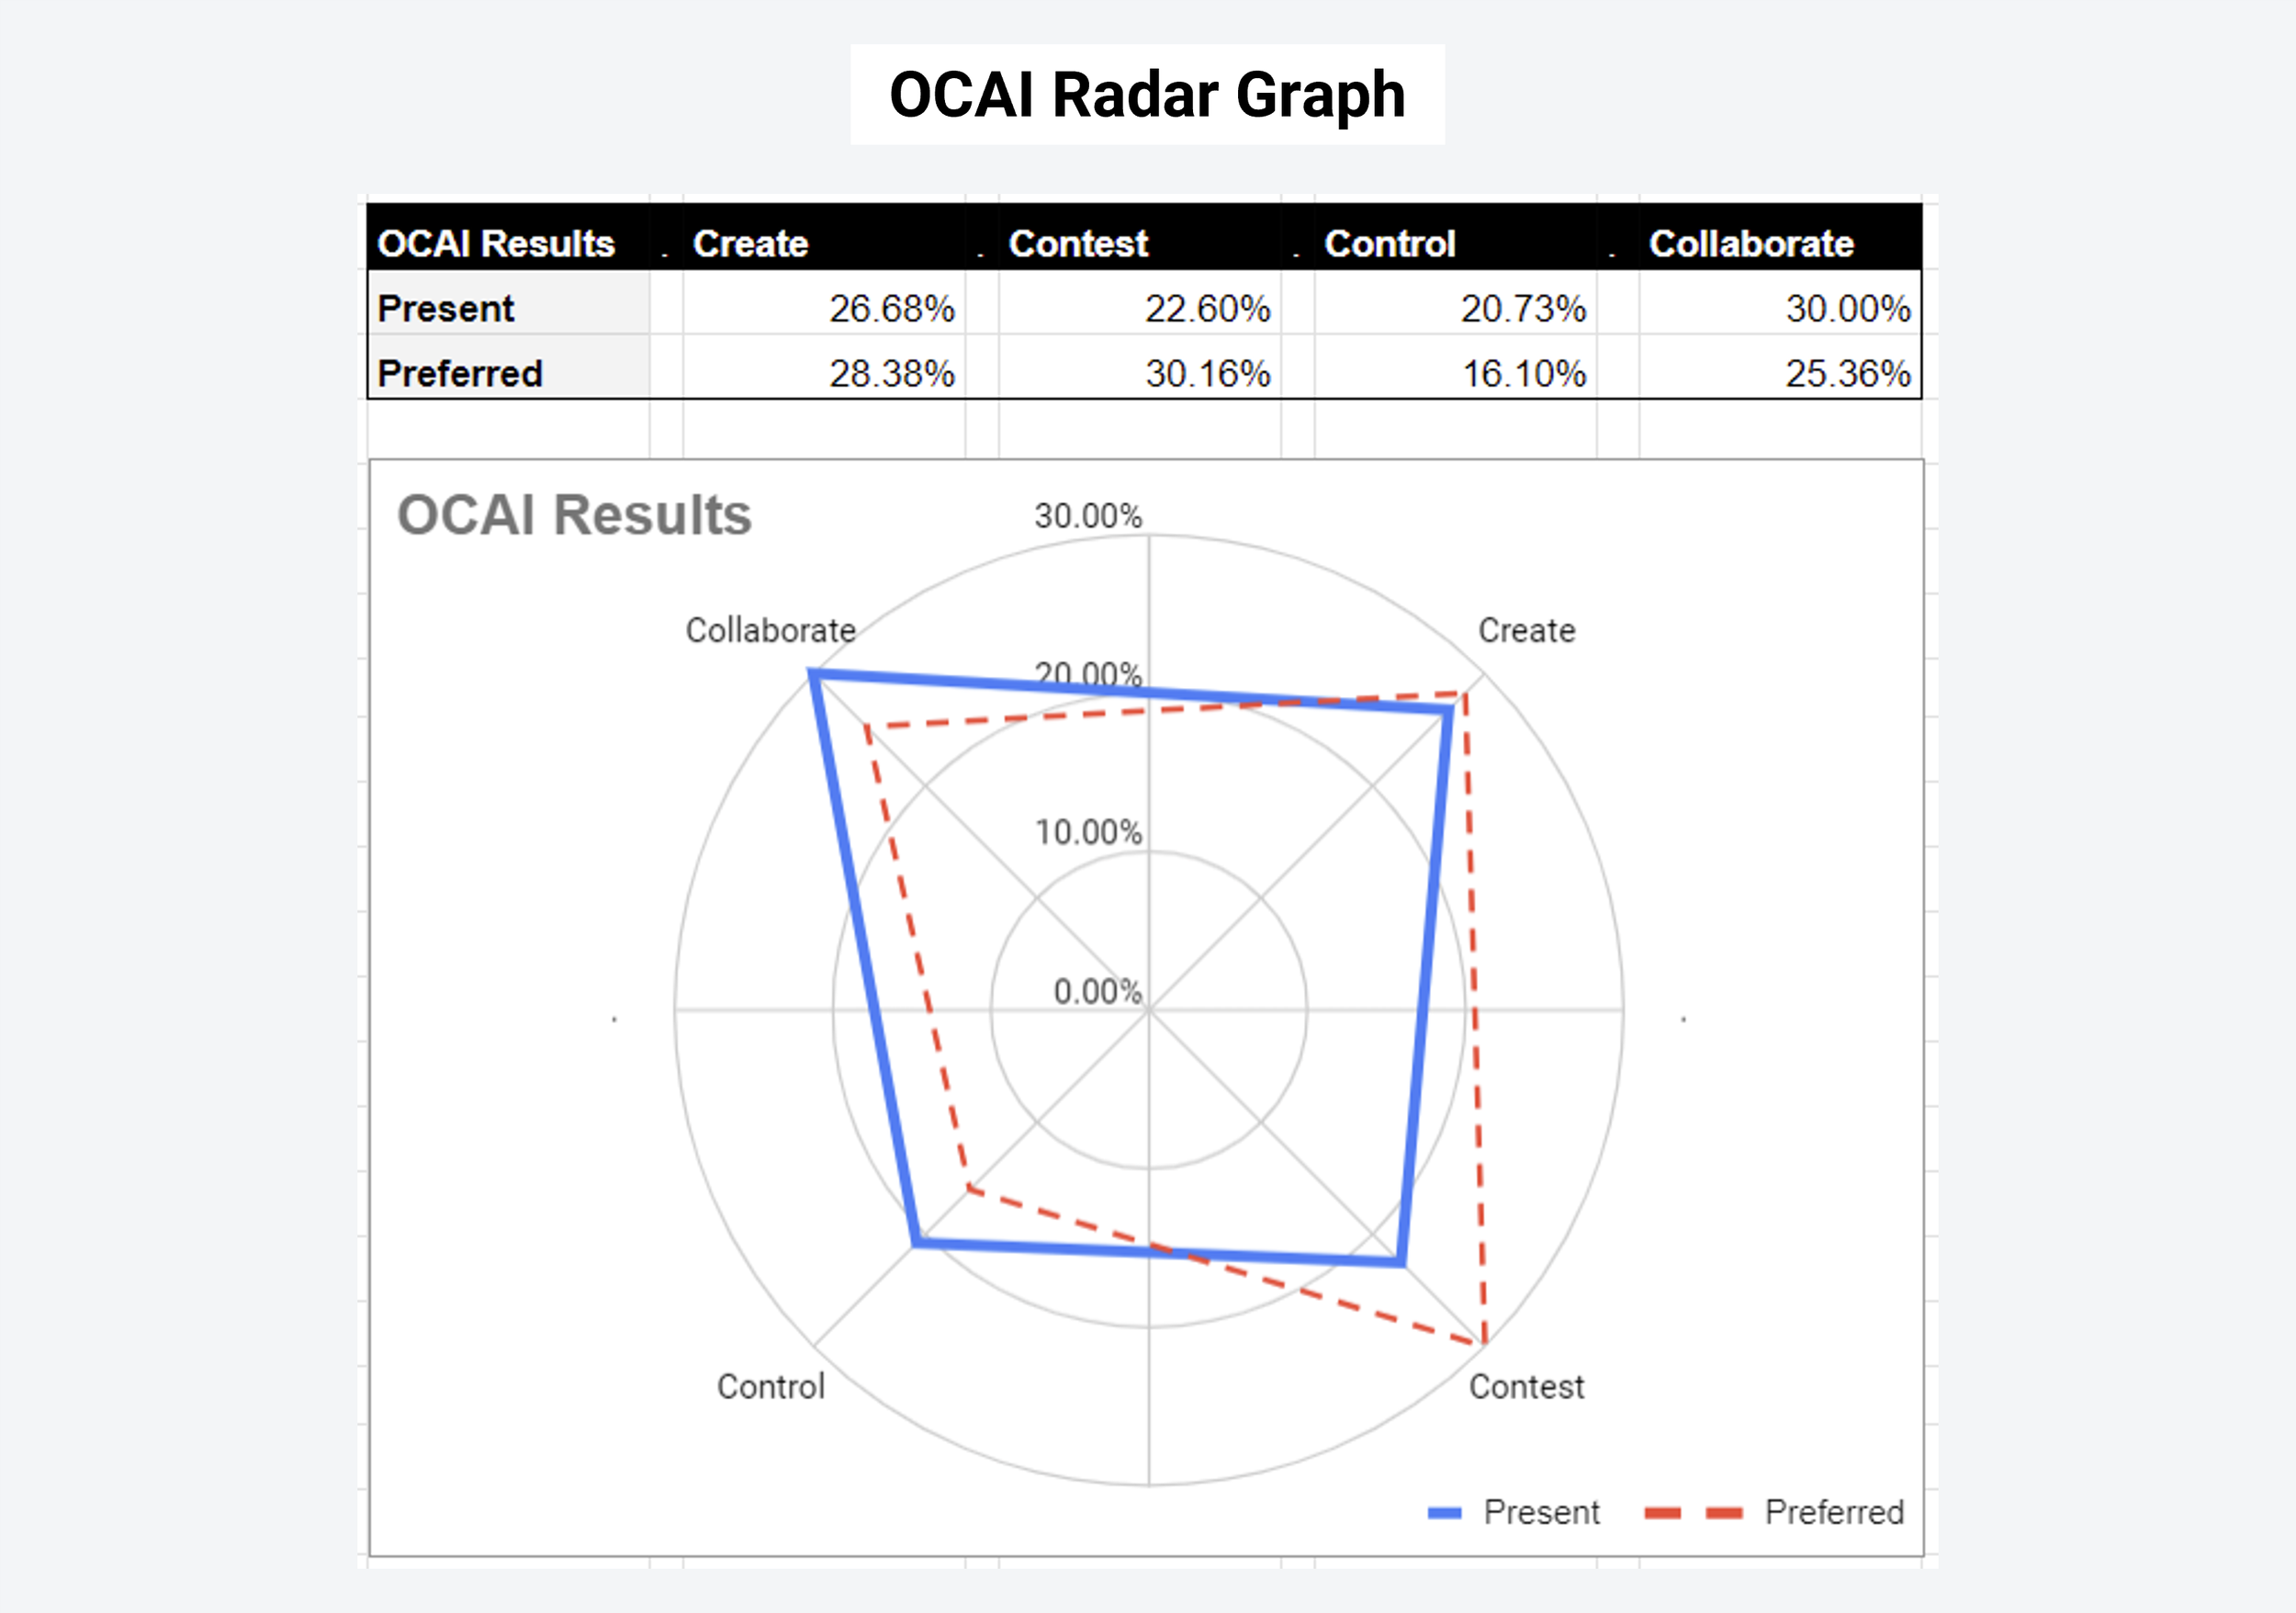
Using this premade spreadsheet template, you can copy and paste your Points Rank results from your OpinionX survey and it will automatically update the radar charts to match your survey’s results:
Formatting Your OCAI Radar Graph
Some tips for getting Google Sheets to show the radar graph in the OCAI format:
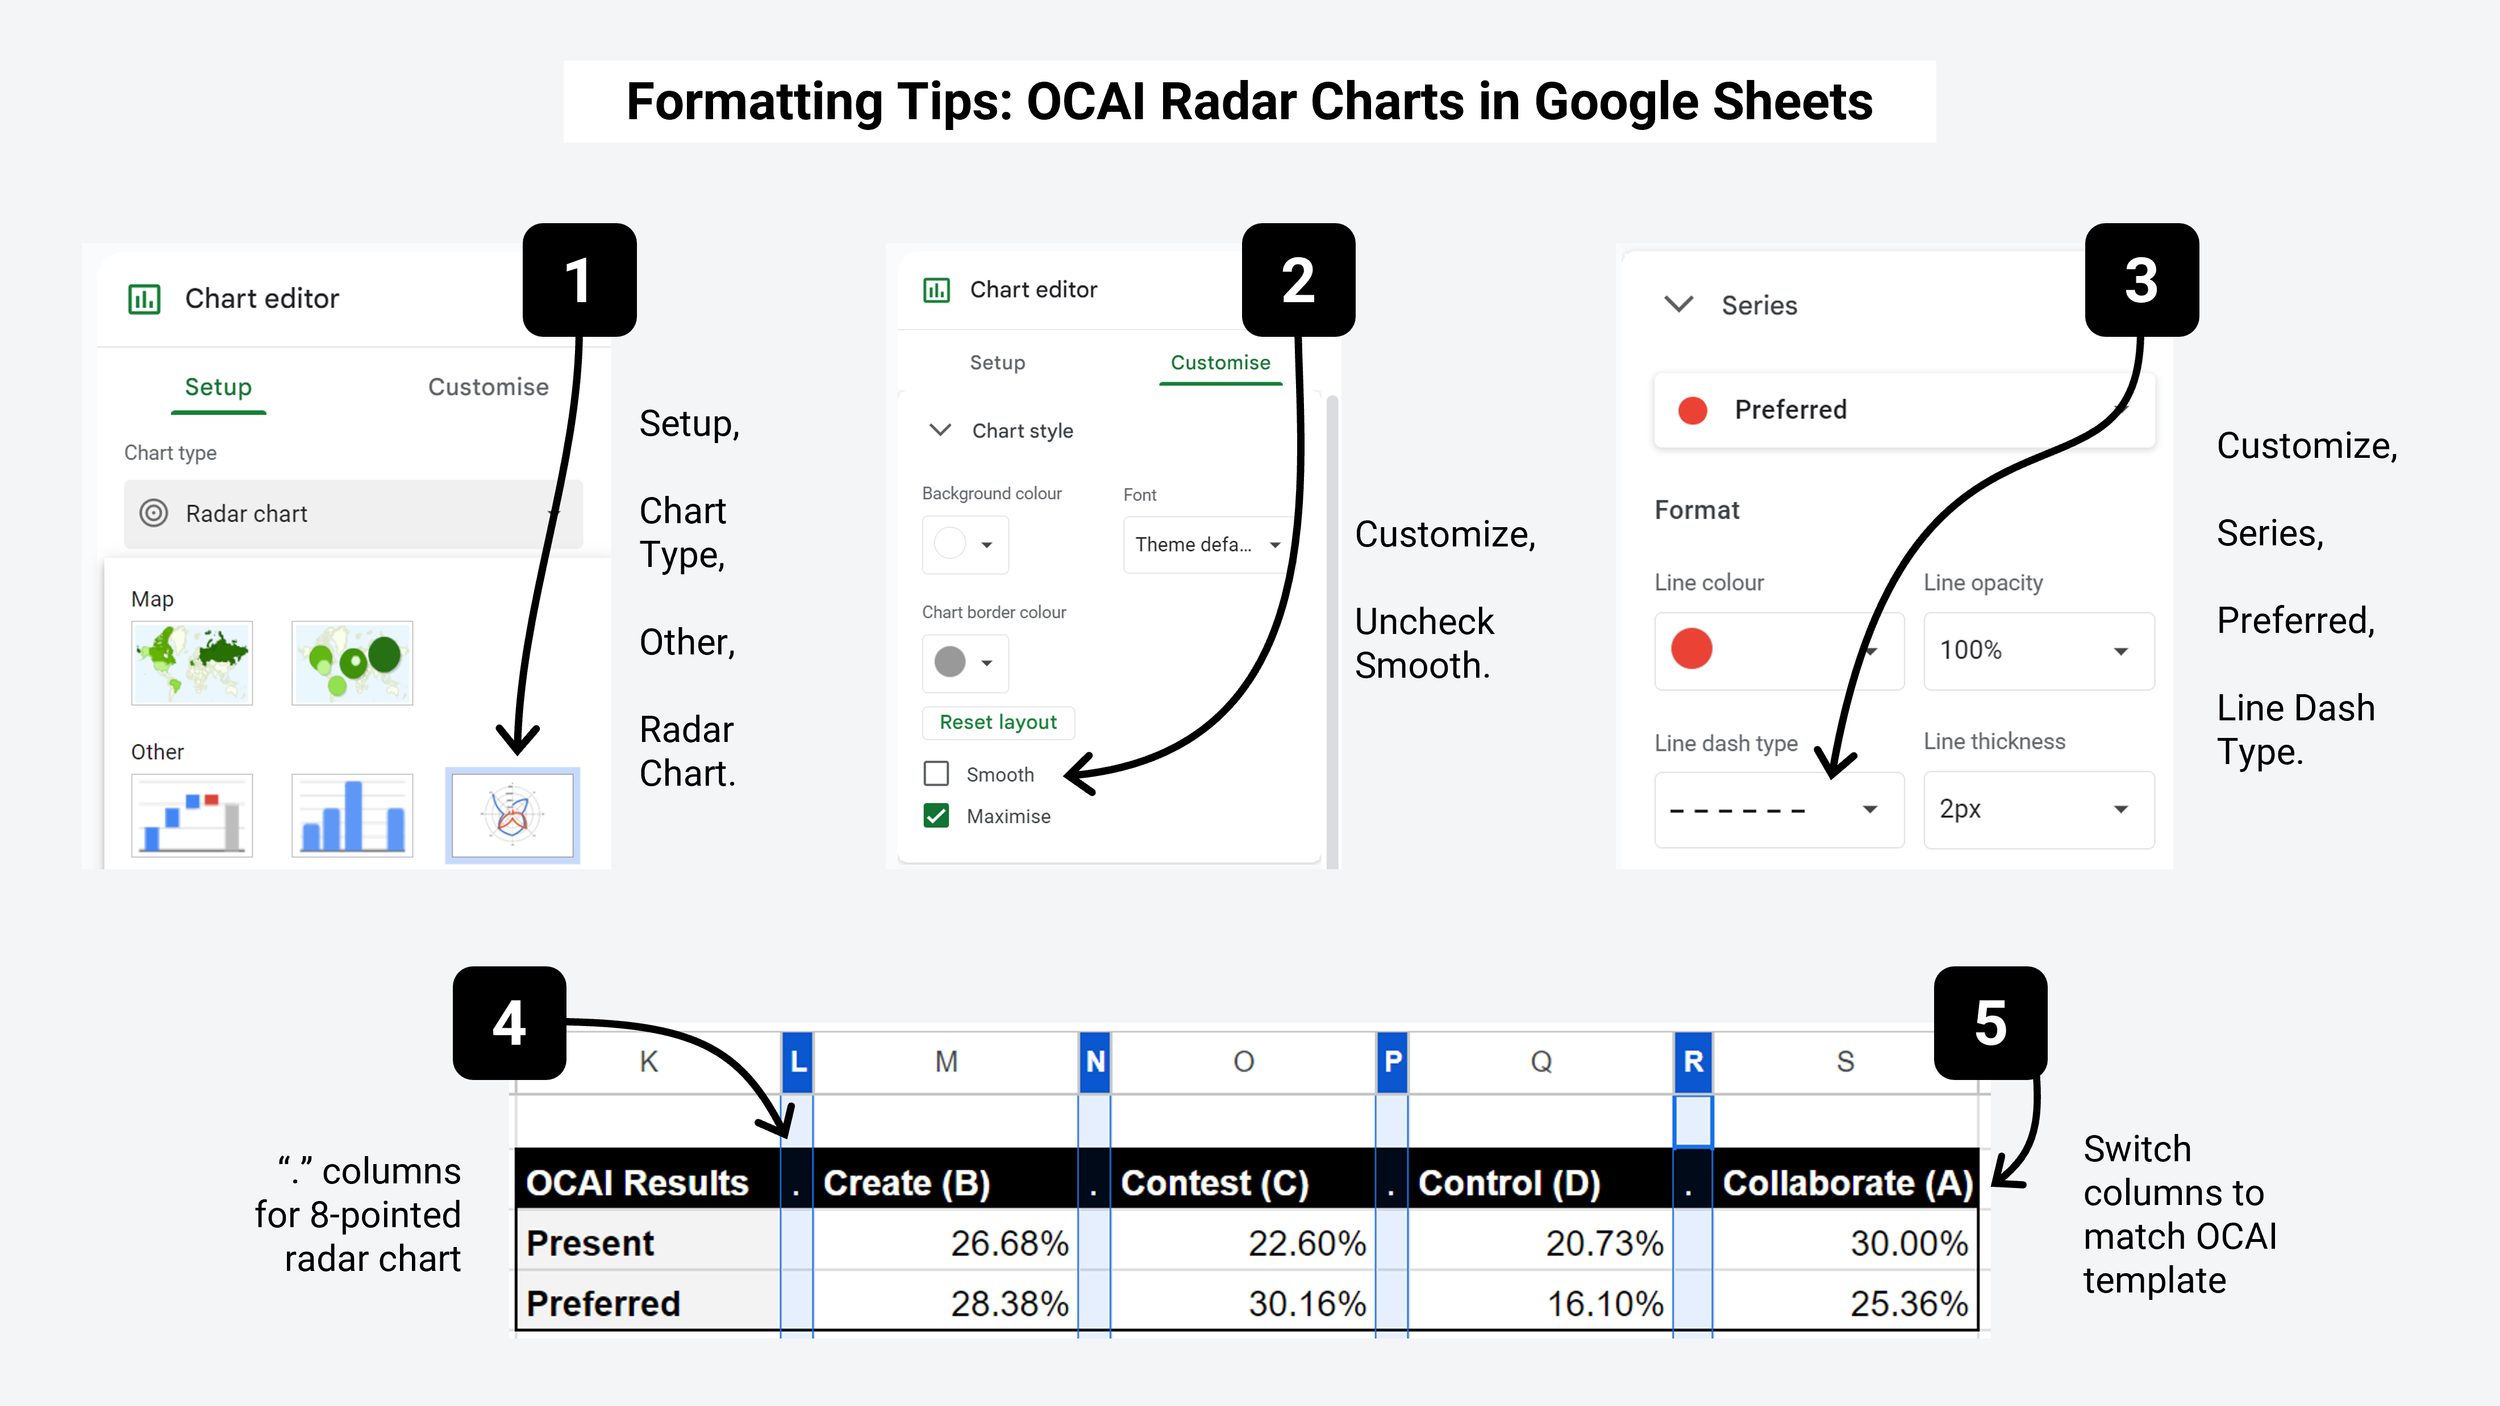
1. When you create a graph on Google Sheets, go to Chart Types and scroll to the very bottom where you’ll find “Radar Chart” in the “Other” section.
2. Go to the Chart Editor, open the Customise tab, open the “Chart Style” dropdown, and disable the “Smooth” checkbox. This will make your lines nice and straight.
3. The original paper on OCAI used a solid line for “Present” and a dashed line for “Preferred”, which is what I opted for here. Some more recent versions use a “Fuscia vs Blue” color scheme, but (a) Google Sheets doesn’t allow you to fill the radar graphs with color so I couldn’t do this anyway, and (b) “Fuscia vs Blue” is not an accessible palette for colorblind folks (like me!).
4. As you can see in the screenshot above, I included four columns with just a full stop “.” between each column of data. This was to push the OCAI data onto the diagonal points rather than the x/y axes.
5. The radar chart starts with the top-center data point and then moves to the top-right point next, so I moved “Collaborate” (which was “A” in my dataset) to the end of the table to get it to appear in the right part of the radar chart.
Comparing Culture by Team
Combining the points from everyone across your entire organization will certainly help you get a high-level view of the company’s overall culture, but it will hide the most interesting insights an OCAI survey can generate — differences between departments, seniority, or geography.
We can call each of these potential groupings “segments”. The most common ways to segment your OCAI survey results are the three I’ve already mentioned: departments (sales vs marketing), seniority (management vs ICs), and geography (North America vs EMEA). OCAI segmentation will help you identify the areas where the perceived company culture differs most.
The tool I’ve mentioned throughout this article, OpinionX, comes with many segmentation analysis features that allow you to (1) filter your results to view a single segment, (2) compare two segments head to head, or (3) view a heatmap matrix of all segments in a single table. These heatmaps can show the results for up to 20 segments at a time, enabling us to spot differences in just a couple of seconds.
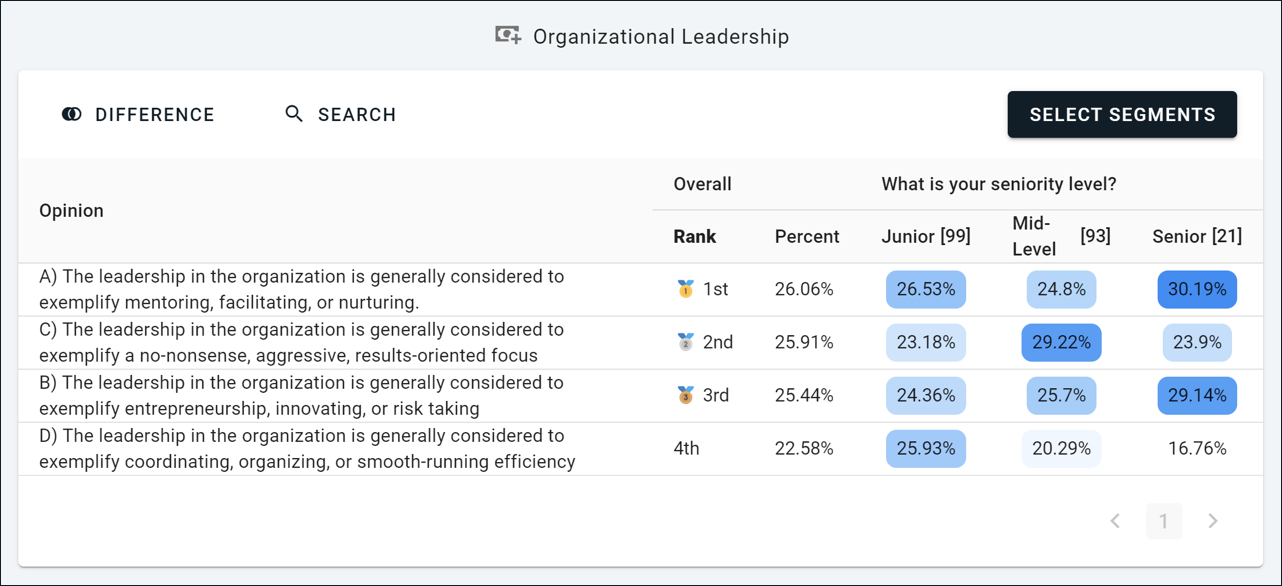
For example, I screenshot this specific question from my OCAI survey because of how different each of the three segments have scored it — Junior Employees lean a lot more towards option D (Control Culture) whereas Senior Leaders see D as the least-influential aspect of culture in regards to Organizational Leadership. Mid-Level Managers, on the other hand, seem to associate strongly with statement C (Compete Culture), possibly a sign that Senior Leaders are putting too much bottom-line pressure on their direct reports.
If we decided to skip segmentation in this case, we would’ve seen that all four cultures were scored quite similarly in this topic, with just a range of 3.48 percentage points between first and last place. Segmenting OCAI results reveals the rich nuances between how different stakeholders perceive the organization’s culture differently. It will also help you find the teams that perceive your current culture most differently from the overall organization’s preferred culture — ie. the most important teams to focus on with your cultural transformation efforts.
There are three ways that you can set your OCAI survey up for segmentation analysis like this:
1. Multiple-Choice Questions: This is the easiest way to set up segments for your OCAI survey. Simply include a multiple-choice question and allow people to self-select which segment they belong to. Once you get around to analysis, OpinionX will already have them grouped in their various segments.
2. Data Import: Upload a list of participants who will complete your OCAI survey. You can send each an email with a unique link, which will automatically associate the data you uploaded with their “participant profile” on OpinionX after they’ve completed the survey. This also lets you set each unique survey link to be single-use, preventing people from completing the survey many times.
3. Manual Tags: On the Participants Tab, you can manually add data to each participant’s profile, such as their email address (identifier data) or department (categorical data). This helps avoid the need to ask for information in the survey that you already have, or to have to import it all in a structured way.
I think any OCAI survey is incomplete without segmentation analysis. It is worth noting that the Segments Matrix (that I used a screenshot of for this example) is a premium feature on OpinionX’s Analyze tier.
Implementing OCAI Results
Here are some suggestions to consider when planning your OCAI survey, collecting data, and tracking cultural change over time:
1. Leadership Commitment
Cultural transformation cannot succeed without the organization’s leadership being aligned and committed to the process. The company’s leaders must be the role models and examples of the preferred culture that the organization commits to become.
2. Engage The Entire Organization
The OCAI works because it requires employee input to measure the existing and preferred culture of the organization. By being transparent about employees’ role in the process and how their answers will shape real change in the organization, you can create successful buy-in amongst all ranks throughout the company. Being transparent in sharing access to the results will also allow people to feel like their input had real influence and impact (you can share access to the interactive results, without including any PII data or requiring account creation, via OpinionX’s guest link).
3. Reinforce & Sustain The Transformation
Cultural change is a long-term journey, not a one-time event. Consistently reinforcing the new cultural values requires recognition of efforts that people make, rewards or incentives to highlight those leading the way, and continuous feedback and adjustment. It’s generally recommended to complete OCAI surveys 1-4 times per year so that you can track progress towards the cultural transformation goals you set, identify changes to the preferred culture over time, and reinforce the fact that the process is participatory in nature and requires employee input to succeed.
Start Your Own Culture Assessment
We’re long past the point of questioning the importance of company culture in the modern workplace. Company culture is so important to employees that 32% of people would take a 10% salary cut in exchange for a better company culture. A study by the University of Warwick found that satisfied employees are 12% more productive than the average worker.
Leaders looking to retain their best employees and help staff find purpose in their work can rely on the OCAI survey as a detailed, objective, quantitative way to analyze an organization’s culture — regardless of size, industry, or country. It gives employees a real voice in shaping the culture in their organization through the “preferred” future culture section in the second half of the survey.
Organizations from startups to publicly-traded multinationals and governments trust OpinionX as their tool of choice for administering OCAI culture assessment surveys. It’s completely free to use, it comes with a “Points Rank” question format that is perfectly suited to OCAI surveys, and has segmentation analysis features you need to spot the outlier groups that think differently from the rest of your organization.