
What Is Stack Ranking: Meaning, Examples, Templates, Advice
“Stack ranking is a method for putting a list of options in order of relative importance when there’s no objective data to sort them by. Instead of measuring each option against a number, you compare the options against each other.”
The term carries two separate meanings: the 1980s HR practice of ranking employees on a forced curve and firing the bottom performers, which most large companies abandoned in the 2010s, and the modern research and prioritisation use, where teams rank customer problems, feature ideas or messaging options to decide what to do next. This guide covers the second.
Six use cases account for most of that work: roadmap prioritisation, idea validation, team consensus, customer segmentation, message testing and measuring feature value. Seven formats serve them, and picking the right one is most of the job: sticky notes, pairwise comparison, points allocation, drag-and-drop rank ordering, consensus ranking, image ranking and MaxDiff.
What is stack ranking?
Stack ranking is a method for ranking a list of options based on their relative importance.
Unlike regular ranking, the method is used when there's no objective data point available to sort the list. Instead, the options get compared against each other subjectively and the comparisons produce the order.
How is stack ranking different from normal ranking?
The difference is whether a number already exists to sort by.
Normal ranking, where the number already exists:
Spotify ranks musicians by total streams in the previous 30 days.
The Premier League ranks clubs by points on the table.
IMDb ranks its top 250 films by average viewer rating out of ten.
Each sorts a list using an objective data point that already exists: monthly streams, league points, average rating. No comparison is needed.
Stack ranking, where it doesn't:
Asking customers to rank a set of problems by which they most want solved.
Each team member ranking interview candidates by suitability for a role.
Ranking your favourite films in the Marvel universe.
There's no obvious data to sort these by. The order only exists once people compare the options against each other.
That distinction is what makes the method useful in research. Almost nothing a customer cares about comes with a number attached, even when everything they do can be counted.
Where did the term come from?
Then: ranking employees on a curve
The term originally described an employee evaluation method popularised by GE chief executive Jack Welch in the 1980s, who called it the vitality curve. Managers ranked their reports on a 20-70-10 distribution: the top 20% rewarded, the middle 70% treated as adequate, the bottom 10% managed out. Critics called it rank and yank.
It fell out of favour through the 2000s and 2010s. Microsoft announced the end of its own version on 12 November 2013, with HR head Lisa Brummel telling staff there would be "no more curve" (SHRM). Other large technology companies have made similar claims over the years, with varying degrees of believability.
If you came here looking for the HR meaning, that's it. Everything below is about the second one.
Now: ranking for prioritisation
It took on its current meaning after the Agile Manifesto in February 2001. Agile's focus on delivering customer value and improving continuously meant teams had to get good at prioritising: which customer needs to address first, which parts of the product to improve next, which ideas carried the most risk or reward.
The method suits those questions exactly. It started with sticky notes on a wall and has since developed into methods like pairwise comparison, the Kano Model, the MoSCoW method and RICE scoring.
What can you use stack ranking for?
The method you should pick depends entirely on what you're using it for. Six use cases, each with the format that suits it.
| Use case | Best method | Why that one |
|---|---|---|
| Roadmap prioritisation | Pairwise comparison | Handles the long problem lists a quarter of feedback produces, and segments cleanly by pricing tier |
| Idea validation | Pairwise comparison | You need to see where your problem lands against every other problem, not just whether people like it |
| Team consensus check | Consensus ranking | You want the option everyone can live with, not the divisive one with the loudest support |
| Customer segmentation | Pairwise comparison plus segmentation filters | One study, then split the ranking by job title, plan or industry |
| Message testing | Pairwise comparison, or image ranking for visuals | Voting reveals preference; asking people which line they prefer does not |
| Measuring feature value | Points allocation or MaxDiff | You need magnitude, not just order, to decide what to put in front of which tier |
1. Roadmap prioritisation
At OpinionX we take every piece of user feedback from the quarter and turn it into a list of problem statements. That list goes to our whole user base as a pairwise comparison survey, and then we filter the ranked results by pricing tier.
That tells us what to work on each month: what's blocking activation and conversion, which shows up as the top problems for free users, and what's hurting retention, which shows up per paid cohort. There's a fuller write-up in our guide to problem-focused roadmaps and the roadmap prioritisation use case.
Method to use: pairwise comparison. The list is usually too long for a drag-and-drop ranking, and you need to segment the result.
2. Idea validation
The best way to validate a product idea is to prove it addresses a high-priority problem your target customer is already trying to solve.
Interview a sample of those customers, collect every problem they mention, rank the lot to measure relative importance, and see where your target problem lands. There's a full walkthrough in our guide to data-driven idea validation, and a related argument about why traditional surveys fail at this.
Method to use: pairwise comparison, because the point is where your problem sits against all the others.
3. Team consensus check
Ever sat in a meeting where nobody agrees and there's no common ground to build from?
Ask each person to write their position down, put the statements into a ranking survey, and share the link. Participating gets people bought in, and a quantitative result gives the conversation somewhere to go.
Method to use: consensus ranking, because in this situation the option everyone can accept beats the option with the highest average enthusiasm.
4. Customer segmentation
One of the most common mistakes teams make is targeting several customer segments with one generic value proposition. It often feels like the only way to map each segment's real need is a week of separate interviews per segment, which is slow and expensive.
There's a shortcut. Rank their collective priorities in one study, then filter the results by job title, seniority, geography or industry to see how the ranking changes per group. That's needs-based segmentation, and crosstab analysis handles the more involved cuts.
Method to use: pairwise comparison with segmentation filters applied afterwards.
5. Message testing
Picking a value proposition, landing page copy or sales deck messaging usually means building the whole thing and finding out how people react after you ship.
You can measure it first instead. Pairwise comparison models real decision-making because it doesn't rely on stated preference: people's votes reveal what they'd click on, which is not the same as what they'd tell you they like. So you can put a list of messaging options in front of an audience and measure the winner without building a single mockup.
Method to use: pairwise comparison for copy, image ranking for visual concepts.
6. Measuring feature value
It's hard to know which features on your premium plans to shout loudest about, especially as the tiers fill up with paywalled functionality.
Invite users to a pairwise comparison survey containing capability statements, meaning the underlying thing each feature lets them do, under the question: "If our product could only do one of the following things for you, which would you pick?" Whichever capabilities rank highest per tier are the ones driving value, so raise their visibility to users on lower tiers. Our guide to the Value Adoption Matrix goes further on this, and there's a related piece on ten reasons not to build a feature.
Method to use: points allocation or MaxDiff, because magnitude matters here and a plain order doesn't tell you how much more one capability is worth than another.
Which stack ranking method should you use?
1. Sticky Notes
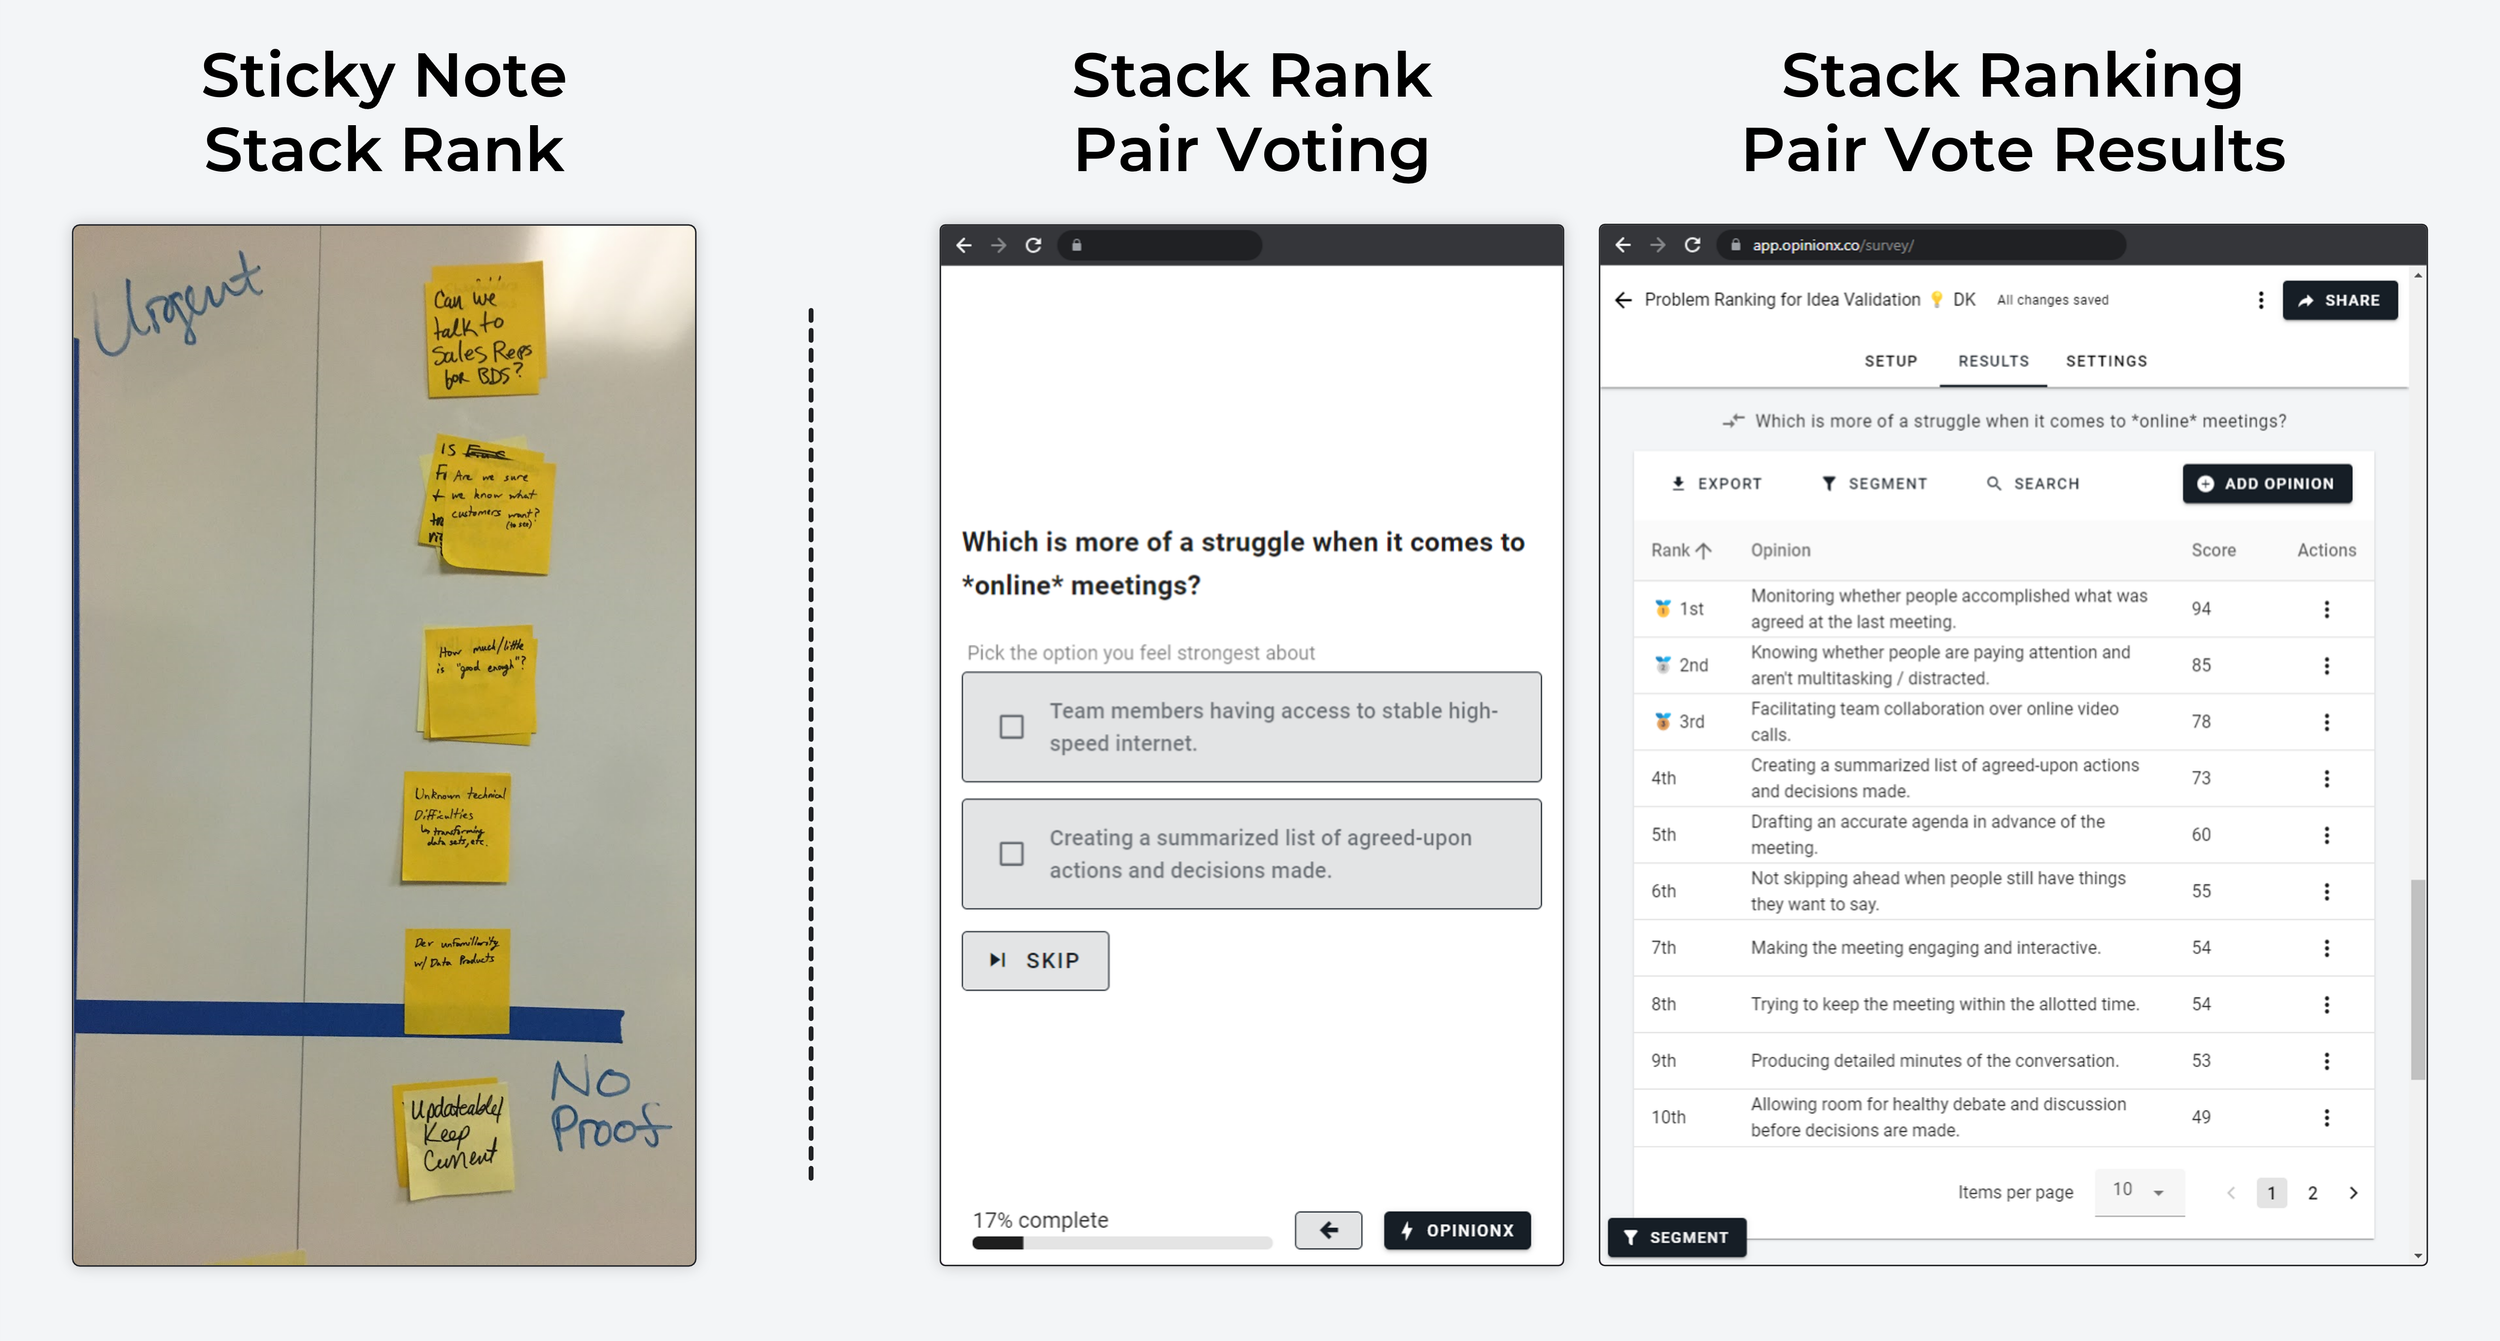
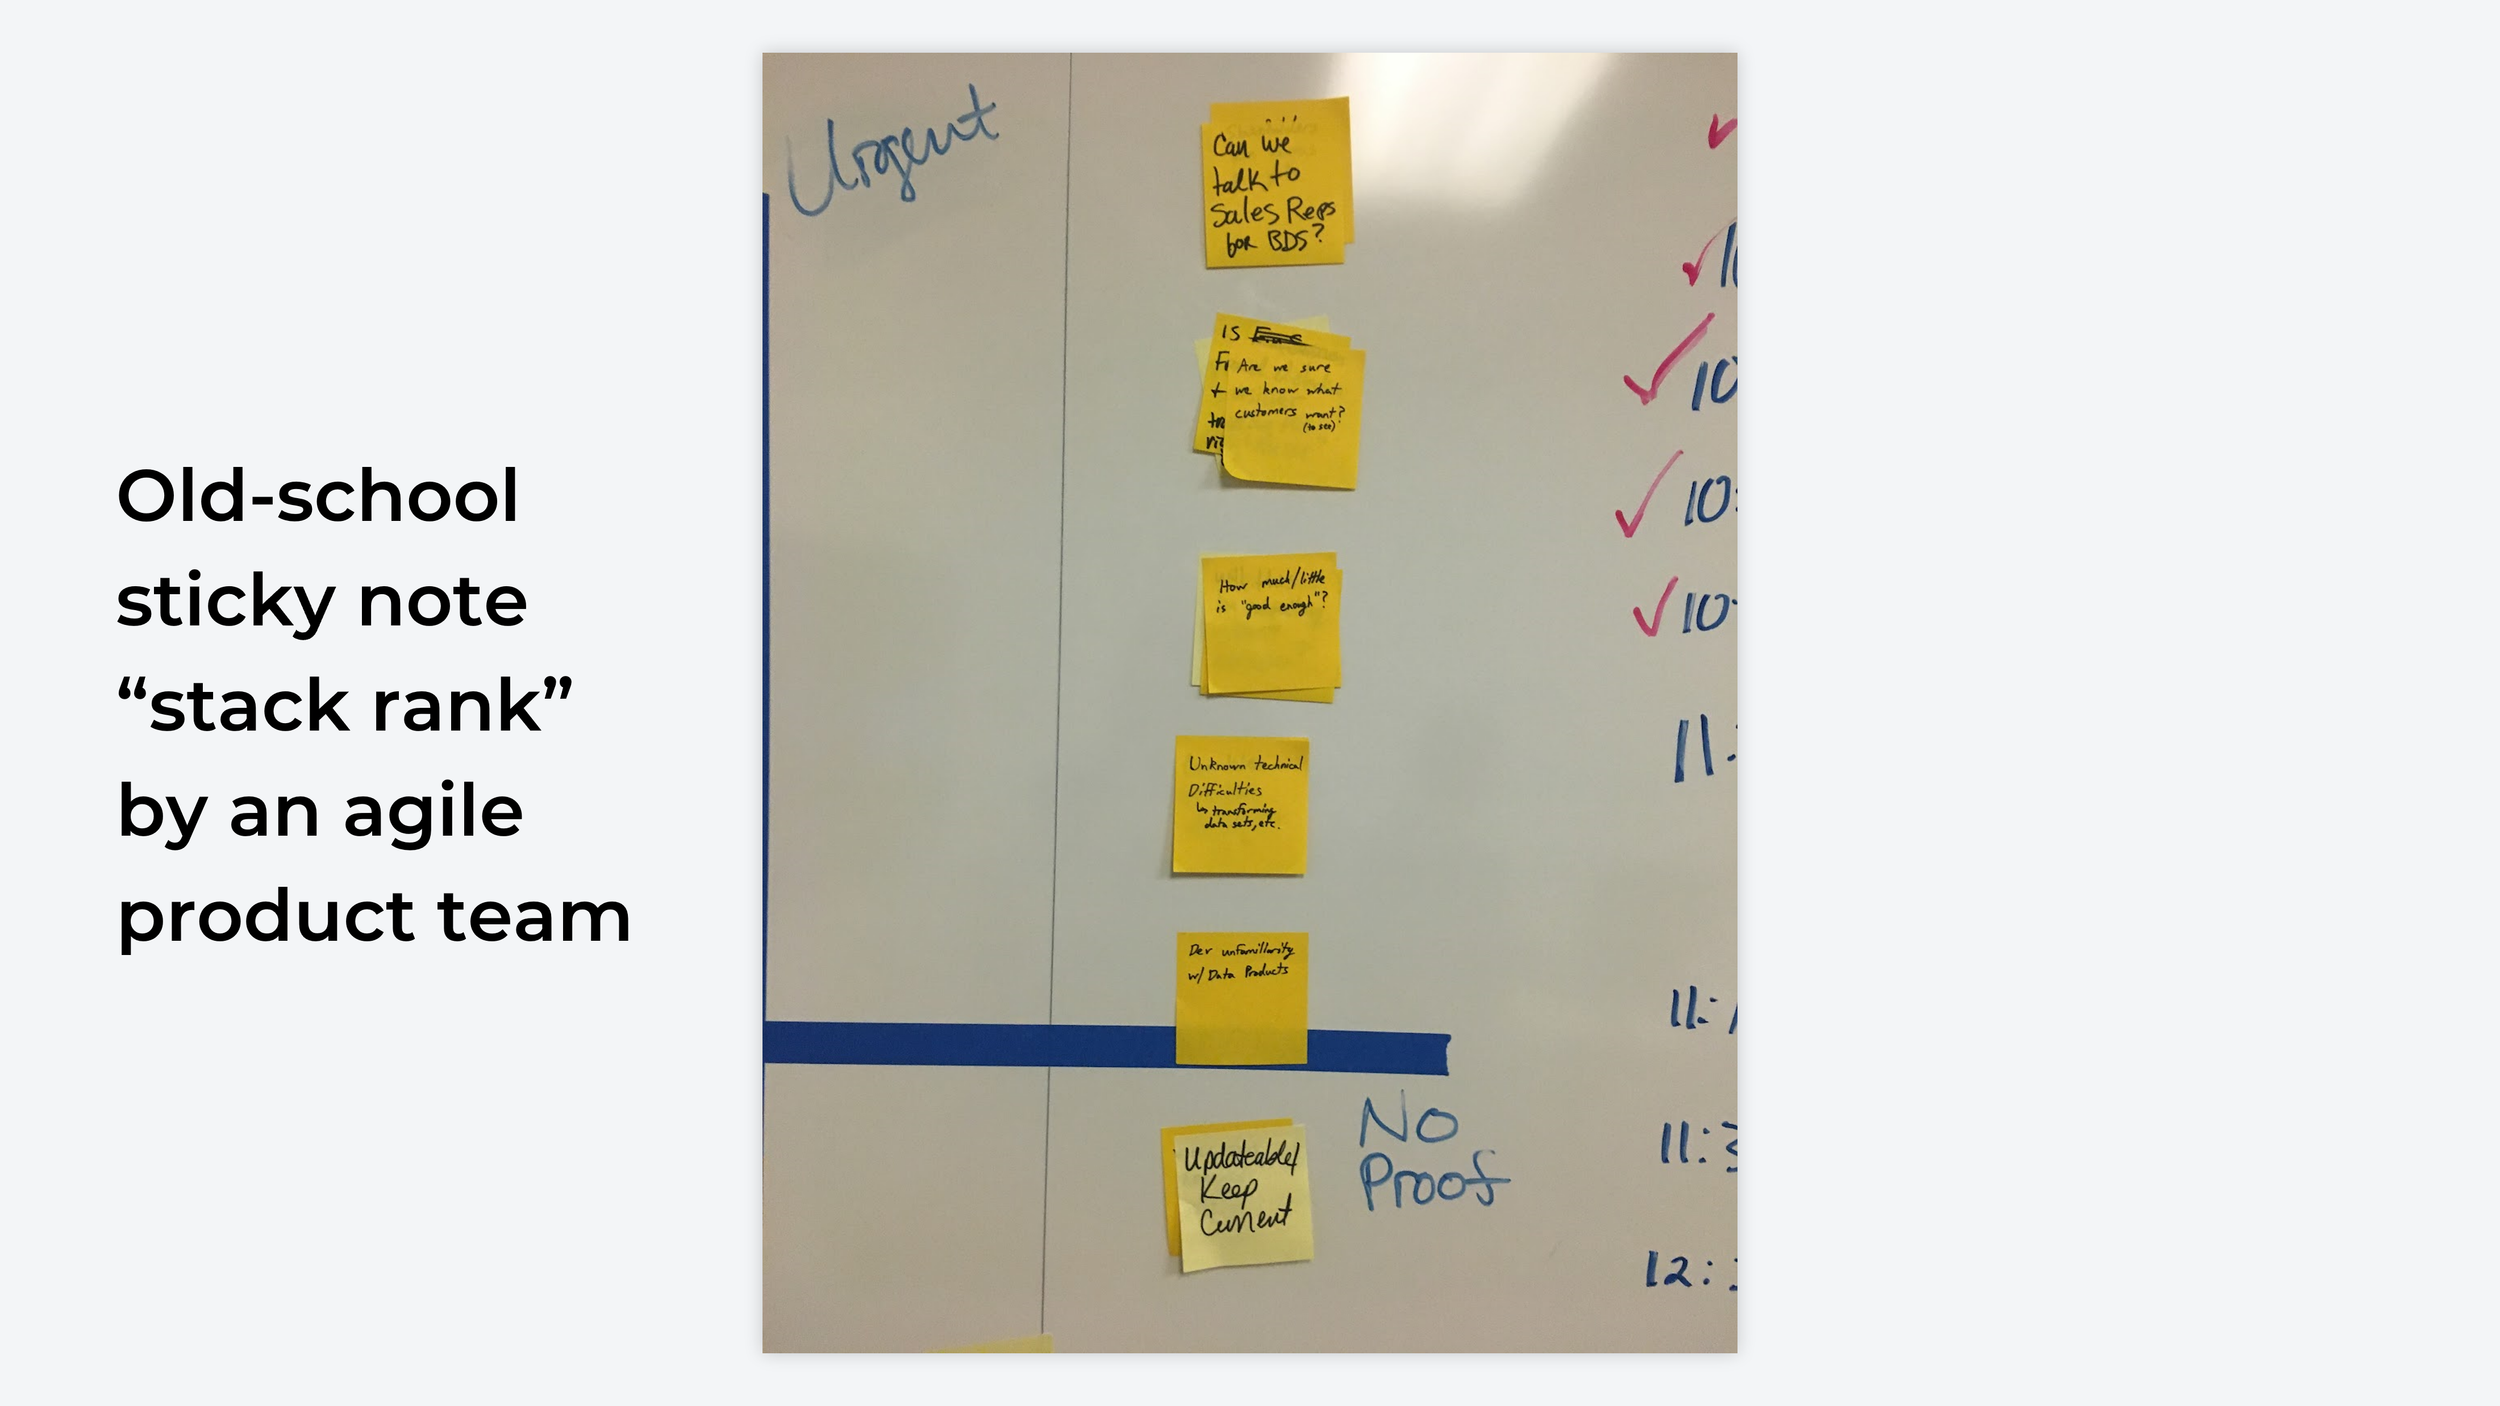
Method: a wall, a stack of sticky notes and a marker. The process is the same whether one person ranks or many: stack the options from highest preference down.
Scoring: two options. If everyone ranks the same list, a Borda count works, giving one point for first place, two for second and so on, then averaging per option, with the lowest score ranking highest. If people rank different numbers of options, use the Dowdall count instead: first place gets 100 points, second gets 100/2 = 50, third gets 100/3 = 33. Dowdall gives everyone's first choice the same weight and lets people rank only what's relevant to them without being penalised.
2. Pairwise Comparison
Method: pairwise comparison is an online format that takes two options at a time and puts them head to head. Each participant votes on several pairs.
Scoring: for each option, wins divided by the number of pairs it appeared in. A pairwise tool does this automatically, and we've published how our ranking formula works if you want to check it.

Example of Pairwise Ranking on OpinionX
3. Points Allocation
Method: each participant gets a budget of points to spend across the options however they like. Best when you need the magnitude of preference rather than just the order. Available in several survey tools, or offline as dot voting.
Scoring: total the points per option, and average by participant count if you need to.
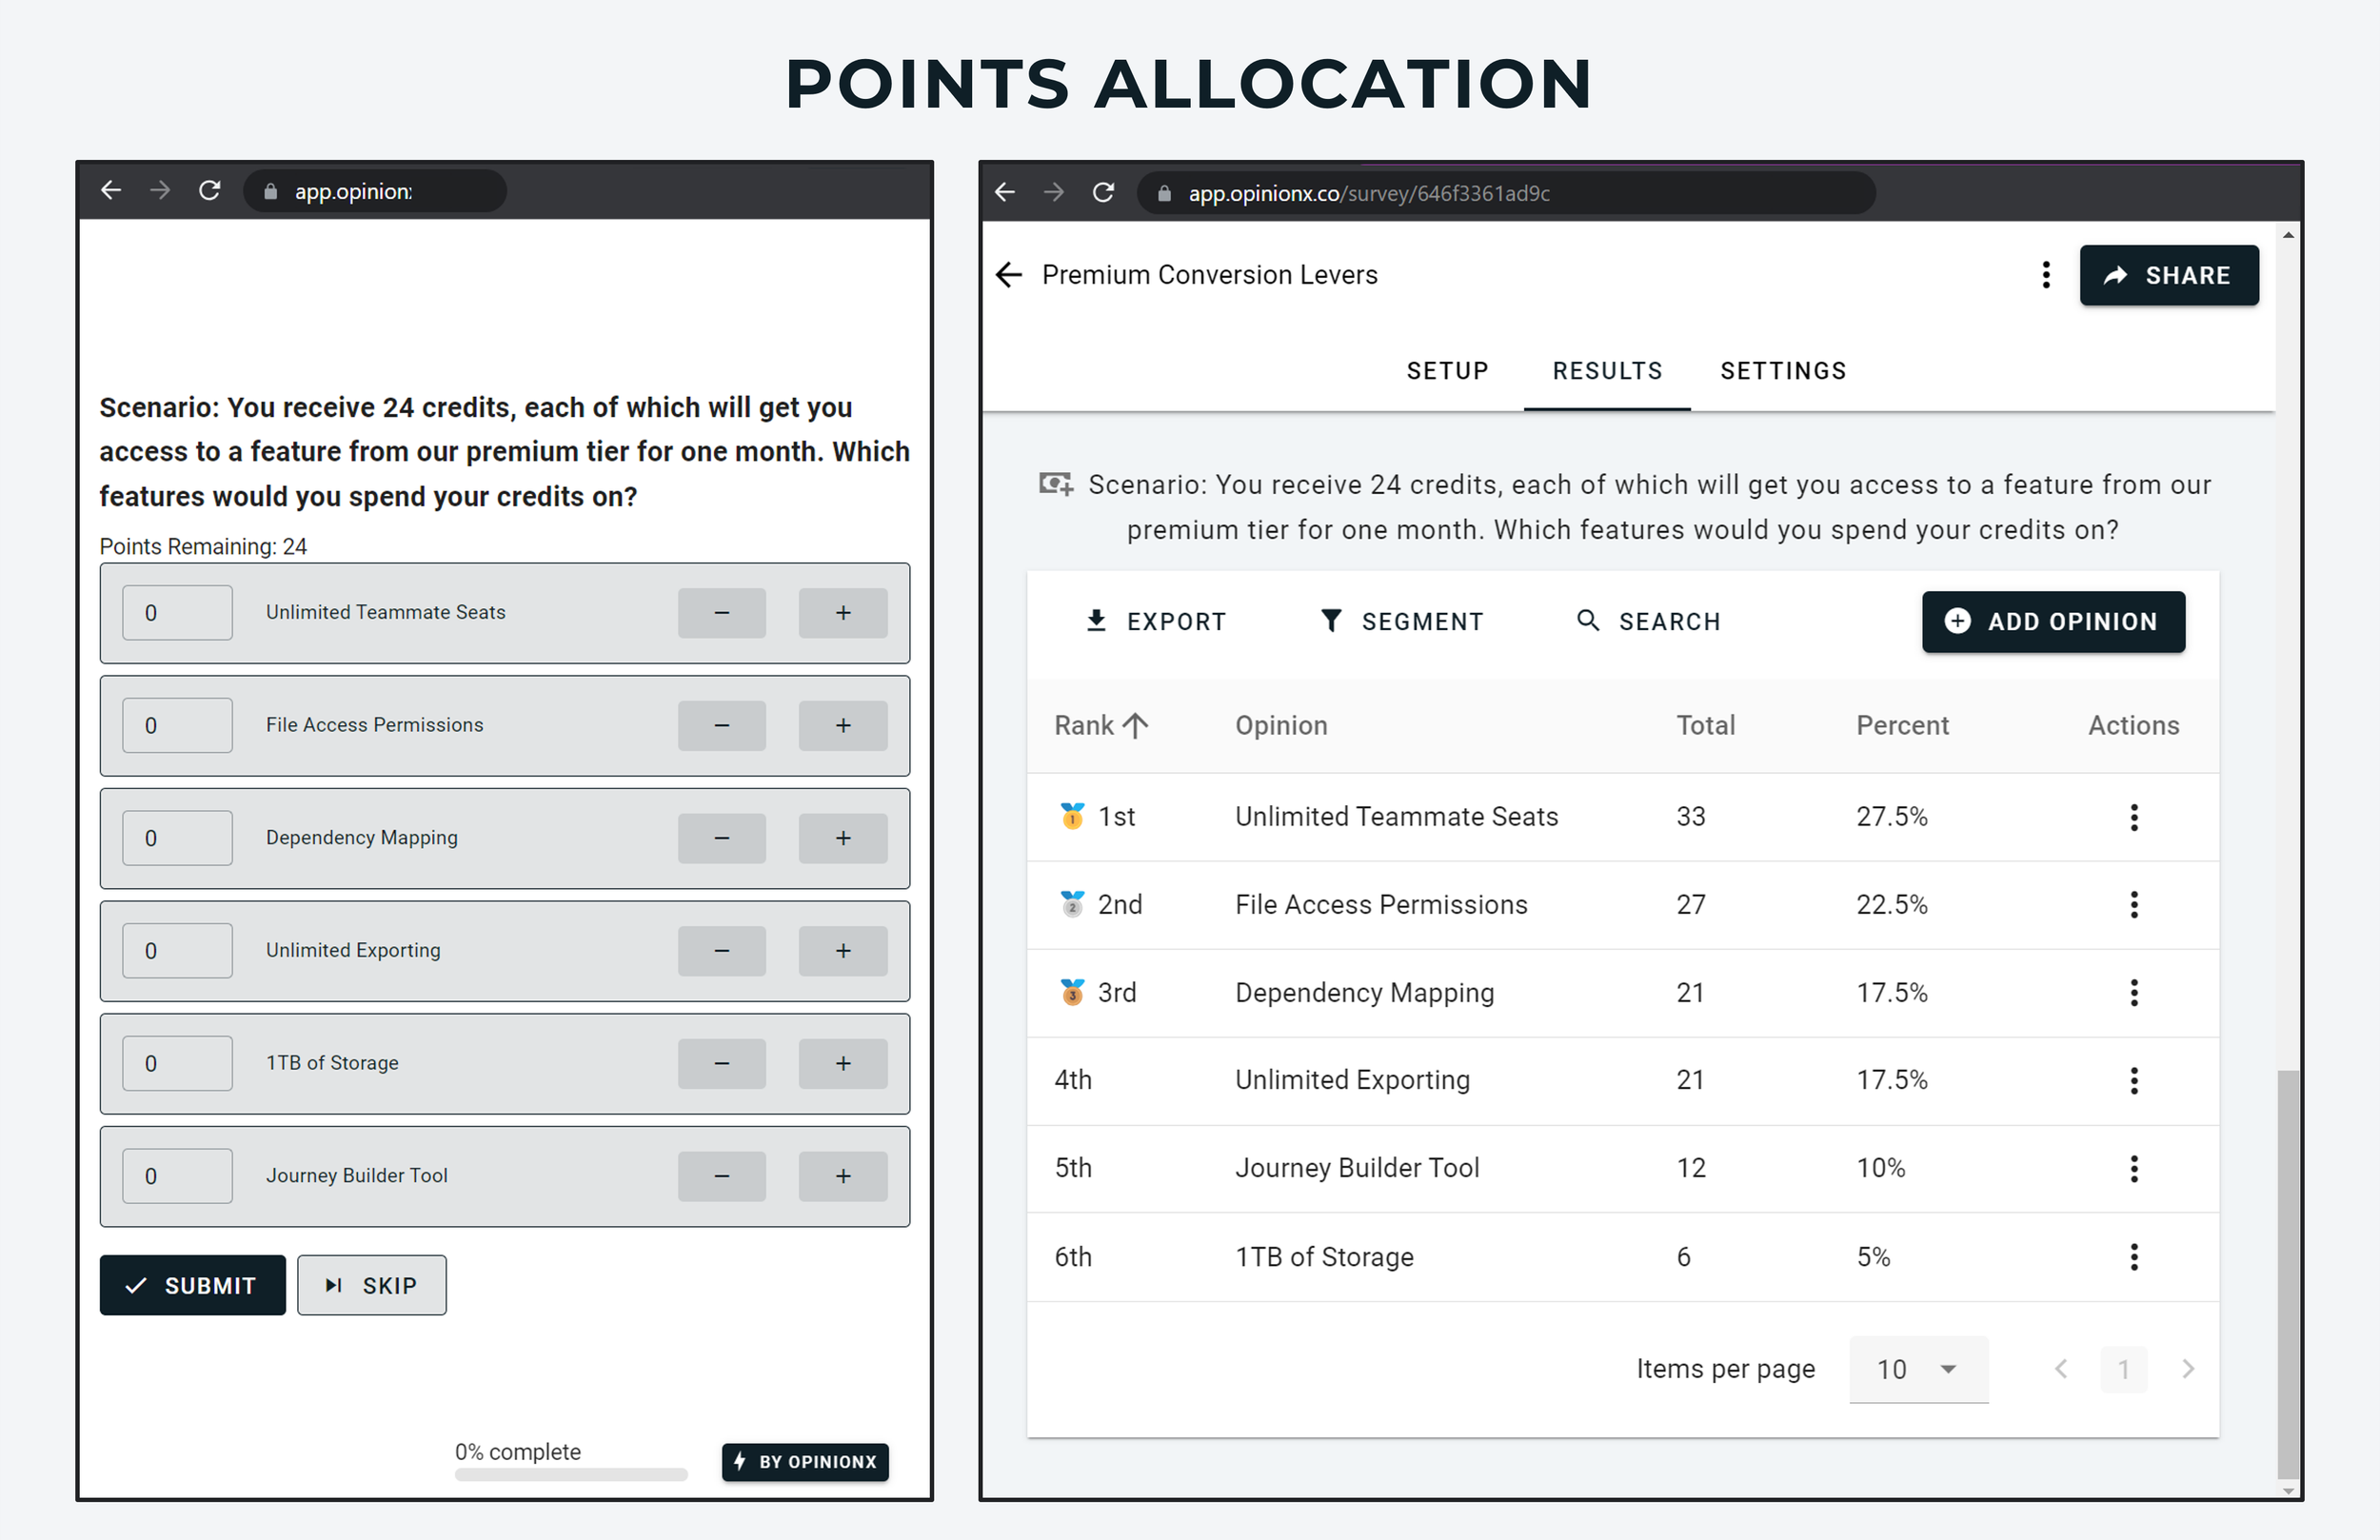
Example of Points Allocation ranking on OpinionX
4. Drag-and-drop rank ordering
Method: participants see every option and drag them into their preferred order. Only suitable for short lists, six to ten options maximum.
Scoring: Dowdall count, giving each option 100 divided by its rank position, so fourth place scores 25. Average the points and rank from highest down. Dowdall doesn't require everyone to rank the same number of options, so people can leave out anything irrelevant to them.
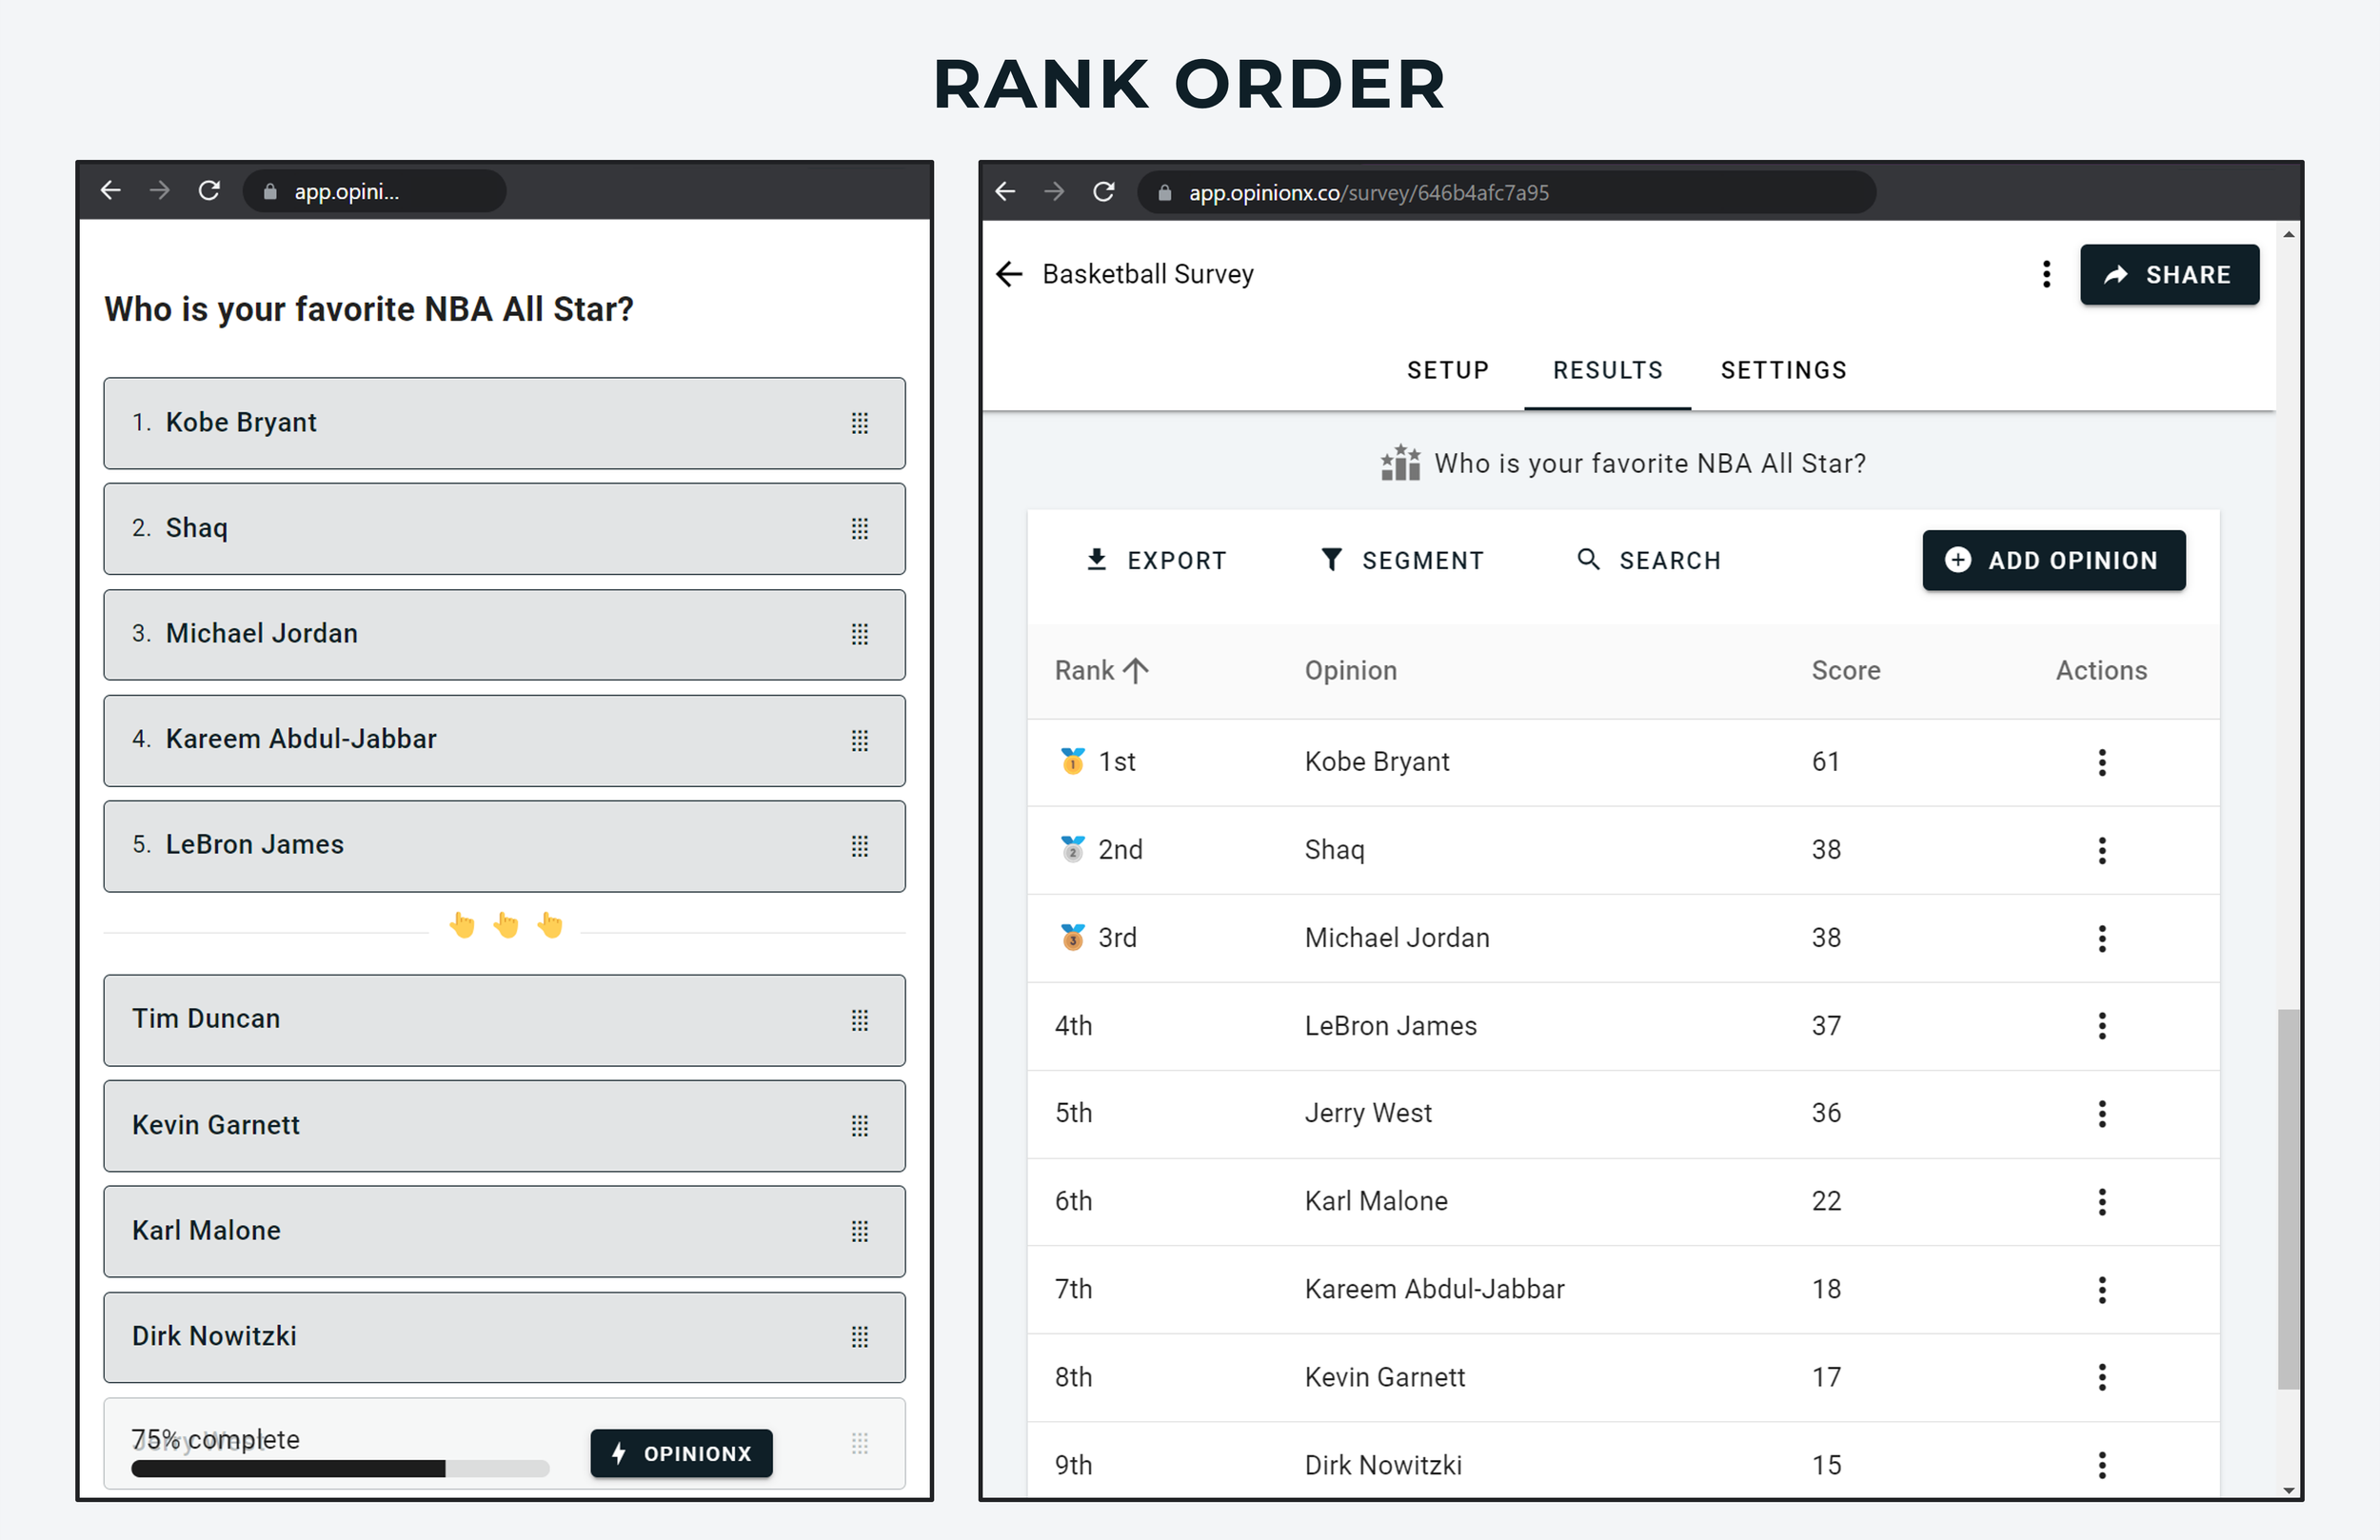
Example of Rank Ordering on OpinionX
5. Consensus ranking
Method: participants vote agree or disagree on each option. Strictly this isn't stack ranking, since the options aren't compared against each other, but it's the right tool for finding the highest-consensus option rather than the highest-importance one.
Scoring: agrees divided by total votes gives a consensus percentage per option.

Example of Consensus Ranking on OpinionX
6. Image ranking
Method: the same underlying format as pairwise comparison, using mockups, sketches or photographs instead of text, which makes voting considerably more engaging.
Scoring: wins divided by pair votes, as with pairwise comparison.
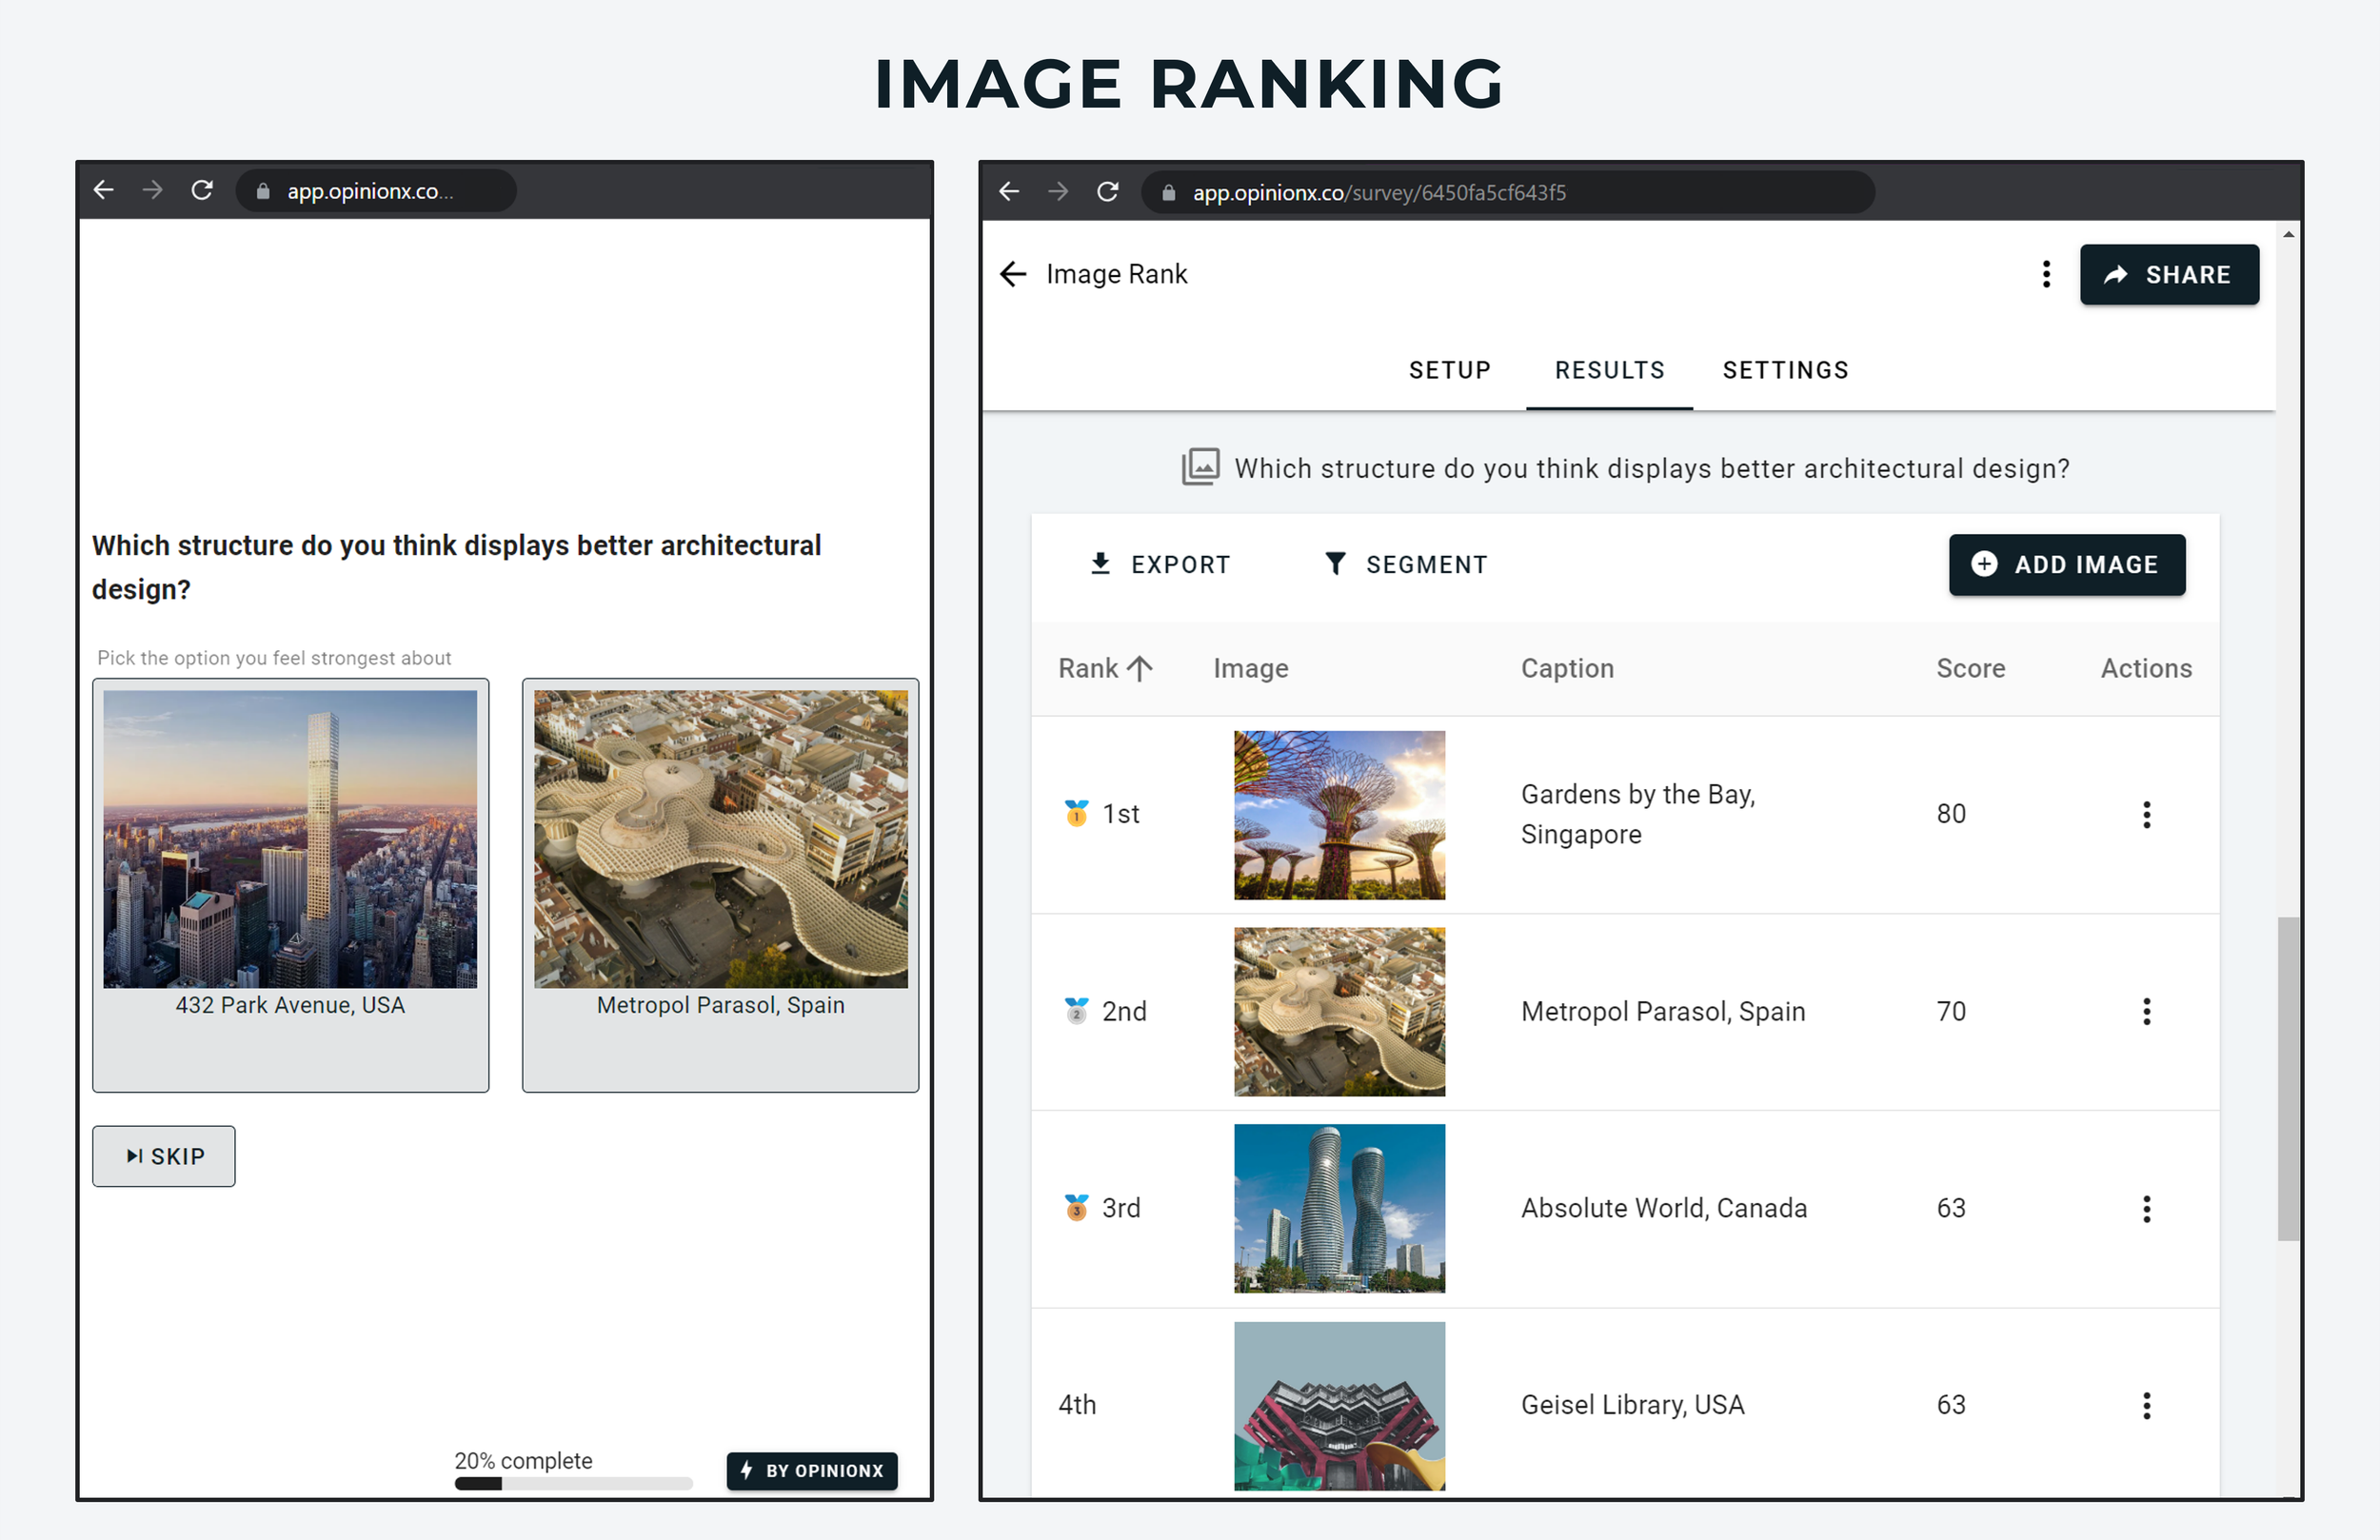
Example of Image Ranking on OpinionX
7. MaxDiff analysis
Method: MaxDiff is a denser version of pairwise comparison. Instead of two options it shows three to six and asks participants to pick the best and the worst from that set.
Scoring: most MaxDiff tools use Bayesian models to turn voting patterns into a ranking, which makes their scoring hard to inspect. You can also calculate it by hand: subtract the number of times an option was picked worst from the number of times it was picked best.
MaxDiff runs on the OpinionX free tier with every analysis feature unlocked, and Sawtooth has added a free tier capped at 50 participants since I first wrote this. I've compared nine MaxDiff platforms if you want the full picture.
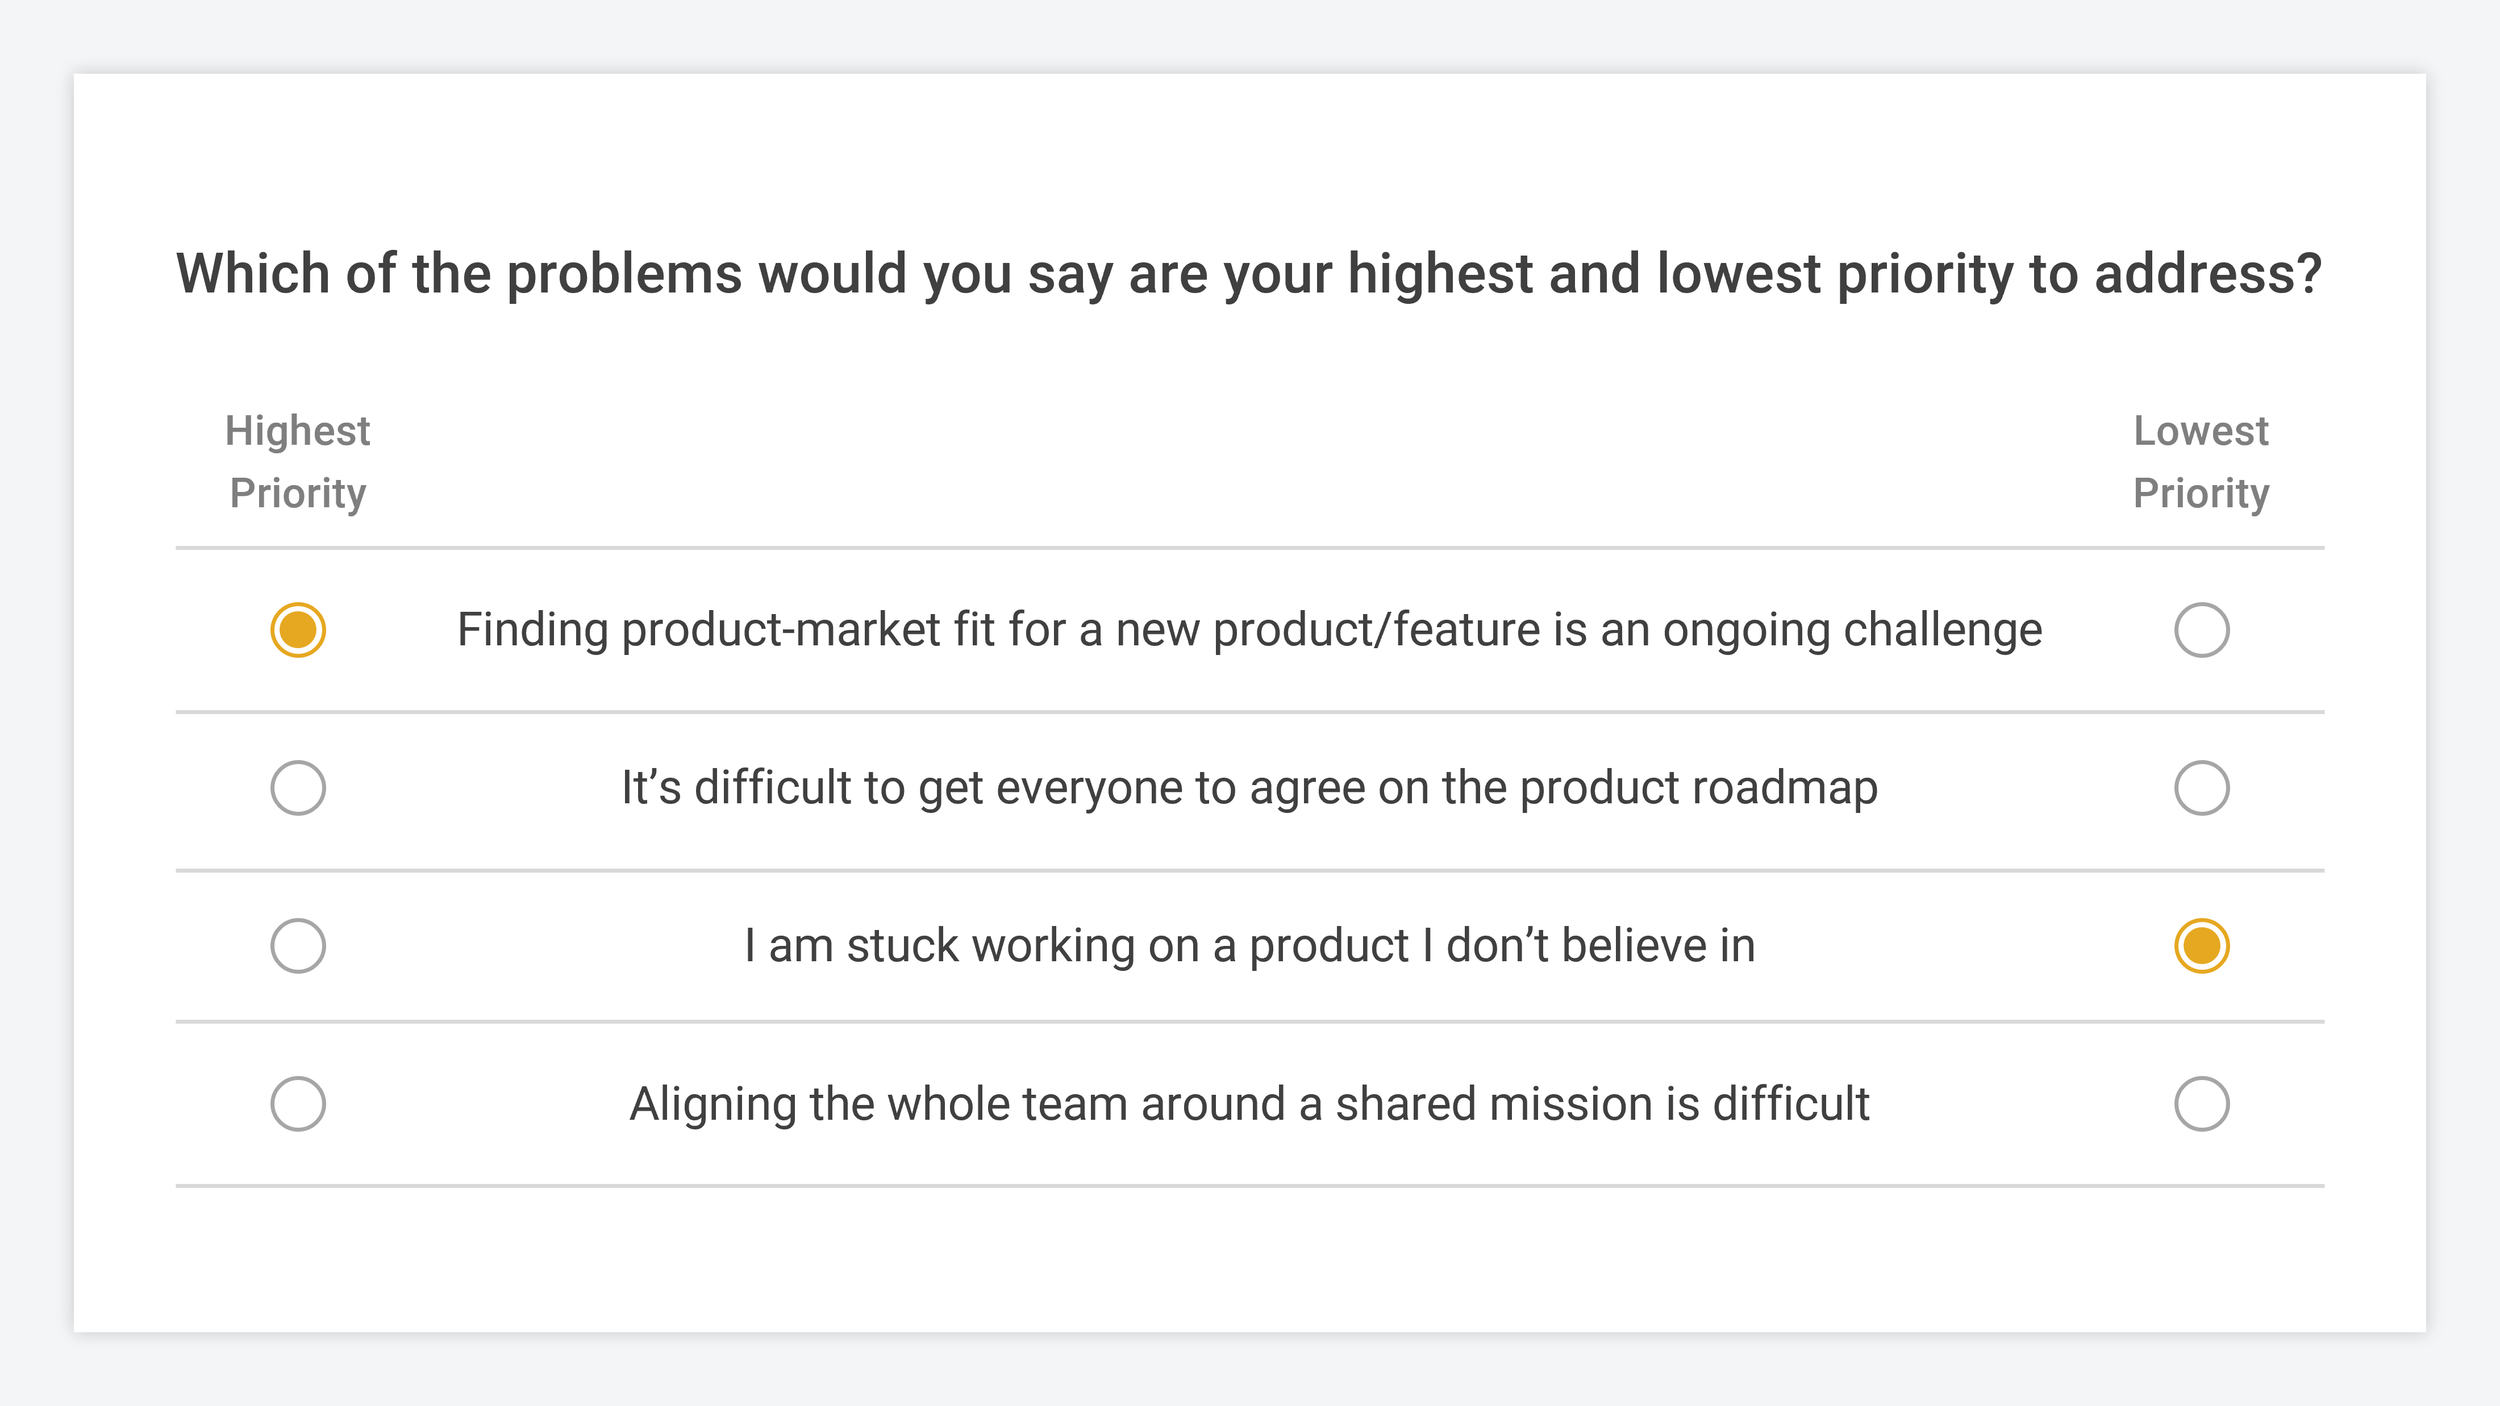
Example of a MaxDiff Analysis survey
What does a real project look like?
In early 2021, six months after launching my first startup, we'd just lost our only customer and couldn't work out why nobody understood the value of what we'd built. We decided to run one last experiment before giving up: ask our target customers to rank a list of problems, so we could see where the problem we were solving sat in their priorities.
In one evening we drafted a list of problem statements from our discovery interviews and shared it with our target customers. Within the first two hours of voting we could see our key problem statement was ranked dead last out of 45.
The surprise was that five of the top seven problems were closely related to the one we were chasing.
So the next morning we rewrote the landing page and the onboarding flow around those five instead. Inside a week we had multiple paying customers, the landing page was converting to trial three times better, and we had our first testimonials.
There's a longer write-up of that experiment in our guide to Customer Problem Stack Ranking and the method Shreyas Doshi described that prompted it.
What should you watch out for when running a stack rank?
1. Pick the method deliberately
The most commonly available online format, drag-and-drop rank ordering, shouldn't be used with more than about six options. Data quality falls away fast beyond that, and pairwise comparison or MaxDiff will serve you better on a long list.
2. Let participants add options
In a 2021 study of our own surveys, 81% of those that let participants submit new options ended up with a participant-submitted option in the top three (OpinionX internal data, Q2 2021).
That matters most in customer problem work, where participants know the terminology and context of their own problems better than you do. Add an optional text response box after the ranking question so people can submit anything they considered but didn't see.
3. Always segment the results
The most useful thing you can do with a result is compare how the order changes across segments of your participants. Job type, pricing plan, geography, whatever divides them: run the comparison per group, ideally with an automated segmentation filter rather than by hand.
What you're usually looking for is a statement that moves several places for one group, because that gap is the thing you can act on.
Frequently asked questions
What is stack ranking? Stack ranking is a method for putting a list of options in order of relative importance when there's no objective data available to sort them by. Options are compared against each other, and the comparisons produce the order.
What is the difference between stack ranking employees and stack ranking in product management? They share a name and nothing else. The employee version is a performance management practice from the 1980s that forced managers to rank staff on a curve and remove the bottom performers. In product and research it means ranking options such as customer problems, feature ideas or messaging to decide what to prioritise.
Do companies still stack rank employees? Far fewer than once did. Microsoft ended its version in November 2013, and most large technology companies have distanced themselves from forced-curve reviews since, though the practice hasn't disappeared entirely.
What is the best stack ranking method? For most research use cases, pairwise comparison, because it handles lists of any length, keeps the participant's effort low and produces a result you can segment. Use drag-and-drop rank ordering only for six to ten options, points allocation when you need magnitude, and consensus ranking when agreement matters more than preference.
How many options can you rank at once? With pairwise comparison or MaxDiff, effectively as many as you like, since each participant only sees a subset. With drag-and-drop rank ordering, six to ten before data quality suffers.
The list we ranked in one evening put our own product's problem at 45th out of 45. Nobody had told us that in an interview, and no analytics dashboard was ever going to.
Want more like this? Over 42,000 researchers and product people get The Full-Stack Researcher in their inbox. Subscribe for the next one.
Every method above runs on OpinionX's free tier: $0, unlimited surveys, unlimited researcher seats, capped at 25 participants per survey, then $900 a year to lift the cap (full pricing). There are ready-made templates for roadmap prioritisation, idea validation and team workshops in the sample survey gallery.