
Pairwise Comparison (Definition, Methods, Examples, Tools)
What is Pairwise Comparison?
Pairwise comparison is the process of comparing a set of options using head-to-head pairs to judge which one is the most preferred overall. Also known as “pairwise ranking”, it is a popular research method used for ranking people’s preferences, informing strategic decisions, and conducting voting at scale.
This guide covers every common question about pairwise comparison, such as…
How does Pairwise Comparison work?
Pairwise comparison works by breaking a set of options down into a series of head-to-head votes. Once a respondent picks their preference from the two options, their vote is recorded and a new pair of options from the set are shown for the next vote.
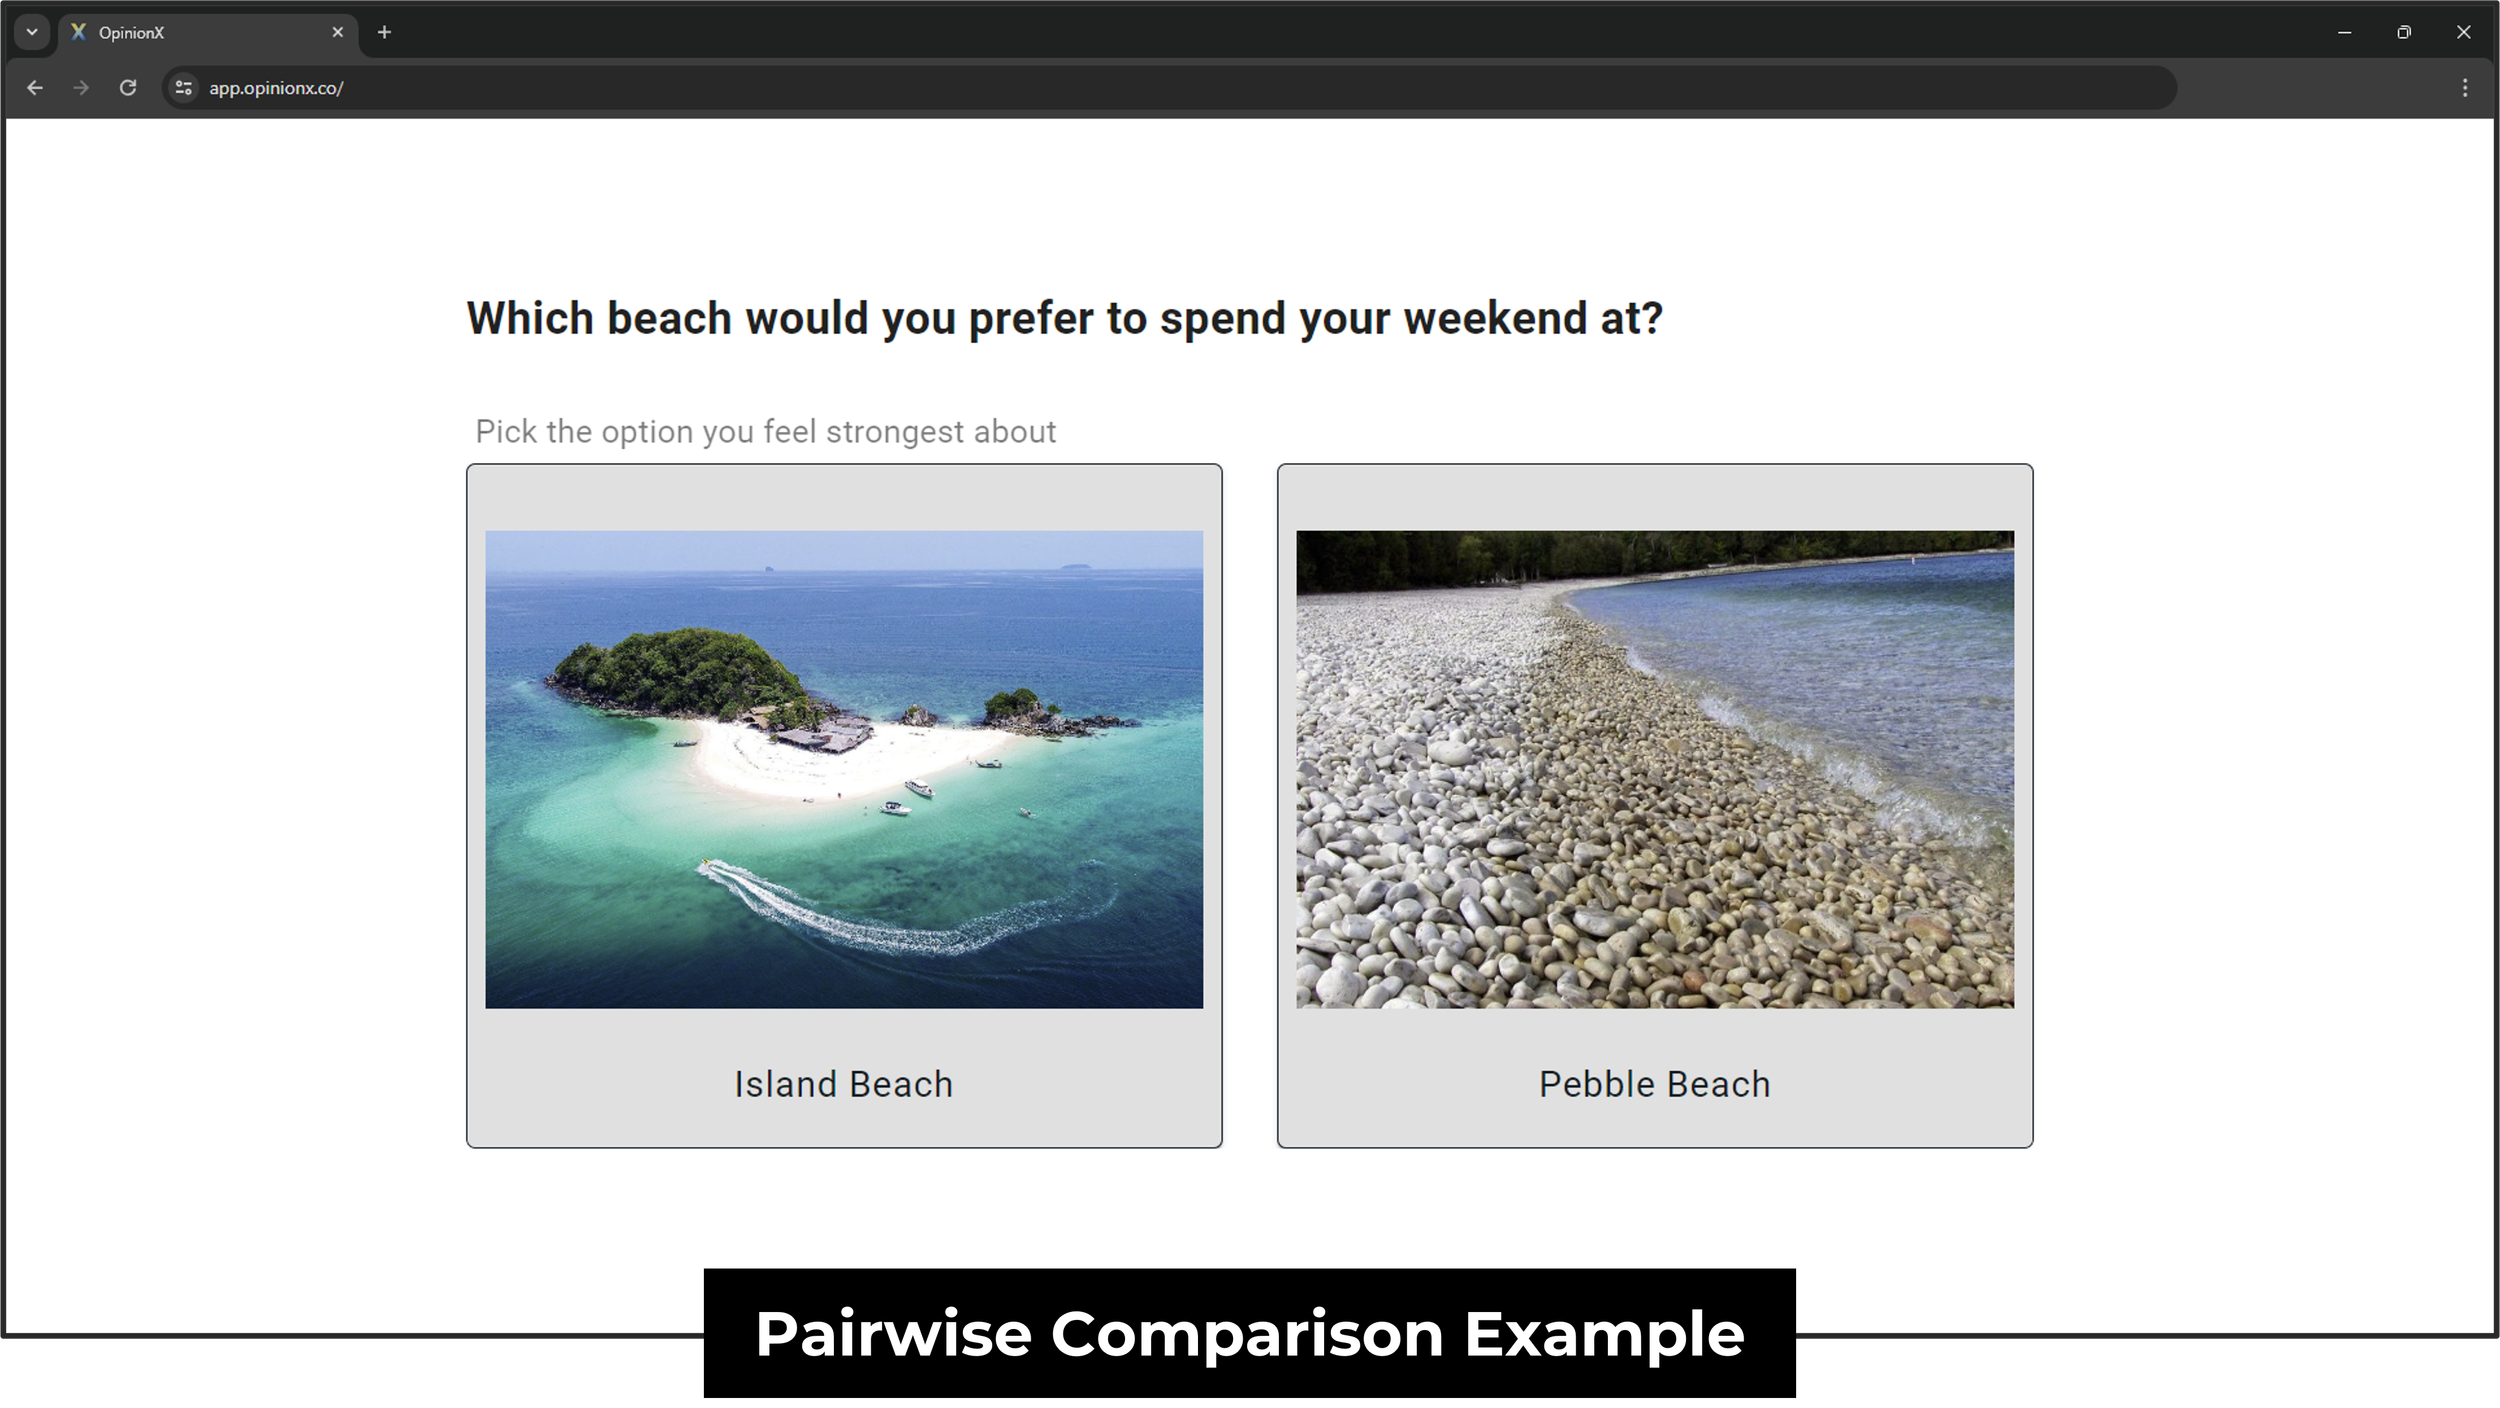
Pairwise comparison is a popular survey question format for ranking a list of options. For example, imagine you’re starting a new podcast and you’ve brainstormed a list of 20 names. There’s no measurable way to rank a subjective list like a bunch of podcast names, so trying to rank them all at once in an ordered list is very difficult. Instead, breaking the names into a bunch of pairs and picking the one you prefer from each pair only takes a couple of minutes and produces a list of podcast names ranked from most to least preferred. Here’s an example you can try for yourself:
In a pairwise comparison survey, one respondent can be tasked with voting on every possible pair combination, or a bunch of people can each be given a sample of pairs to complete that can later be used to calculate the group’s overall combined preferences.
The total number of possible pairwise comparisons from a list of options is n(n-1)/2, where “n” stands for the number of options in the set. For example, a set of 10 options has 45 possible pairwise comparisons ( 10(9)/2 ). Further down in this guide, I explain in more detail the differences between a survey that shows every possible pair and a partial ranking survey.
Why do people use Pairwise Comparison?
I. Easy Input
Comparing two things at a time is a quick and easy decision that anybody can make, even when trying to rank seemingly complex options. Respondents don’t require any training upfront for a Pairwise Comparison survey because of its intuitive simplicity.
II. Mobile Friendly
Pairwise comparison is 10x easier to do on a mobile phone than a drag-and-drop ranking question. Over 94% of people completed surveys using a mobile phone in 2023. Respondents from mobiles have a 10% higher completion rate than desktop users and surveys optimized for mobile devices take 30-40% less time to complete. Pairwise comparison is the best choice for phone-based ranking.
III. Long Lists
Asking people to rank a long list of options by personal preference creates a LOT of cognitive load, which decreases survey completion rates and increases junk data submissions. Experts recommend a maximum of 6-10 options for drag-and-drop ranking questions. Pairwise comparison, on the other hand, is suitable for ranking anywhere from two options up to hundreds all in a single survey.
IV. Numerical Results
Decision makers love pairwise comparison because it takes qualitative options like text statements or images and enriches them with numerical data, making them far more valuable for informing big decisions.
V. Real Decisions
Pairwise comparison mimics how people make decisions in real-life by forcing respondents to compare options and compromise based on their personal preferences or requirements. The more similar your data collection method is to how people think/act in real-life, the more accurate your research results will be too!
How do you calculate Pairwise Comparison results?
There are three calculation methods you can use when scoring pairwise comparison voting data:
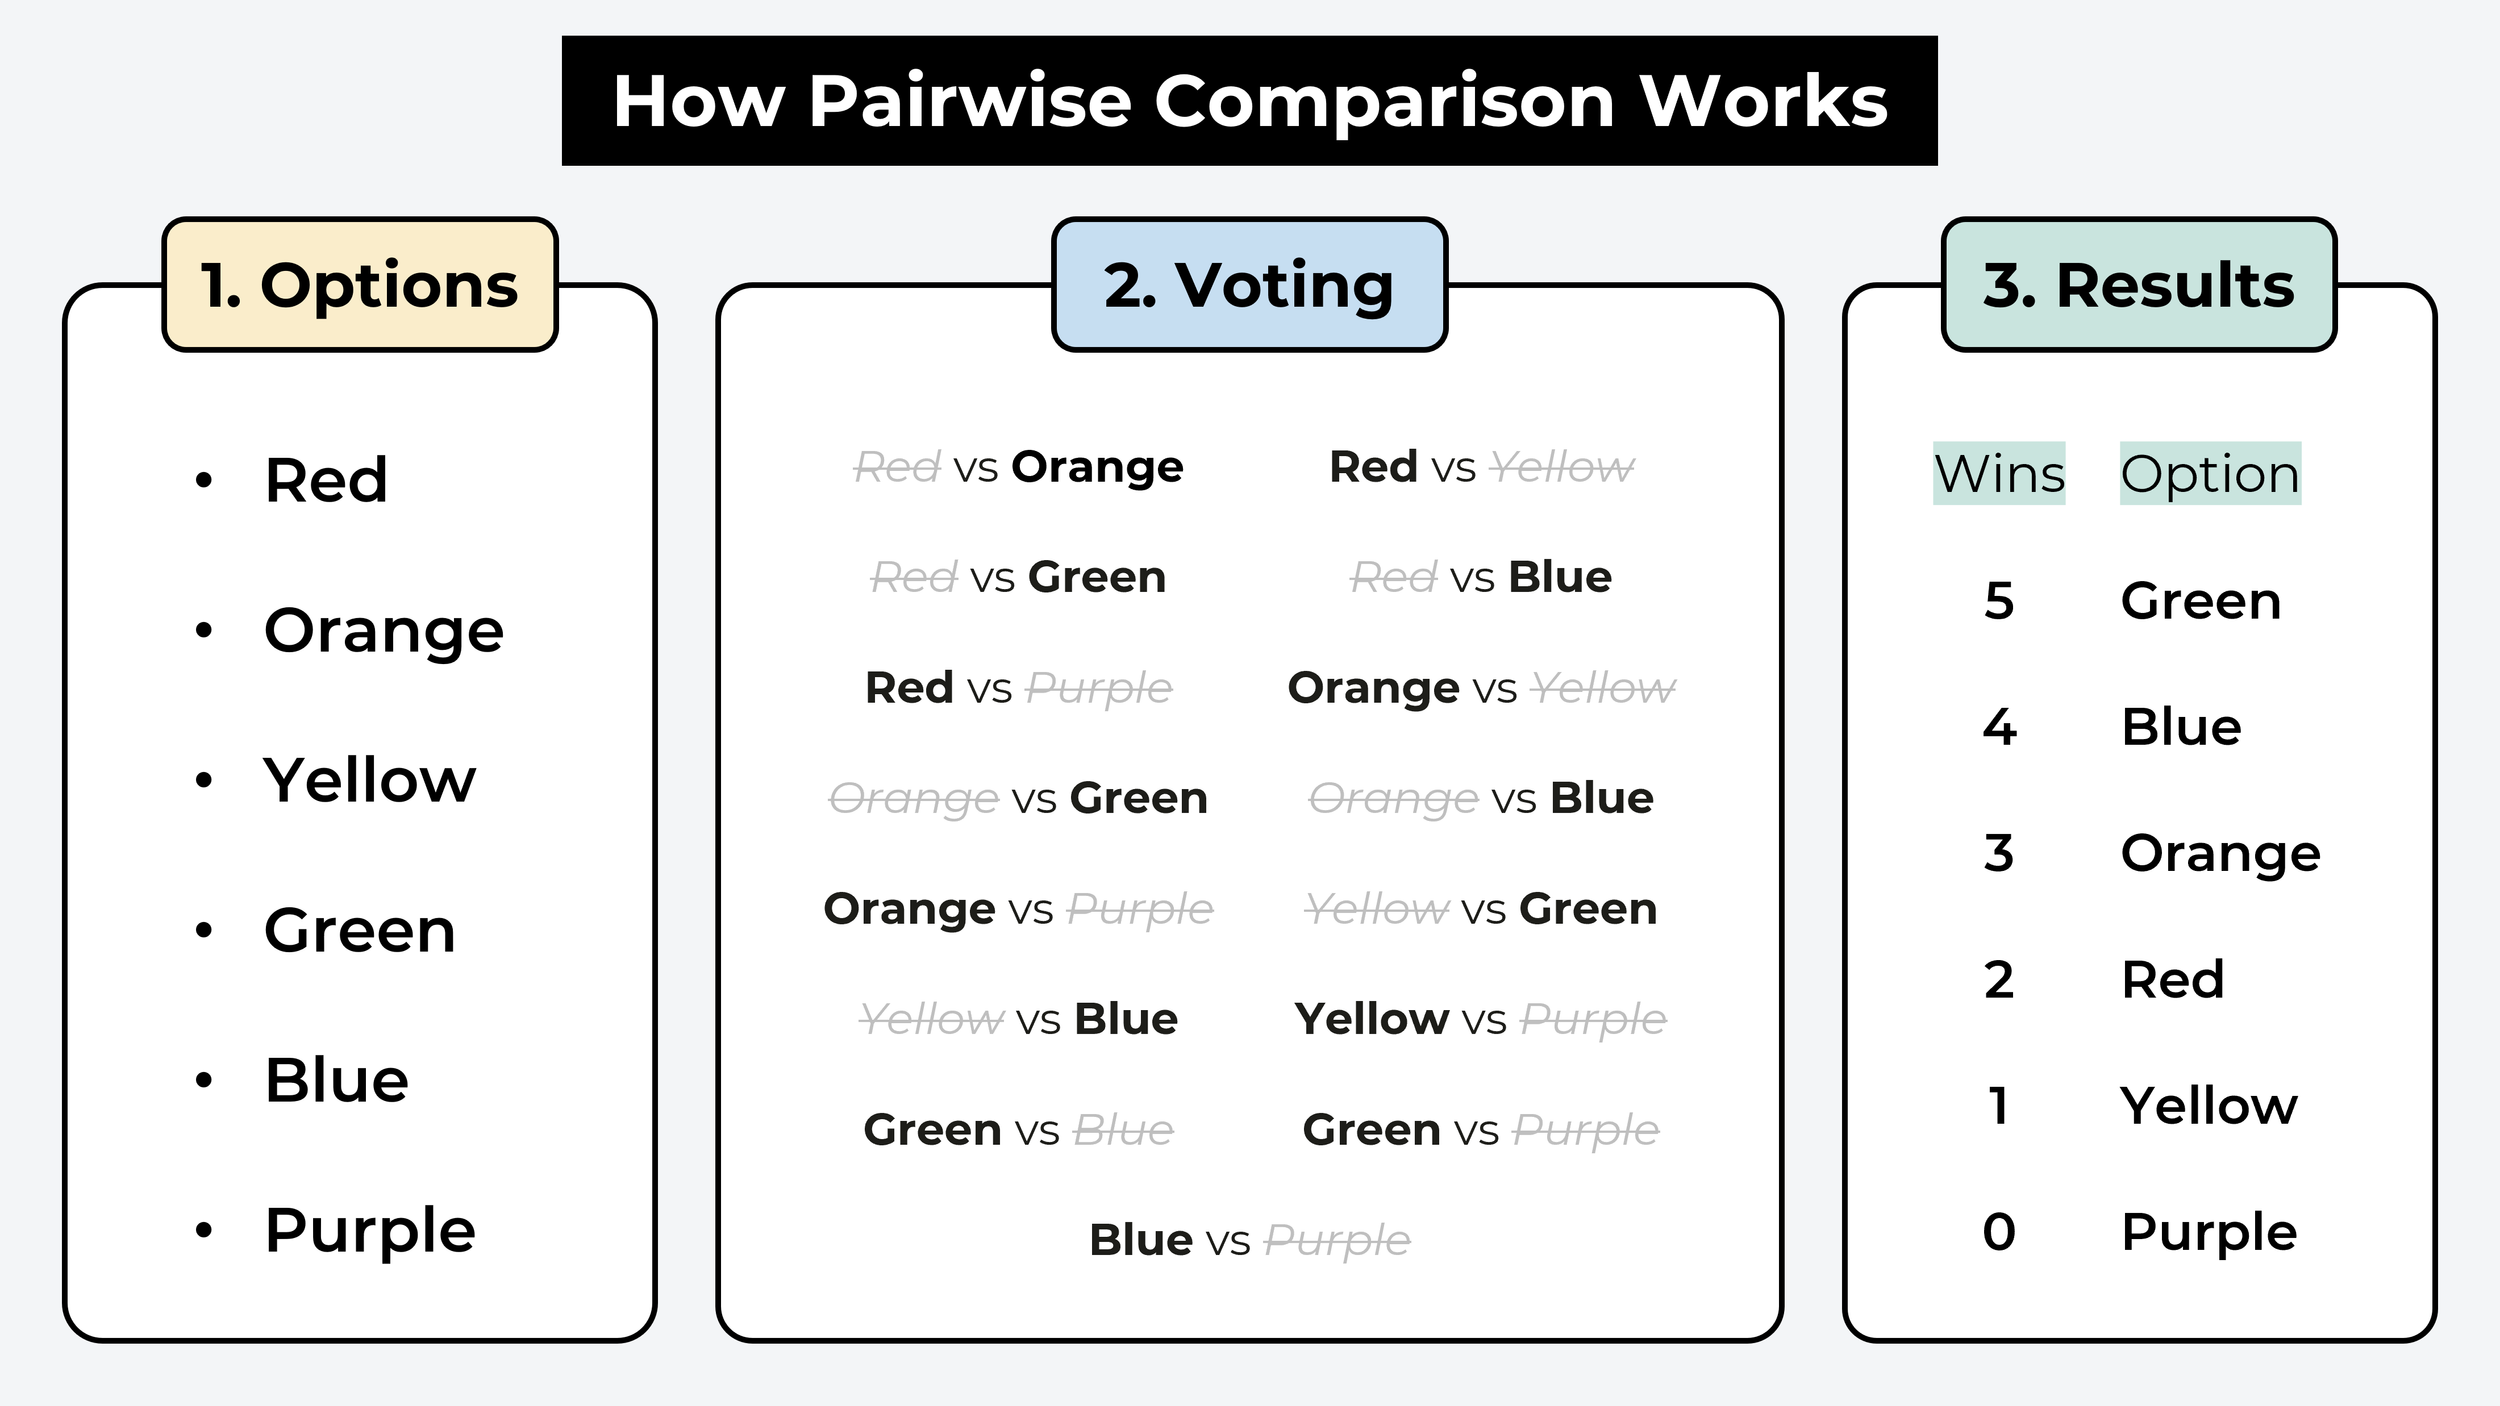
1. Win Rate
Win Rate is the most common way to calculate pairwise comparison results. It simply calculates how often an option won out of all pairs it appeared in, which it displays as a percentage or a simple 0-100 number. For example, if an option appeared in 10 pair votes and “won” 8 of them, its win rate would be 80%, so the score would be “80”. The win rate can also be interpreted as the likelihood of an option winning if compared against any other randomly selected option from the same set.

^ Example of pairwise comparison voting and results (via OpinionX). The results screen shows the Win Rate number under the “Score” column.
2. Probabilistic
Probabilistic scoring methods use Bayesian algorithms to analyze voting patterns in pairwise comparison results and predict the option’s score relative importance compared to a baseline starting point. The best-known probabilistic algorithm for pairwise comparison is ELO, which is famous for its use in scoring competitive chess players. Typically, probabilistic models start with a baseline score of 1500, which increases or decreases based on the outcome of each pairwise comparison. Other (more complex) probabilistic methods include Glicko and TrueSkill, which are best known for their use in multiplayer games like Halo, Counter-Strike, and Dota. This scoring format is useful in gaming where raw scores aren’t displayed to users, however, it makes it difficult to interpret pairwise comparison survey results. Here is an example section of the Glicko algorithm:

^ Screenshot of part of the Glicko algorithm. The formula shown has since been updated (Glicko-2) to include an additional variable for outcome volatility.
3. Manual
It’s possible to track pairwise comparison votes in a manual table if two conditions are met: there will only be one person who votes, and there is only a small set of options to vote on. The Pairwise Comparison Matrix is a table that shows your list of options along both the header row and column. To make comparisons, you start on a row and compare that option against each of the columns. The row gets a 1 if it wins and a 0 if it loses against the column.
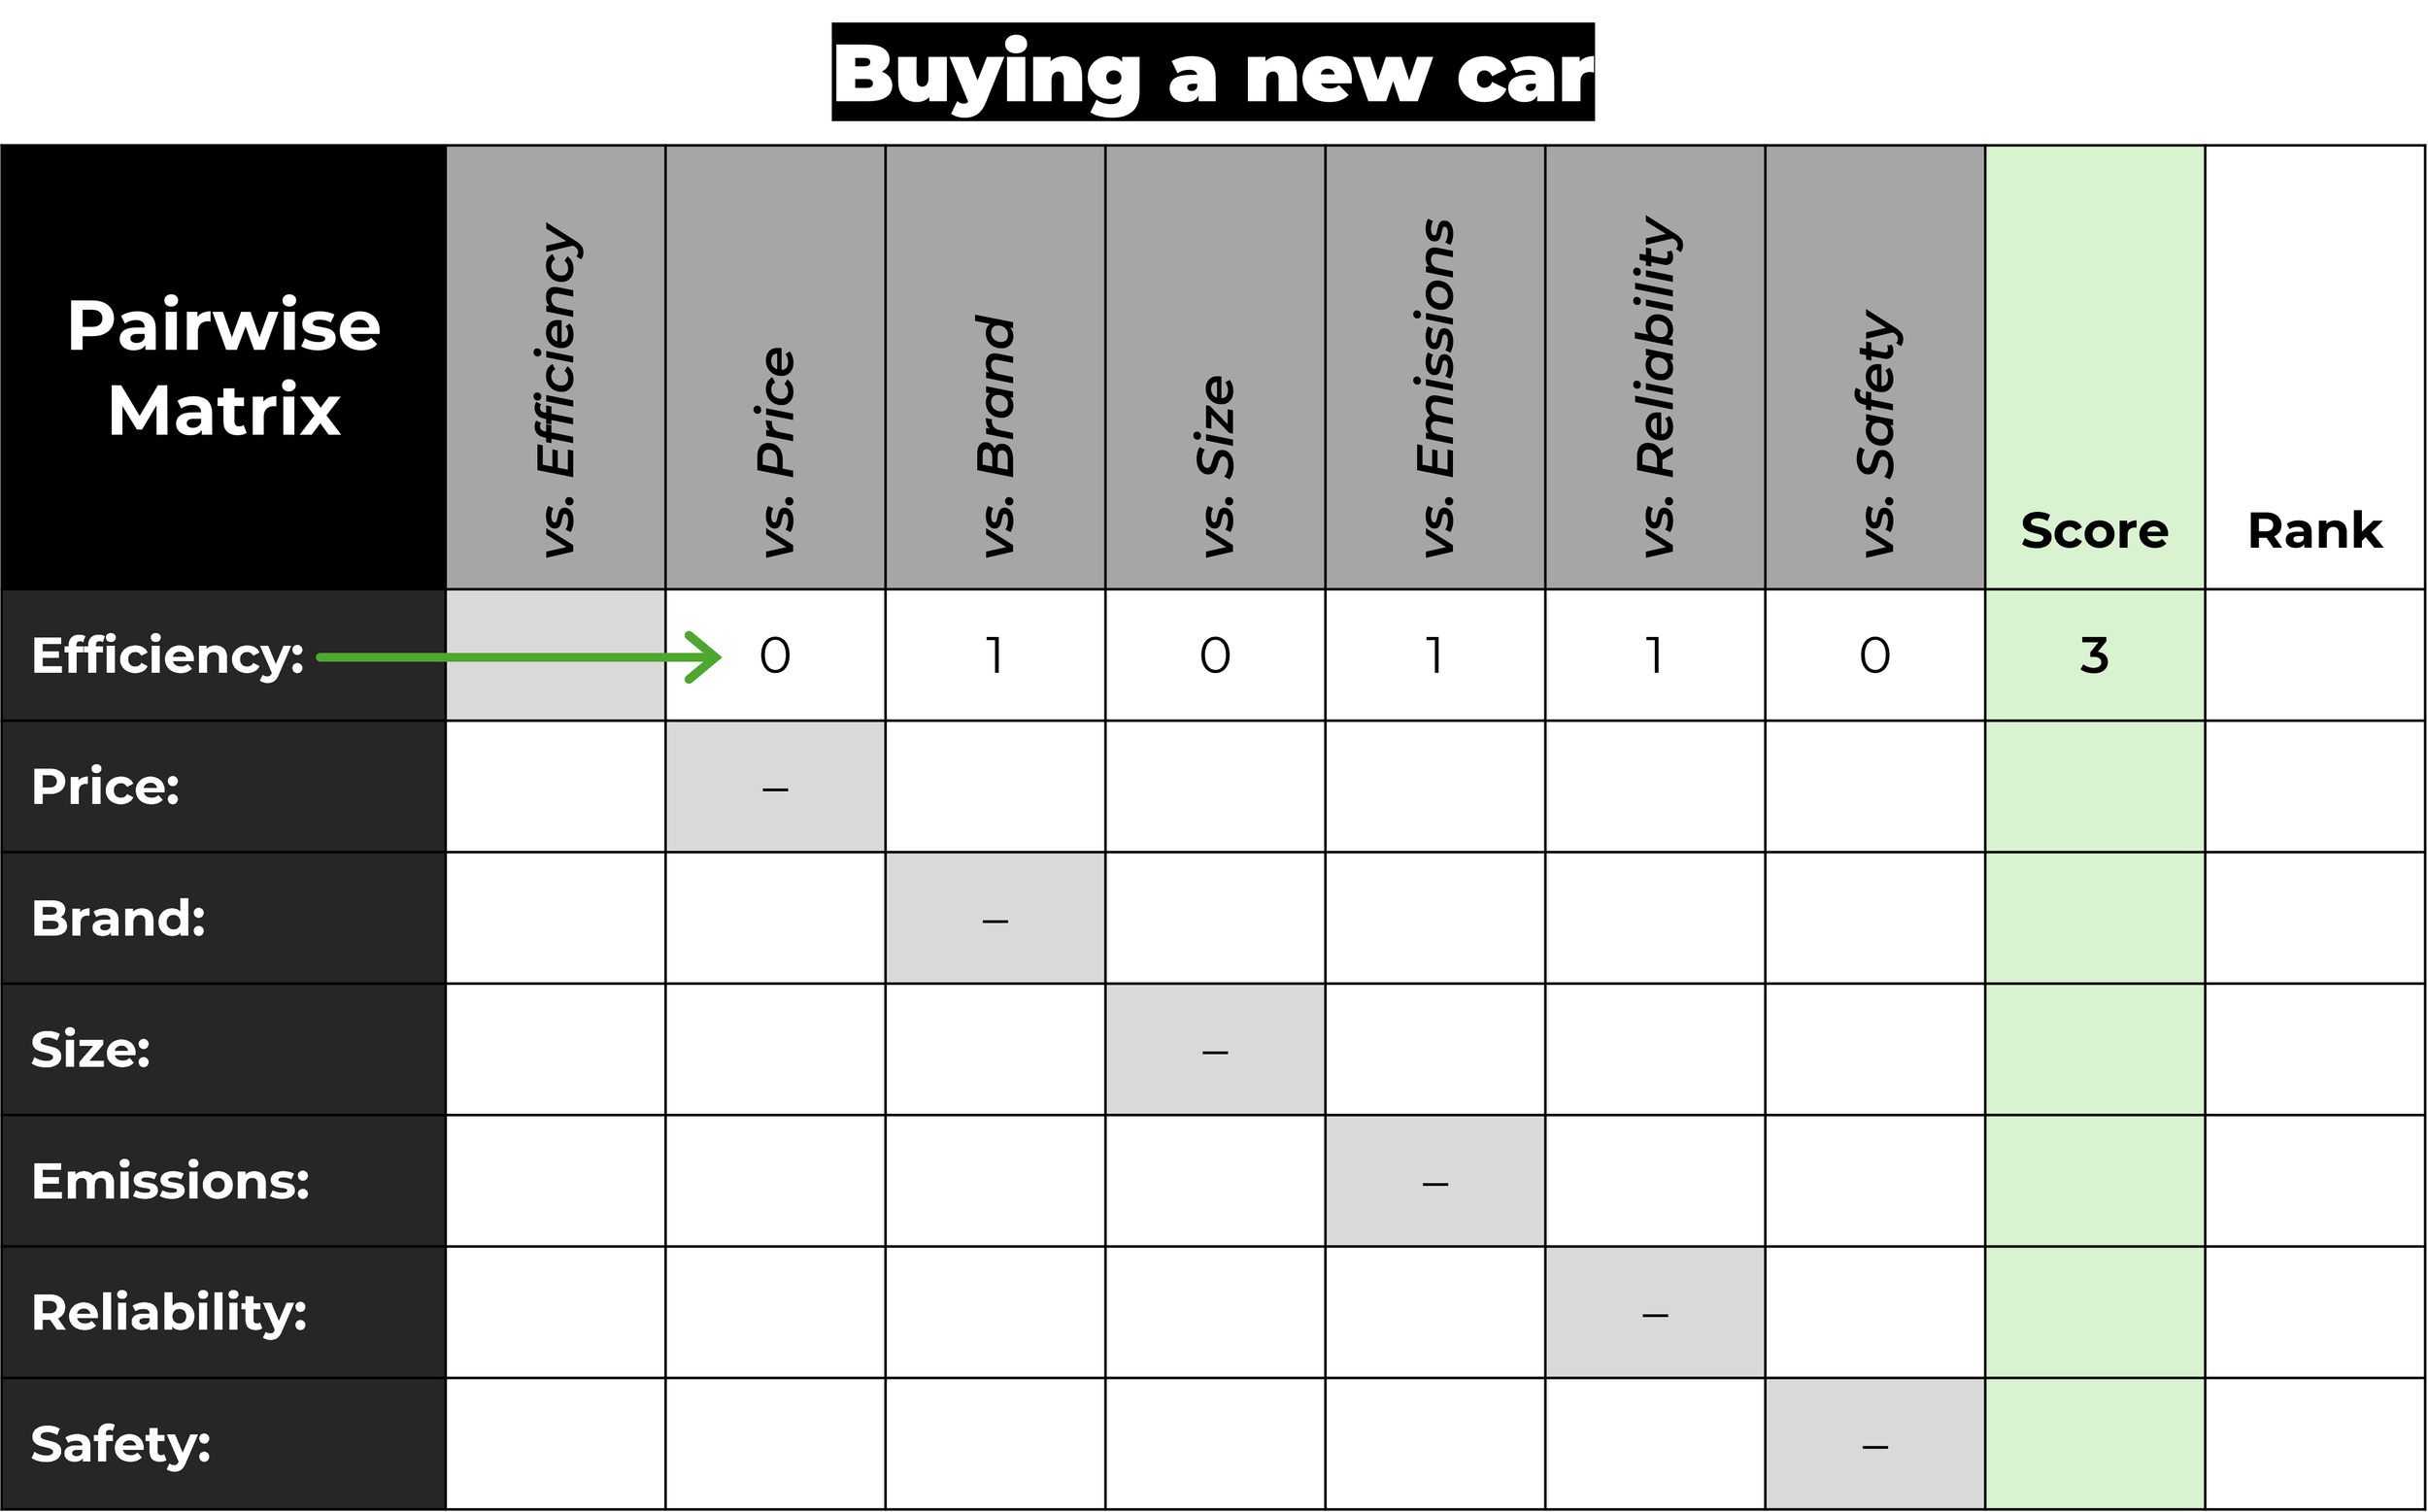
Once all comparisons have been made and the table has been completed, the options can be ranked from highest to lowest score. Some versions of the Pairwise Matrix give 0.5 to both options in the case of a tie. Pairwise Matrices generally follow the principle of “transitivity”, which means that if I prefer option A more than B and I also prefer B more than C, then it can be assumed that I prefer A more than C.

— — —
Of the three methods shown, Win Rate is the most widely used pairwise comparison calculation method for surveys/research, as it is easy to interpret while still being mathematical robust. Complex probabilistic methods tend to be used in gaming applications, while the Manual matrix is only really used in school math questions.
— — —
What are the best survey tools for Pairwise Comparison?

1. OpinionX
OpinionX is a free tool for running ranking surveys. It is used by over 10,000 companies including teams at LinkedIn, Disney and Google. OpinionX offers a range of ranking formats including Pairwise Comparison. “Pair Rank” questions on OpinionX use the Win Rate scoring method and allow you to customize your question with settings for forced ranking or a custom number of pair votes per participant.
The free version of OpinionX lets you create unlimited surveys, with any question type (including text and image versions of pairwise comparison), and unlimited ranking options. Your entire team can work from a shared OpinionX workspace where you can collaborate on setting up or analyzing your survey at no cost per teammate.
Check out the example below of a Pairwise Comparison survey hosted on OpinionX. It includes both image and text-based pairwise comparison questions. Once you’ve voted on 10 pairs, click the button that appears to see the overall results for everyone who has completed the survey (no login required).
The best part about OpinionX isn’t even the generous free tier or unlimited collaboration — it’s that it comes with a bunch of analysis features that are purpose-built for ranked results, helping you answer questions like:
How do my results change if I only include respondents from the United States?
→ In one click, filter the results to include votes cast only from a specific group of participants.
How are the ranked results different for Europeans vs Americans?
→ Compare the results of any two segments side-by-side.
How do I find someone who cares about this specific problem?
→ View the ranked results for any individual person.
What kind of people voted this specific option the highest?
→ See the results for all participant segments in one simple table to find your key group.
OpinionX is the number one tool for Pairwise Comparison. It is used by over 10,000 teams from companies like Disney, Google and LinkedIn. It comes with all the features you need for running online surveys and offers unlimited seats for teams at no extra cost per person. Give it a try yourself and create a free Pairwise Comparison survey today at app.opinionx.co.
— — —
2. PickedShares
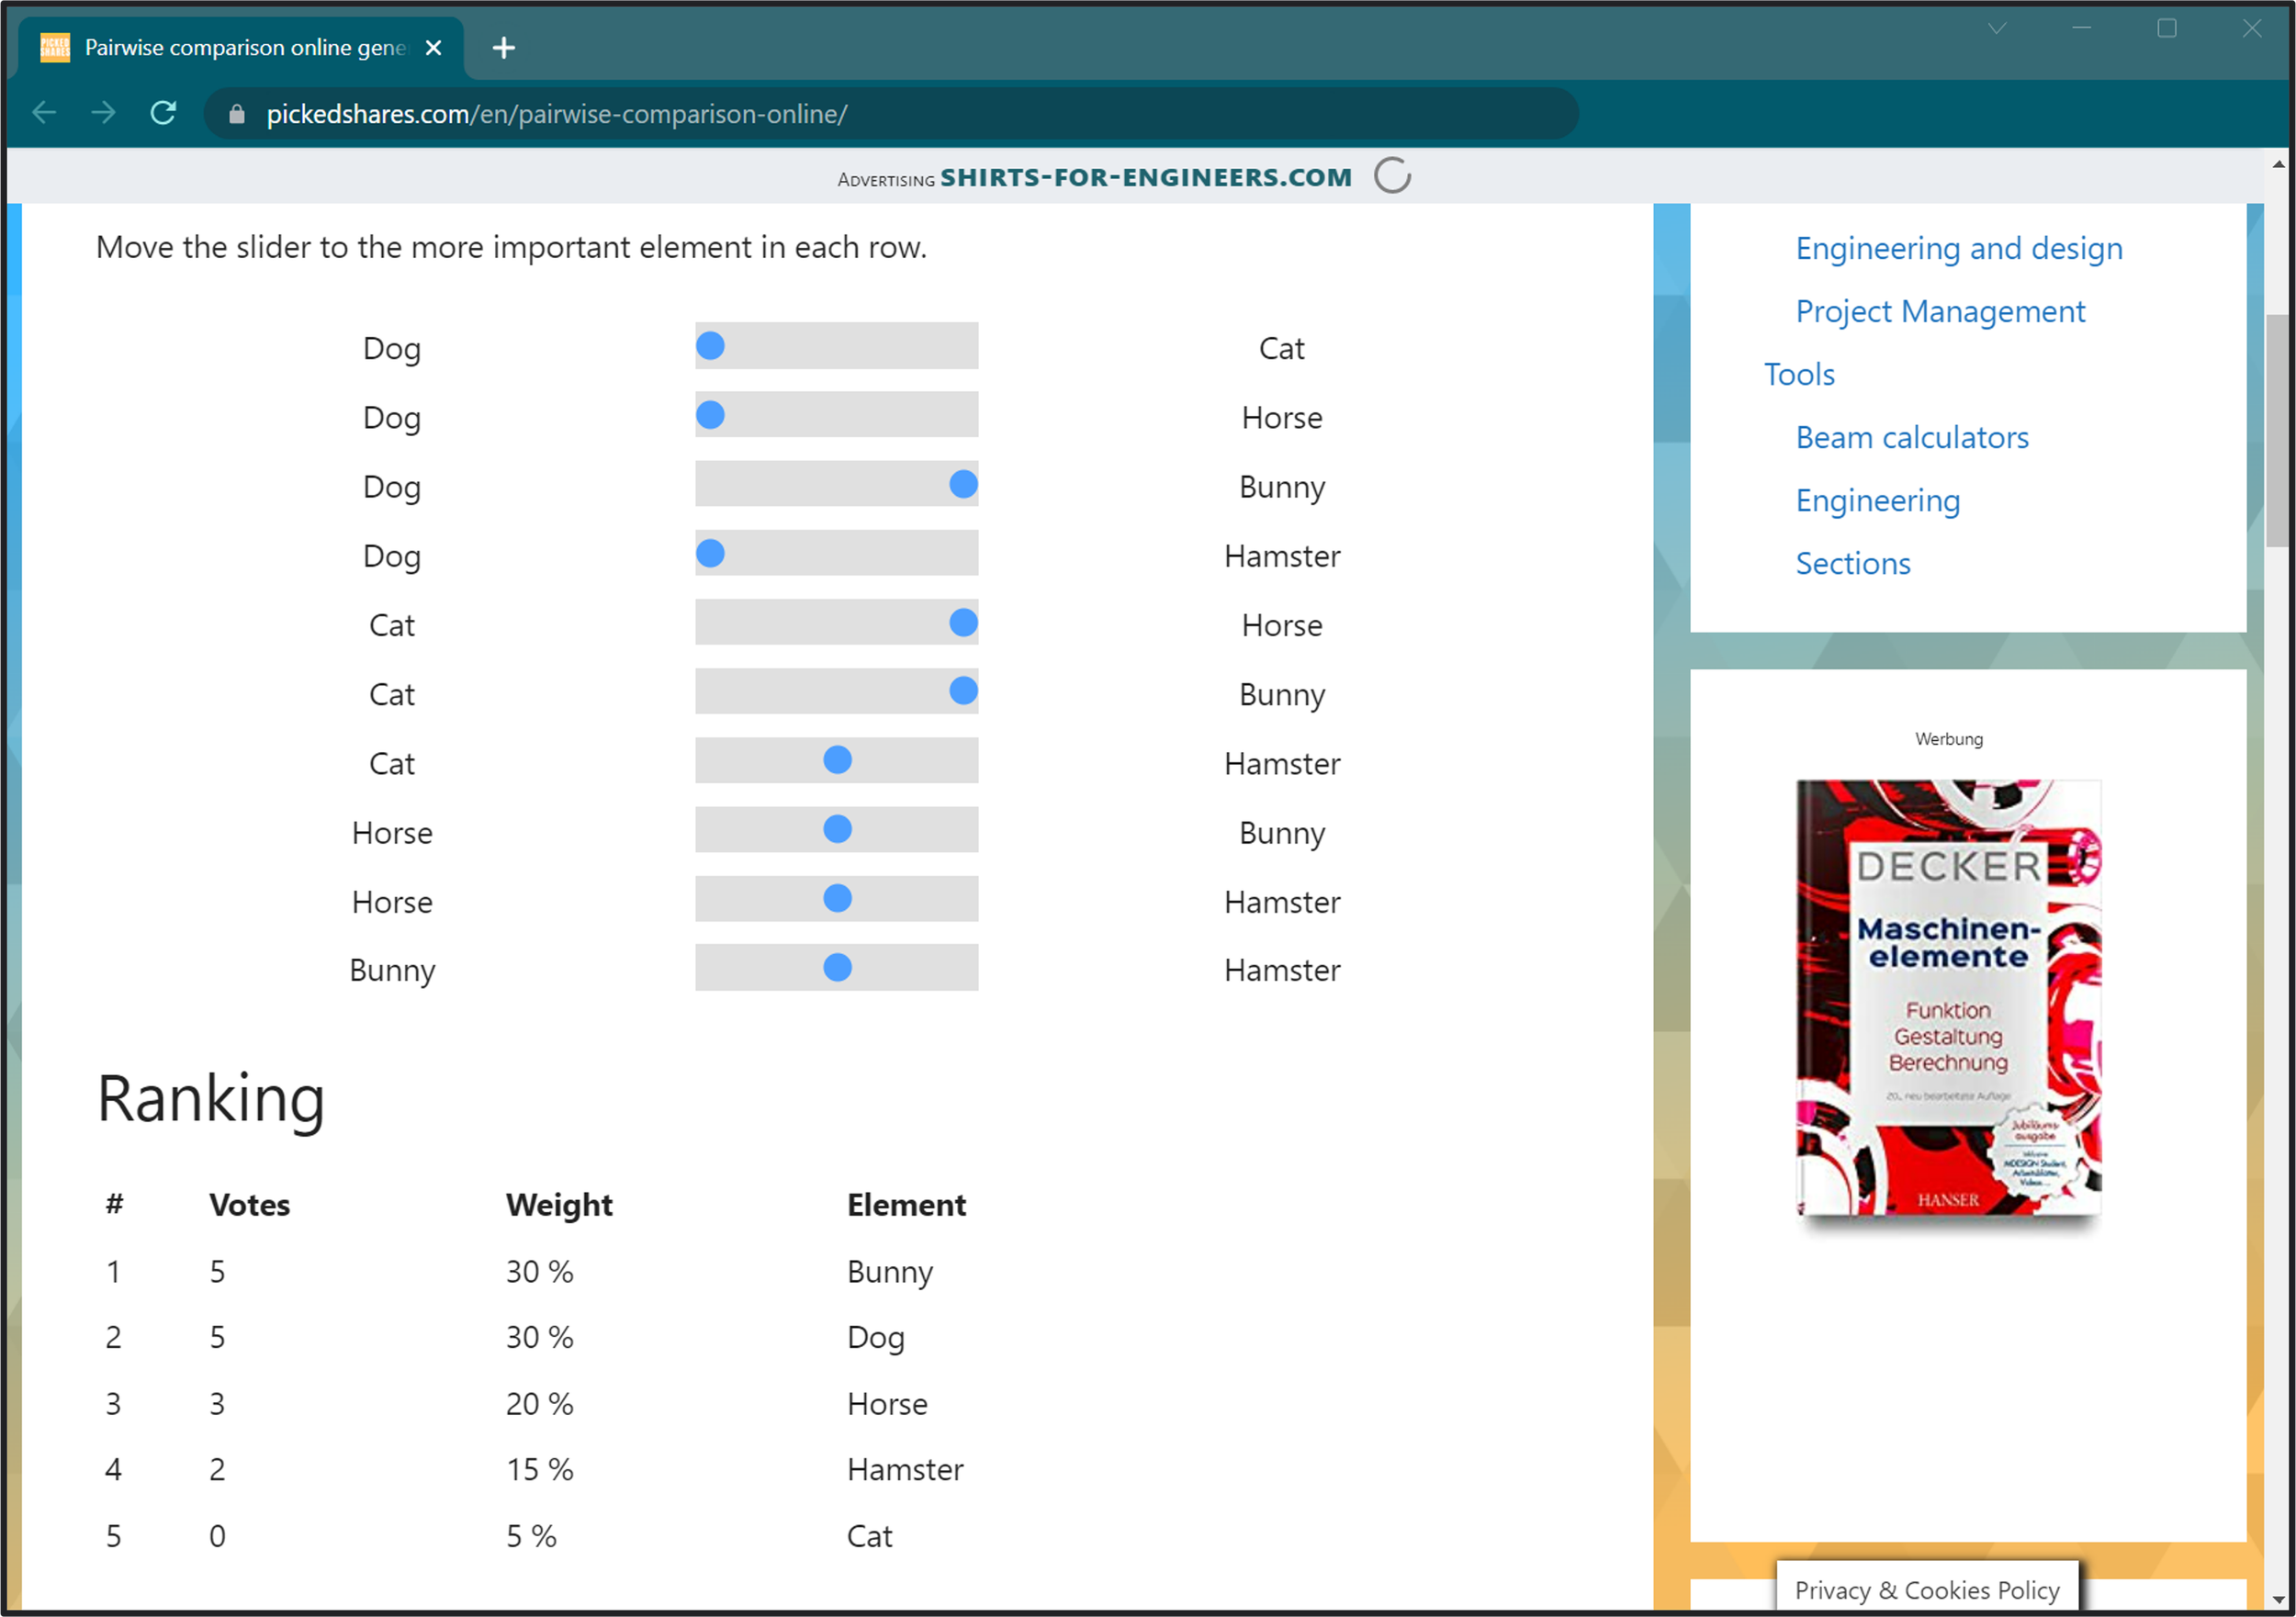
PickedShares is an online library of tools, frameworks and project management advice for mechanical engineers. It offers a free pairwise comparison tool that displays all possible pair combinations on a single page along with interactive visual toggles that allow you to cast your votes.
As you can see in the screenshot above, Pairwise Comparison on PickedShares is only designed for you to rank your own priorities. It does not facilitate voting from multiple respondents. The voting is visually easy to understand and very quick to complete given how everything is shown on one page. It is essentially just automating the Manual method described earlier in this post. One downside of PickedShares is that the webpage contains many advertisements, which can be a little distracting when you’re trying to vote.
— — —

3. PollUnit
PollUnit is an online poll maker that offers a pairwise comparison format. The free tier allows you to have up to 20 options per poll and engage up to 40 participants. The survey design is quite outdated, as you can see in the screenshot above (unless you’re a fan of quirky animated backgrounds with shooting stars or moving fireflies, in which case this is perfect for you!). Paid plans range from €8 to €72 per month depending on the functionality you require. The company also plants trees for each purchase made.
— — —

4. AllOurIdeas
AllOurIdeas is a free open-source tool for running pairwise comparison wikisurveys — ie. surveys where the options that participants vote on are added by the participants themselves. This is also available on OpinionX, which has features for adding new participant-submitted options to the ranking list mid-survey.
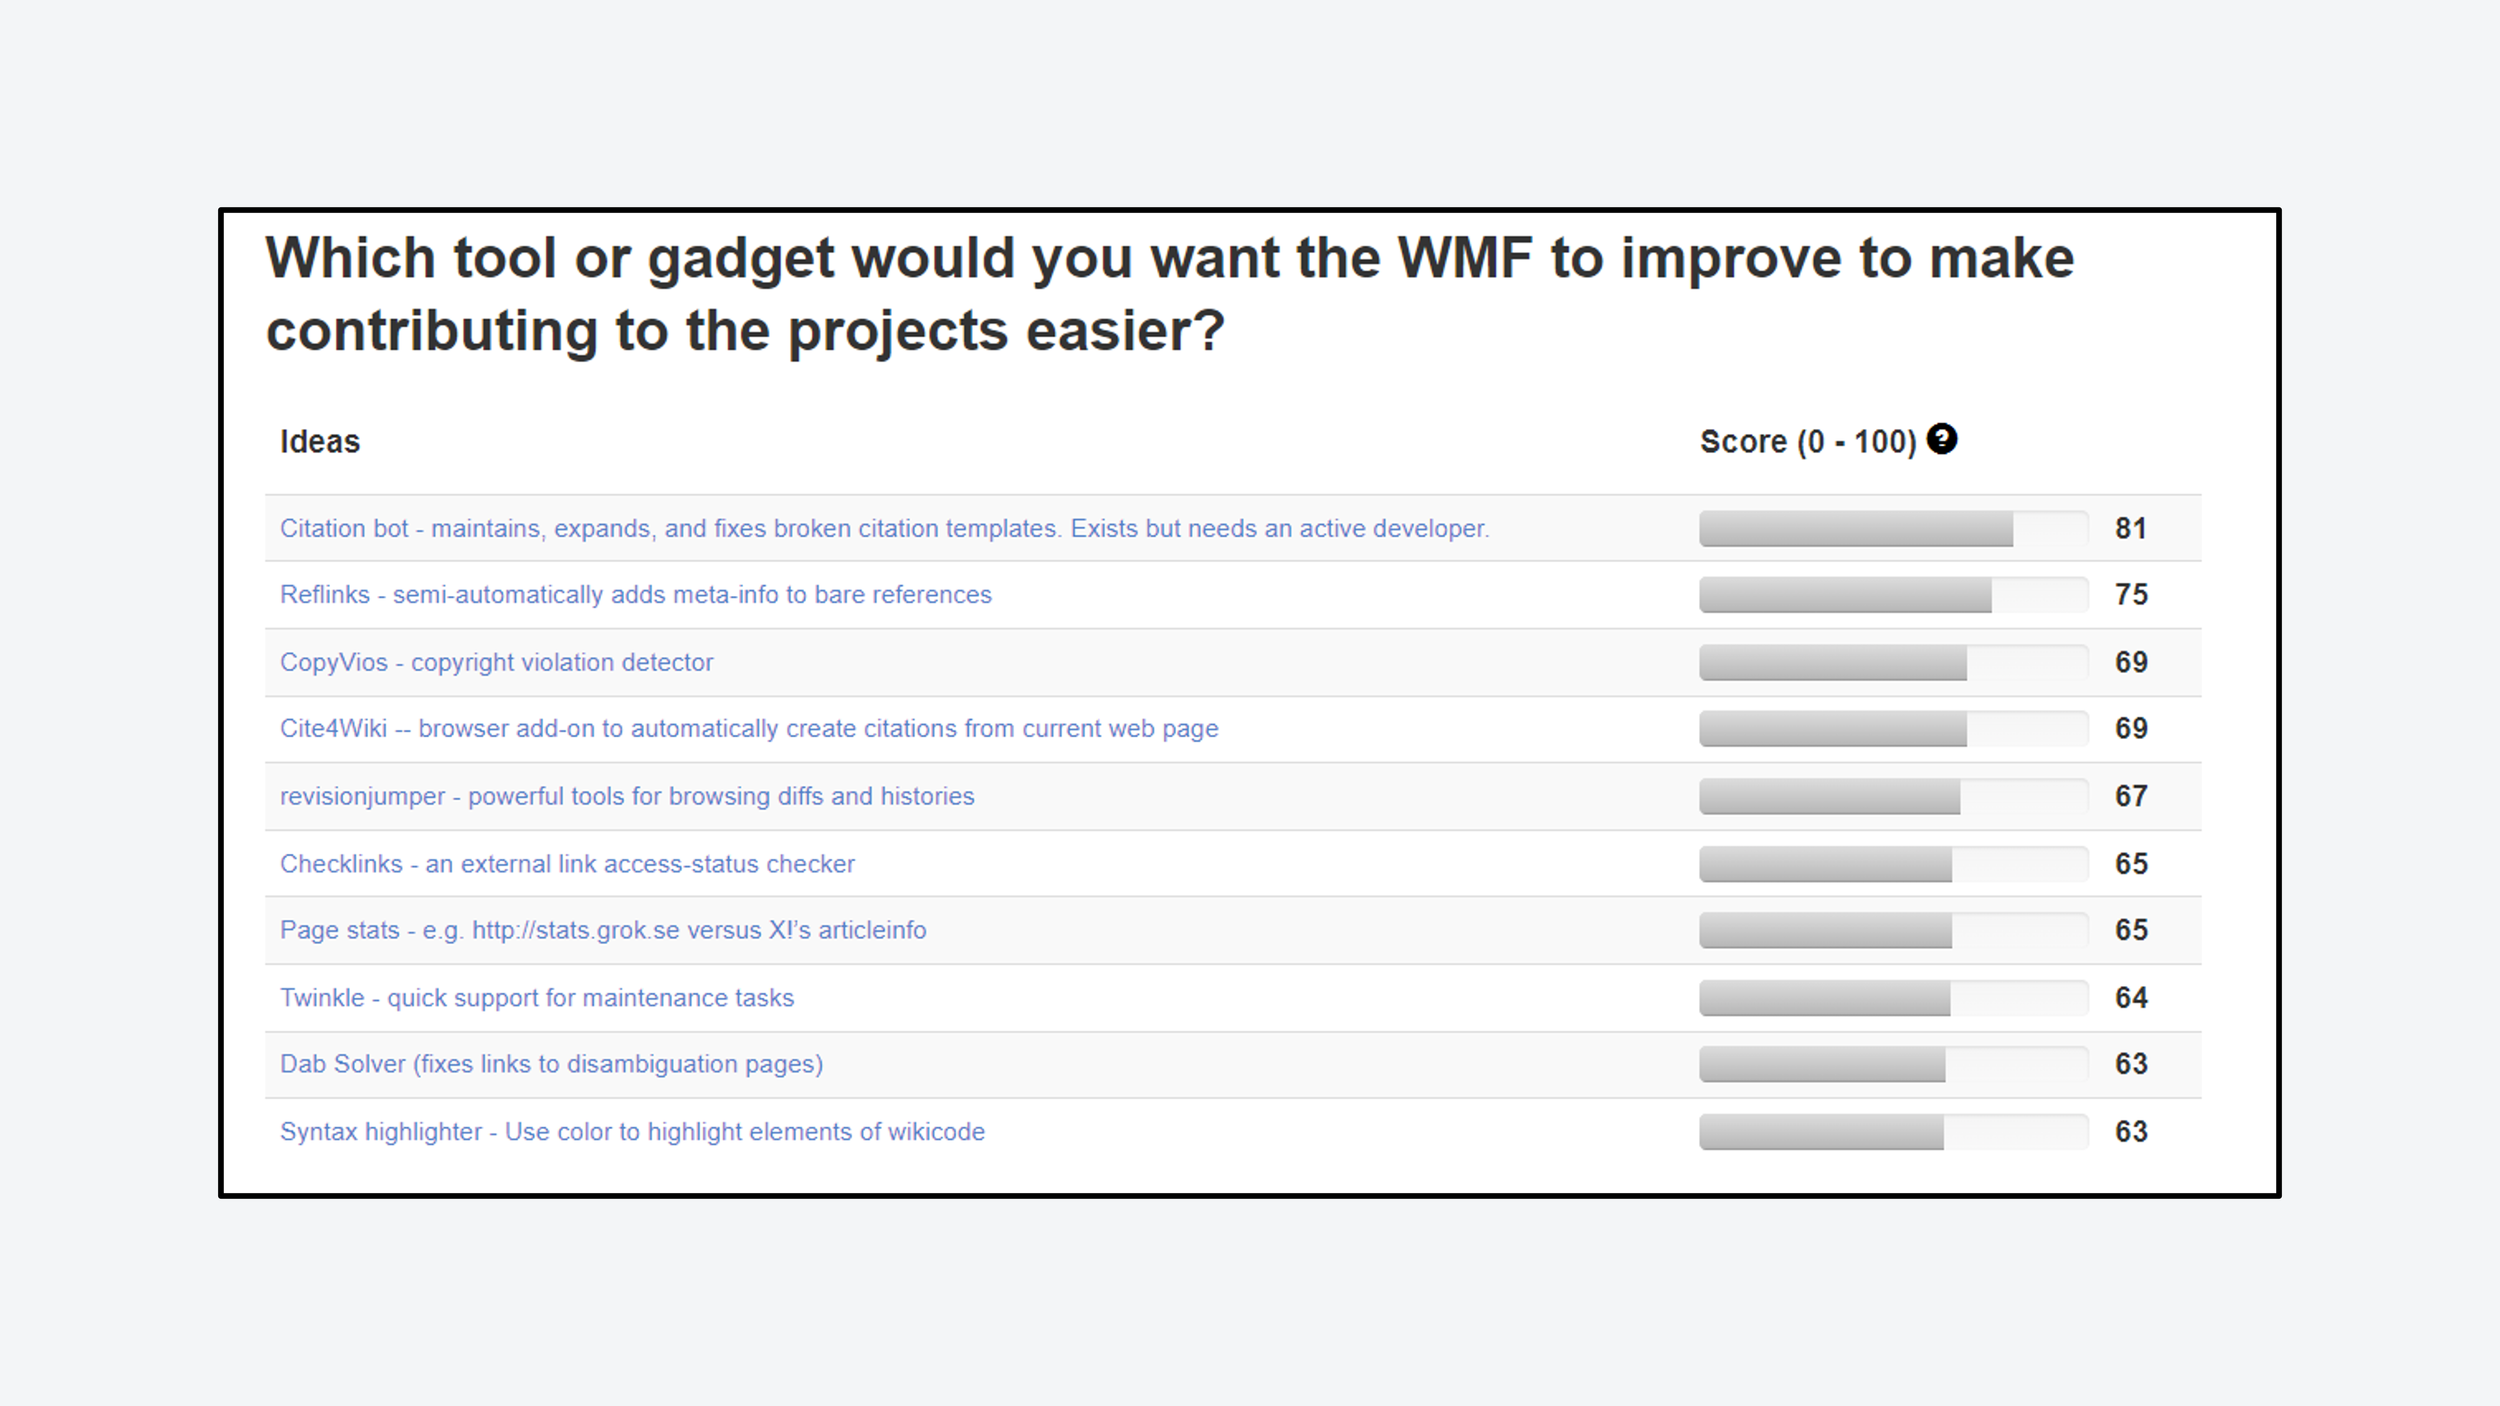
While AllOurIdeas is free to use, the team stopped maintaining it a few years ago and some features no longer work. The results are shown as a simple ranked list (as in the screenshot above), there are no analysis features or export options available.
— — —

5. 1000minds
1000minds is a decision-making tool that was created in 2002 for academics and governments that require a bespoke decision-insights platform. 1000minds is based on a voting format called Multi-Criteria Decision Making (MCDM), which is like an advanced version of pairwise comparison. Voting on 1000minds is analyzed using a proprietary analysis method called PAPRIKA, which maps the relative importance of variable co-dependencies and overall priorities. As PAPRIKA is patented, it is not a publicly available algorithm that you can dig into to understand how it works, however, you can find more details on the data science behind PAPRIKA here.
1000minds does not publicly list their prices. The company charges customers an annual license fee which they will determine specifically for you “that is proportional to your application and circumstances,” so you have to set up a call with their sales team to discuss your project before you can get a pricing quote. The product offers a limited free trial for an unspecified period of time — my trial lasted 21 days before I lost access to my projects, however, I’m not sure if it’s 21 days for everyone or if that was based on the information I gave during onboarding.
Overall, 1000minds is a solid tool for experienced professional researchers looking for an advanced multi-criteria decision-making tool. Others with less experience will likely find it difficult to navigate or understand without availing of support.
— — —

6. Pairwise-Ranking-App
This open-source tool is similar to PickedShares in that it is for a single respondent only, however, it uses more of a survey-style design for casting votes on a single head-to-head pair at a time. Unlike the other tools in this list, the results page shows a breakdown of wins and losses rather than an overall score.
— — —
Overall Best Tool?
OpinionX is the number one tool for pairwise comparison. It’s easy to use, it comes with all the analysis features you need to really understand people’s top preferences, and IT’S FREE! Create your own pairwise comparison survey in just 2 minutes at app.opinionx.co.
^ GIF via opinionx.co
Are there different types of Pairwise Comparison?
Yes! While pairwise comparison always follows the core principle of head-to-head voting, there are a couple of ways that you can customize your survey. These formats are not mutually exclusive and can be combined if needed.
i. Complete Pairwise Comparison
In a “Complete Pairwise Comparison,” each respondent is shown every possible pair from the list of options. The resulting data represents an accurate picture of this individual person’s preferences. As previously mentioned, the total number of possible pairwise comparisons can be calculated using the formula n(n-1)/2. For example, 15 options = 15(14)/2 = 105 possible pairs. Complete Pairwise Comparison is generally only used when a survey has a very limited pool of participants, when a single person is trying to rank their own preferences, or when the voting list is not too long (usually 15-20 options at most).
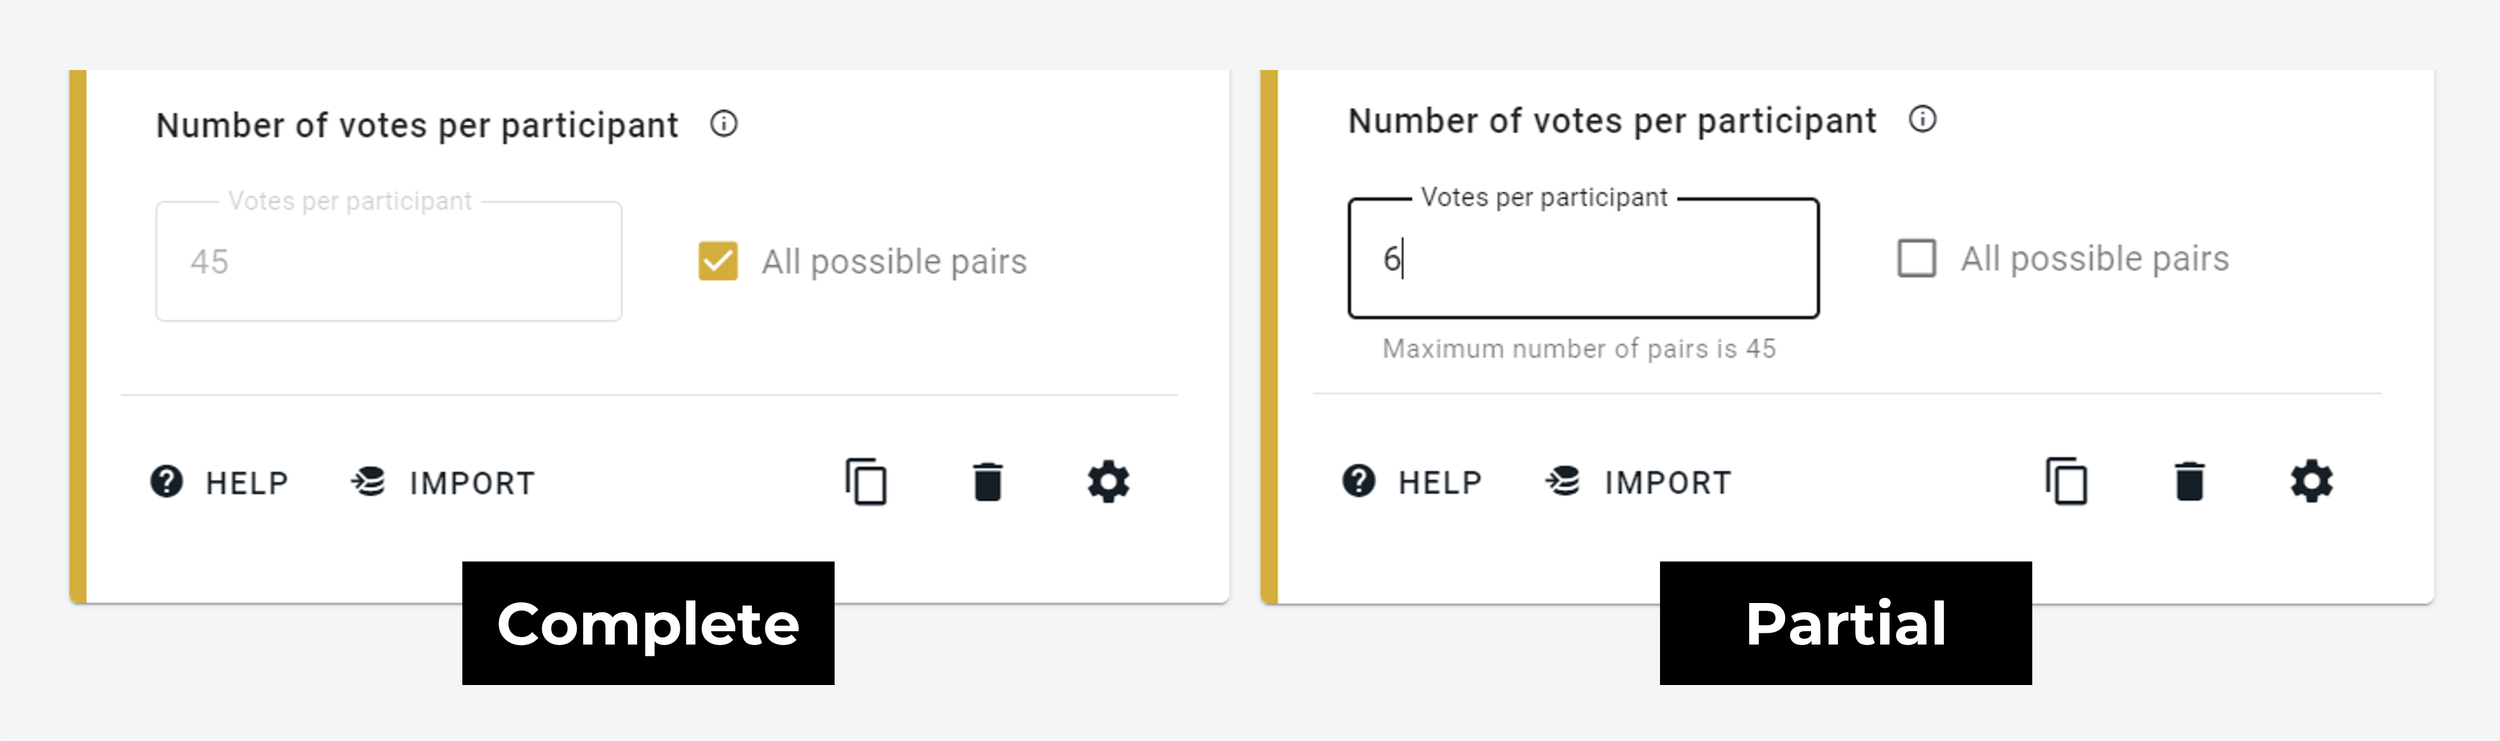
^ Configuring the number of votes on a pairwise comparison survey with 10 options (via opinionx.co)

ii. Partial Pairwise Comparison
When surveys are engaging larger groups of respondents or when there is a list of 20+ options to rank, researchers tend to use a “Partial Pairwise Comparison.” This means each participant only sees a sample of all possible pairs rather than the “complete” set. A general rule of thumb for partial pairwise comparison is to ensure that your overall dataset gets as many votes as 3x the total number of possible pairs. This can be calculated using the formula 3n(n-1)/2 and dividing the resulting number by your estimate of the minimum number of participants you expect will complete the survey. Partial Pairwise Comparison is used far more often than Complete Pairwise Comparison on OpinionX surveys.
This calculator is built into every OpinionX survey that includes a pairwise comparison question, helping you calculate a suitable number of votes to assign to each participant in a partial pairwise comparison survey.
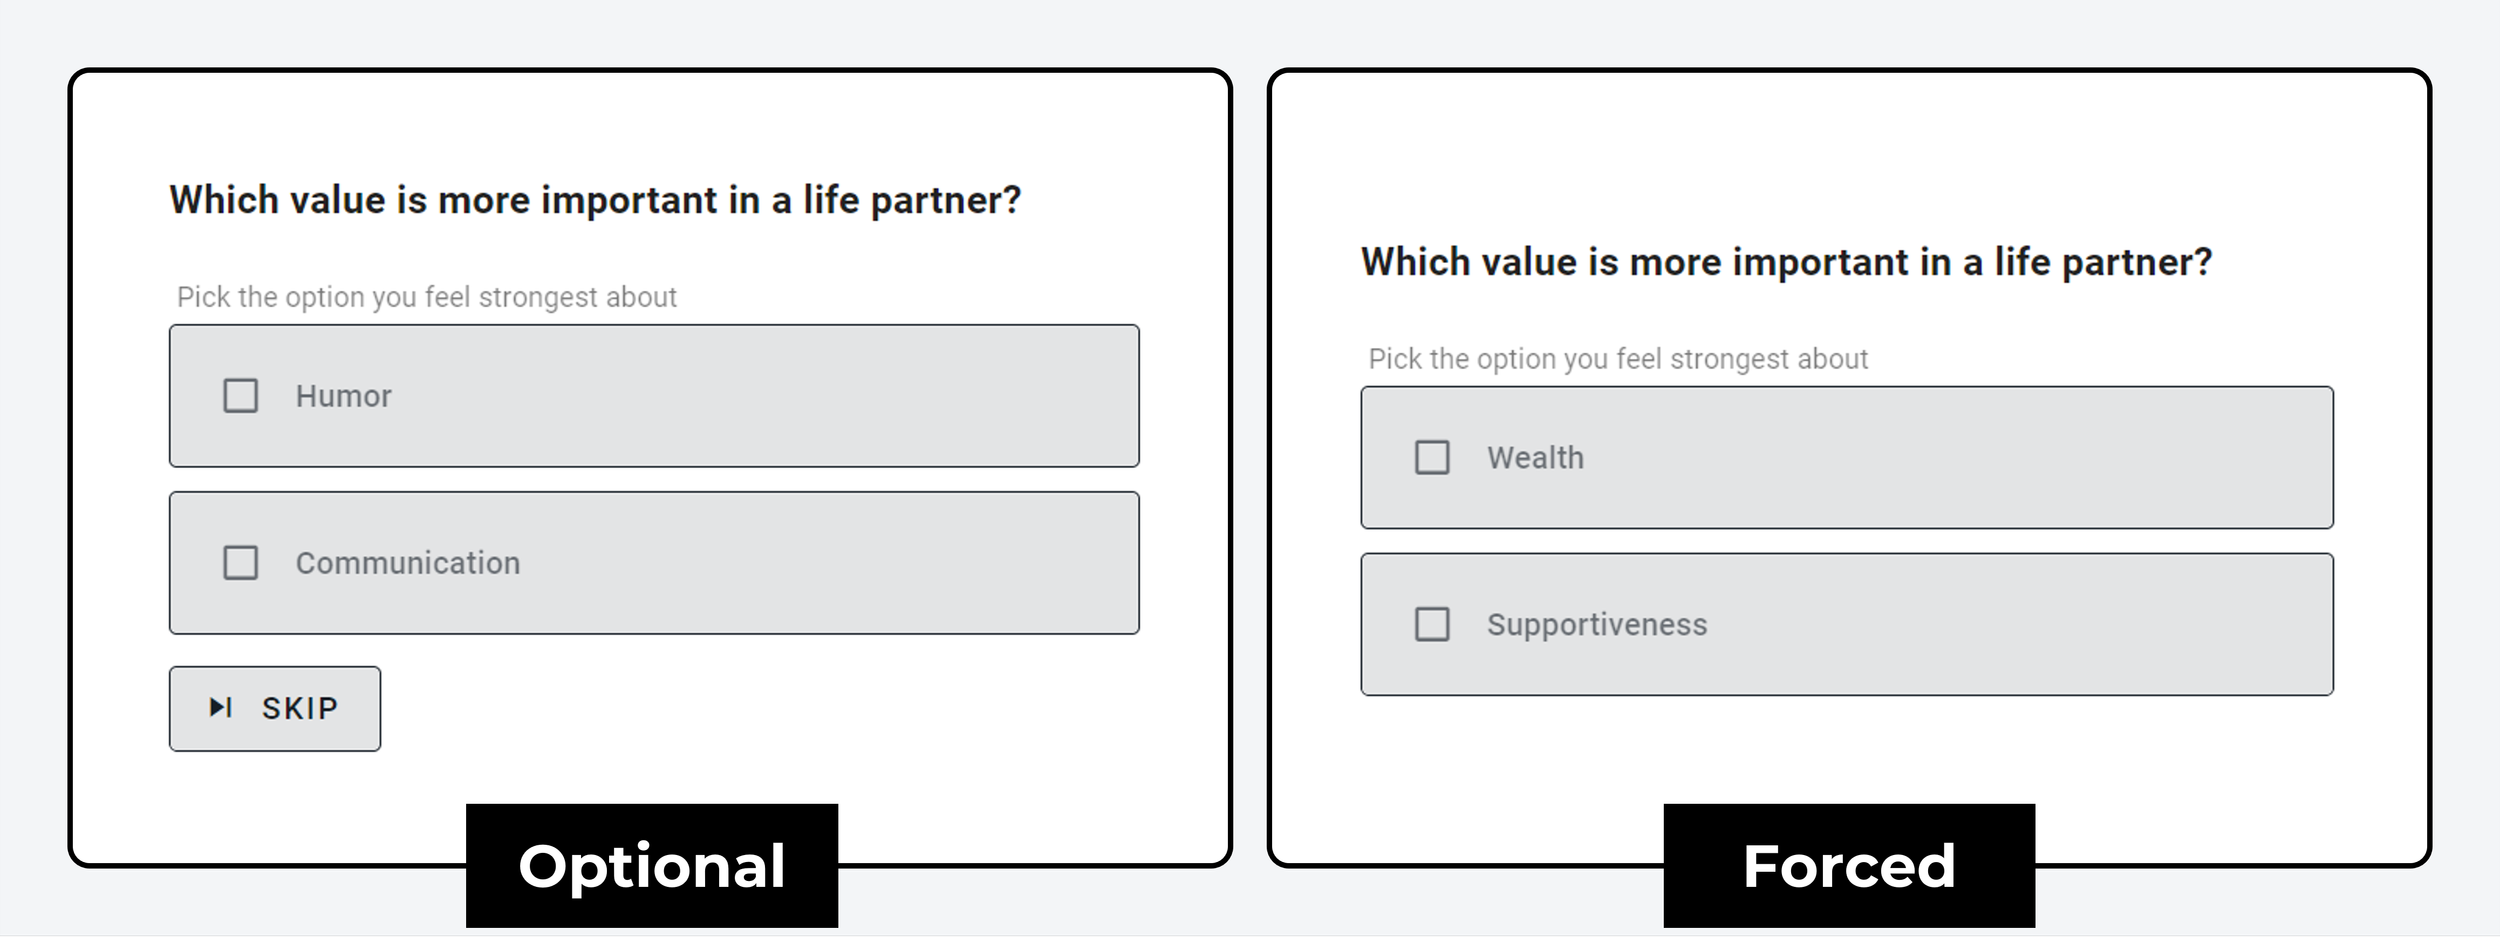
iii. Forced Pairwise Comparison
Pairwise Comparison surveys tend to show the head-to-head options alongside a third “skip” option to prevent participants from voting on irrelevant or incomparable options. However, you can force participants to complete all pair comparisons by removing the “skip” option entirely. This approach is known as Forced Pairwise Comparison.
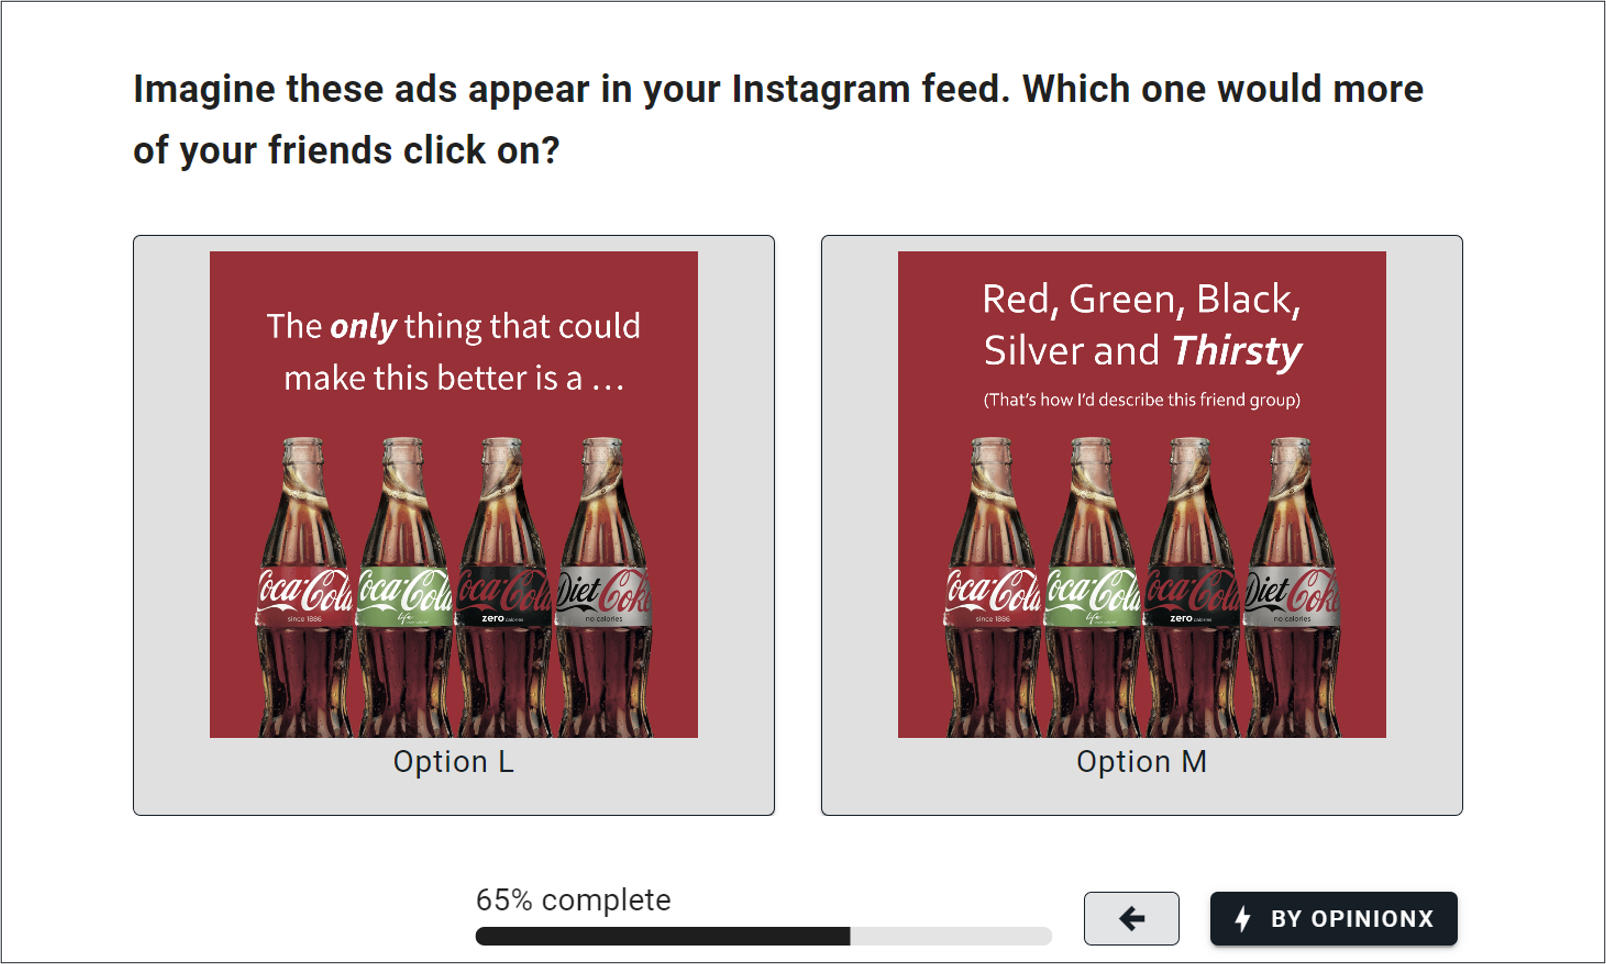
iv. Image Pairwise Comparison
Pairwise Comparison is not restricted to just text-based options — you can also include things like images or GIFs. Image Pairwise Comparison is commonly used for concept testing surveys where researchers are trying to understand people’s preferences for a set of visual options. Here’s an example of an Image Pairwise Comparison survey created on OpinionX.
v. Adaptive Pairwise Comparison
“Adaptive Pairwise Comparison” means that the survey uses what it has learned from your past votes to choose which options it should pair together for you next. This can be based on the principle of transitivity (if you have picked A>B and B>C, it will assume you prefer A>C and won’t show you this pair) or on the overall dataset of votes (ensuring that options are getting an even or prioritized spread of votes across the entire survey).
What sample size do I need for a pairwise survey? Recommended number of votes or participants?
If you set your pairwise survey to show all possible pair combinations to each survey, then you have nothing to worry about here — a “complete” pairwise comparison is as robust a representation of someone’s personal preferences as possible.
However, the majority of pairwise comparison surveys do not show each person every possible pair. This could be because there are too many options (eg. 30 options would require 435 pair votes), there are many participants (so just collecting a sample of votes from each person to calculate the overall aggregate preferences is entirely sufficient), or your participants are not financially incentivized to complete a long survey so you can’t expect them to complete 100+ pair votes.
In these “partial” pairwise comparisons, the common approach is to aim for a minimum number of votes so that every pair combination has appeared 3x within the entire survey (ie. 3n(n-1)/2). You can then divide this number by the lowest estimate of how many participants will complete your survey to figure out how many votes to ask of each person. Generally, there is no need to require anything less than 10 pair votes, which only takes 30-60 seconds to complete, but this formula can help in cases where the recommended number of pair votes is above 10.
This formula can be used in one of two ways — if you know the number of options but not the number of participants, it can help you figure out how many participants you’ll need to recruit for your survey. If you know the number of participants that will take part, it can help you figure out the maximum number of options you can include.
Examples of Pairwise Comparison used in real-life scenarios?
Pairwise Comparison is a flexible and adaptive format suitable for a wide range of use cases, from academia and governments to commercial research and quick ranking exercises. Here are a handful of examples of interesting pairwise comparison projects:
What Is The Best Thing?
YouTuber Tom Scott had a viral video in 2020 where he gathered 1.2 million votes using pairwise comparison to rank everything in the world! Tom’s experiment is a great example of partial pairwise comparison — his list was 7188 options long, meaning there were 25,830,078 possible pair combinations. But Tom correctly identifies that you don’t need every possible pair voted on because the real result is the option’s win rate (from 0-100%). Tom’s top 10 included options like “pizza”, “sleep” and “gravity”, although I won’t spoil the final result for you…
Assumption Testing
What do you do when your sales team is certain that your customers desperately want a specific new feature but you’re not sure if you agree? This was the exact scenario that Tudor Cristian Bogdan, a UX Researcher at Labster, was dealing with earlier this year. To figure this out, he ran internal workshops to gather up all the recent customer feedback and ran a pairwise comparison survey to test their hypothesis. Was solving this problem really the highest priority for customers? Nope… That problem finished didn’t even finish in the top 10! So not only did Tudor’s research prove otherwise, but it completely changed how his team thinks about testing internal assumptions.
Message Testing
We really struggled to get our first customers when we launched OpinionX, even after conducting 150+ interviews to figure out what their problems were. We gathered up all the problems that had been mentioned during these interviews, put them into a pairwise comparison survey and within two hours we could see that the problem we had been focused on was ranking dead last. But the results also showed us that our product was well suited to solve 5 of the highest-ranked problems, so we quickly changed our website messaging and had our first 4 paying customers in under a week. Here’s the full story:
Roadmap Prioritization
Safe.Global builds wallet and account infrastructure for the Ethereum blockchain. In total, they store a combined $36bn USD worth of ERC-20 tokens for customers around the world. The crypto industry by nature is participatory — people expect to vote and have a say in the development of the tools they use. To facilitate this, the Safe team uses OpinionX to run quarterly roadmap prioritization surveys where their community members use pairwise voting to help the Safe.Global team identify the right problems to solve next.
“We knew our old process wasn’t a very solid approach to say which things should be prioritized. With OpinionX, my team are a lot more confident because we can sort our whole roadmap by the problems users say are most important to them." — Kristina Mayman, UX Researcher at Safe.Global
Wikimedia Foundation Product Roadmap Survey
In 2014, the Wikimedia Foundation (the parent organization of Wikipedia) ran a roadmap prioritization survey to decide which new tools to build for the Wikimedia community. Over 30,000 votes were cast and the results shaped the future of the 7th most visited website in the world!
Chess.com
Chess.com is the world’s top chess community, used by over 150 million people to play chess against each other online. Chess.com uses a pairwise comparison format to rate players — each game is a head-to-head comparison that ends with a winner and loser (or sometimes a tie). The Glicko-2 algorithm is used to score and rank players, starting at a baseline of 1500 points and increasing/decreasing based on your ability as a player.
Idea Validation
The best tech companies are well-oiled machines when it comes to separating good ideas from bad ones. Most of the time, they keep their validation techniques top secret, but that’s not what Stripe did! Shreyas Doshi, a former product leader at Stripe, published a viral post called “Destined To Fail” where he explains the reason why most people are bad at validating their ideas. His solution? Get customers to comparatively rank their problems so that you can prove whether the problem you’re solving is high or low on that customer’s list of priorities. Check out Shreyas’ story here.

Academia and Formal Research
Pairwise comparison has a long history of use in academic settings — in fact, its use in non-academic settings like user research and executive decision-making are much more recent. Companies like Disney, Google, LinkedIn, Shopify and Amazon use OpinionX to conduct pairwise comparison surveys internally with colleagues and externally with customers. But many academics from around the world also use OpinionX to incorporate pairwise comparison into their academic research, from social impact and educational engagement to medical research.
How do I design a Pairwise Comparison survey?
Creating a pairwise comparison survey is just as easy as creating any other type of online survey. Here are two requirements and two suggestions to consider:
Comparison Question
Comparison Options
Participant Identifiers
Segmentation Data
1. Comparison Question
What lens should participants interpret the pair of options they are asked to vote on? The six most common approaches are:
🏆 Preference — which do they like most?
🤕 Pain — which is a bigger unmet need?
💰 Value — which is worth most to them?
⚠️ Risk — what concerns them most?
❤️🔥 Motivation — which is a bigger driver of action?
🚧 Friction — which is a bigger barrier to action?
Once you pick one of these lenses, then you need to pick the comparison context. For example, imagine I pick “value” and use “the customer’s experience of my product” as the context — these two easily join together to create a question like “Which of the two features below delivers more value for the money in our product?”.
2. Comparison Options
Next comes the list of options that will be used for the head-to-head comparisons. Following on from the question about ranking features based on their perceived value, my list of options should include all the features that my product offers today. Alternatively, one of the most common ways that user researchers leverage pairwise comparison is to get customers to vote on pairs of problem statements, following a format called Customer Problem Stack Ranking. You can also collect new options from participants mid-survey if you’d like to crowdsource your ranking list.
3. Participant Identifiers
You should always include a way to identify who participants are. OpinionX pairwise comparison surveys are anonymous by default, but you can include an “identifier” question to collect people’s names, emails, or usernames if you’d like. Having this kind of data is incredibly important when it comes to analyzing your results. Once you know what the top-ranked option is, you’ll likely want to know which individuals voted this as their number one so that you can interview them to understand why (ie. the Discovery Sandwich framework).
4. Segmentation Data
Ranking people’s preferences is only insightful if you’ve got a perfectly homogenous pool of participants — that is almost never the case. For most projects, the best insights come from segmenting your results to view how people’s preferences change depending on which group you look at (eg. by pricing plan, geographical region, or workplace seniority). In the video below, you can see how an option in a pairwise comparison survey is ranked last overall but has the highest score for customers on a specific subscription plan:
To plan ahead for segmentation, just include a couple of multiple-choice questions in your survey. On a survey tool like OpinionX, you can easily filter and segment your ranked results in just one click by tapping any bar chart on the results page. No advanced skills required — this kind of analysis is open to everyone regardless of whether they’re an expert researcher or segmentation newbie.
What is the history and origins of Pairwise Comparison?
Pairwise Comparison actually started out in psychology rather than data science or mathematics. In 1927, L. L. Thurstone (creator of the standardized IQ test) published a paper detailing a scientific approach to pairwise comparisons which he named “The Law of Comparative Judgment.” This paper initially described pairwise comparison as a way to compare and rank things with discernable measurements like the weights of different objects. Two years later, Thurstone released a follow-up paper titled “The Measurement of Psychological Value” which demonstrated how pairwise comparison could be used to measure subjective or intangible things like attitudes and values based on their preference or importance to people.
Thurstone’s work was quick to take off. The same year as his second paper, a German mathematician named Ernst Zermelo published a model for ranking chess players in incomplete tournaments using pairwise comparison. Zermelo’s work inspired an American academic duo who published The Bradley–Terry Model in 1952, which described a mathematical approach to pairwise comparison that went on to shape the nature of competitive sports, academic journals and even today’s machine-learning algorithms.
While the Bradley-Terry Model was starting to take off, a Hungarian physics professor named Arpad Elo was also taking inspiration from Zermelo’s work while designing a pairwise comparison method for chess ranking in the early 1960s called ELO, which went on to become the most famous pairwise algorithm ever created. The ELO algorithm has had its own share of descendants like Glicko in 1995 and TrueSkill in 2005 which continue to be used today in many of the world’s most popular video games and franchises, including Pokémon Go, Chess.com, Dota, and Counter-Strike.
Create a free Pairwise Comparison survey in just 3 minutes
There’s a reason why teams at Disney, LinkedIn, and Google use OpinionX to create, distribute and analyze their pairwise comparison surveys; it’s the number one free ranking survey tool! See for yourself why 10,000+ teams use OpinionX for their ranking projects → create a free Pairwise Comparison survey on OpinionX.