
What is Best-Worst Scaling? (Examples, Methods, Free Tools)
“Best-worst scaling ranks preferences by showing people 3 to 6 options at a time and asking which is best and which is worst. It produces continuous scores where a rating scale returns clustered ones, and it isn’t the same thing as MaxDiff, whatever most of the internet says. This guide covers the method, the scoring formula, the sample size calculation, nine tools with prices, and four alternatives.”
What is best-worst scaling?
Best-worst scaling is a survey method for ranking people's preferences by asking them multiple times to choose the best and worst option from a group of statements. Typically only 3 to 6 options are shown at a time, although you can show more than 6 if required. Each time the participant votes, a new set of statements from the overall list is shown.
The "best" and "worst" labels can be changed to suit your research occasion, such as Favourite and Least Favourite, Top and Bottom, or Most Preferred and Least Preferred.
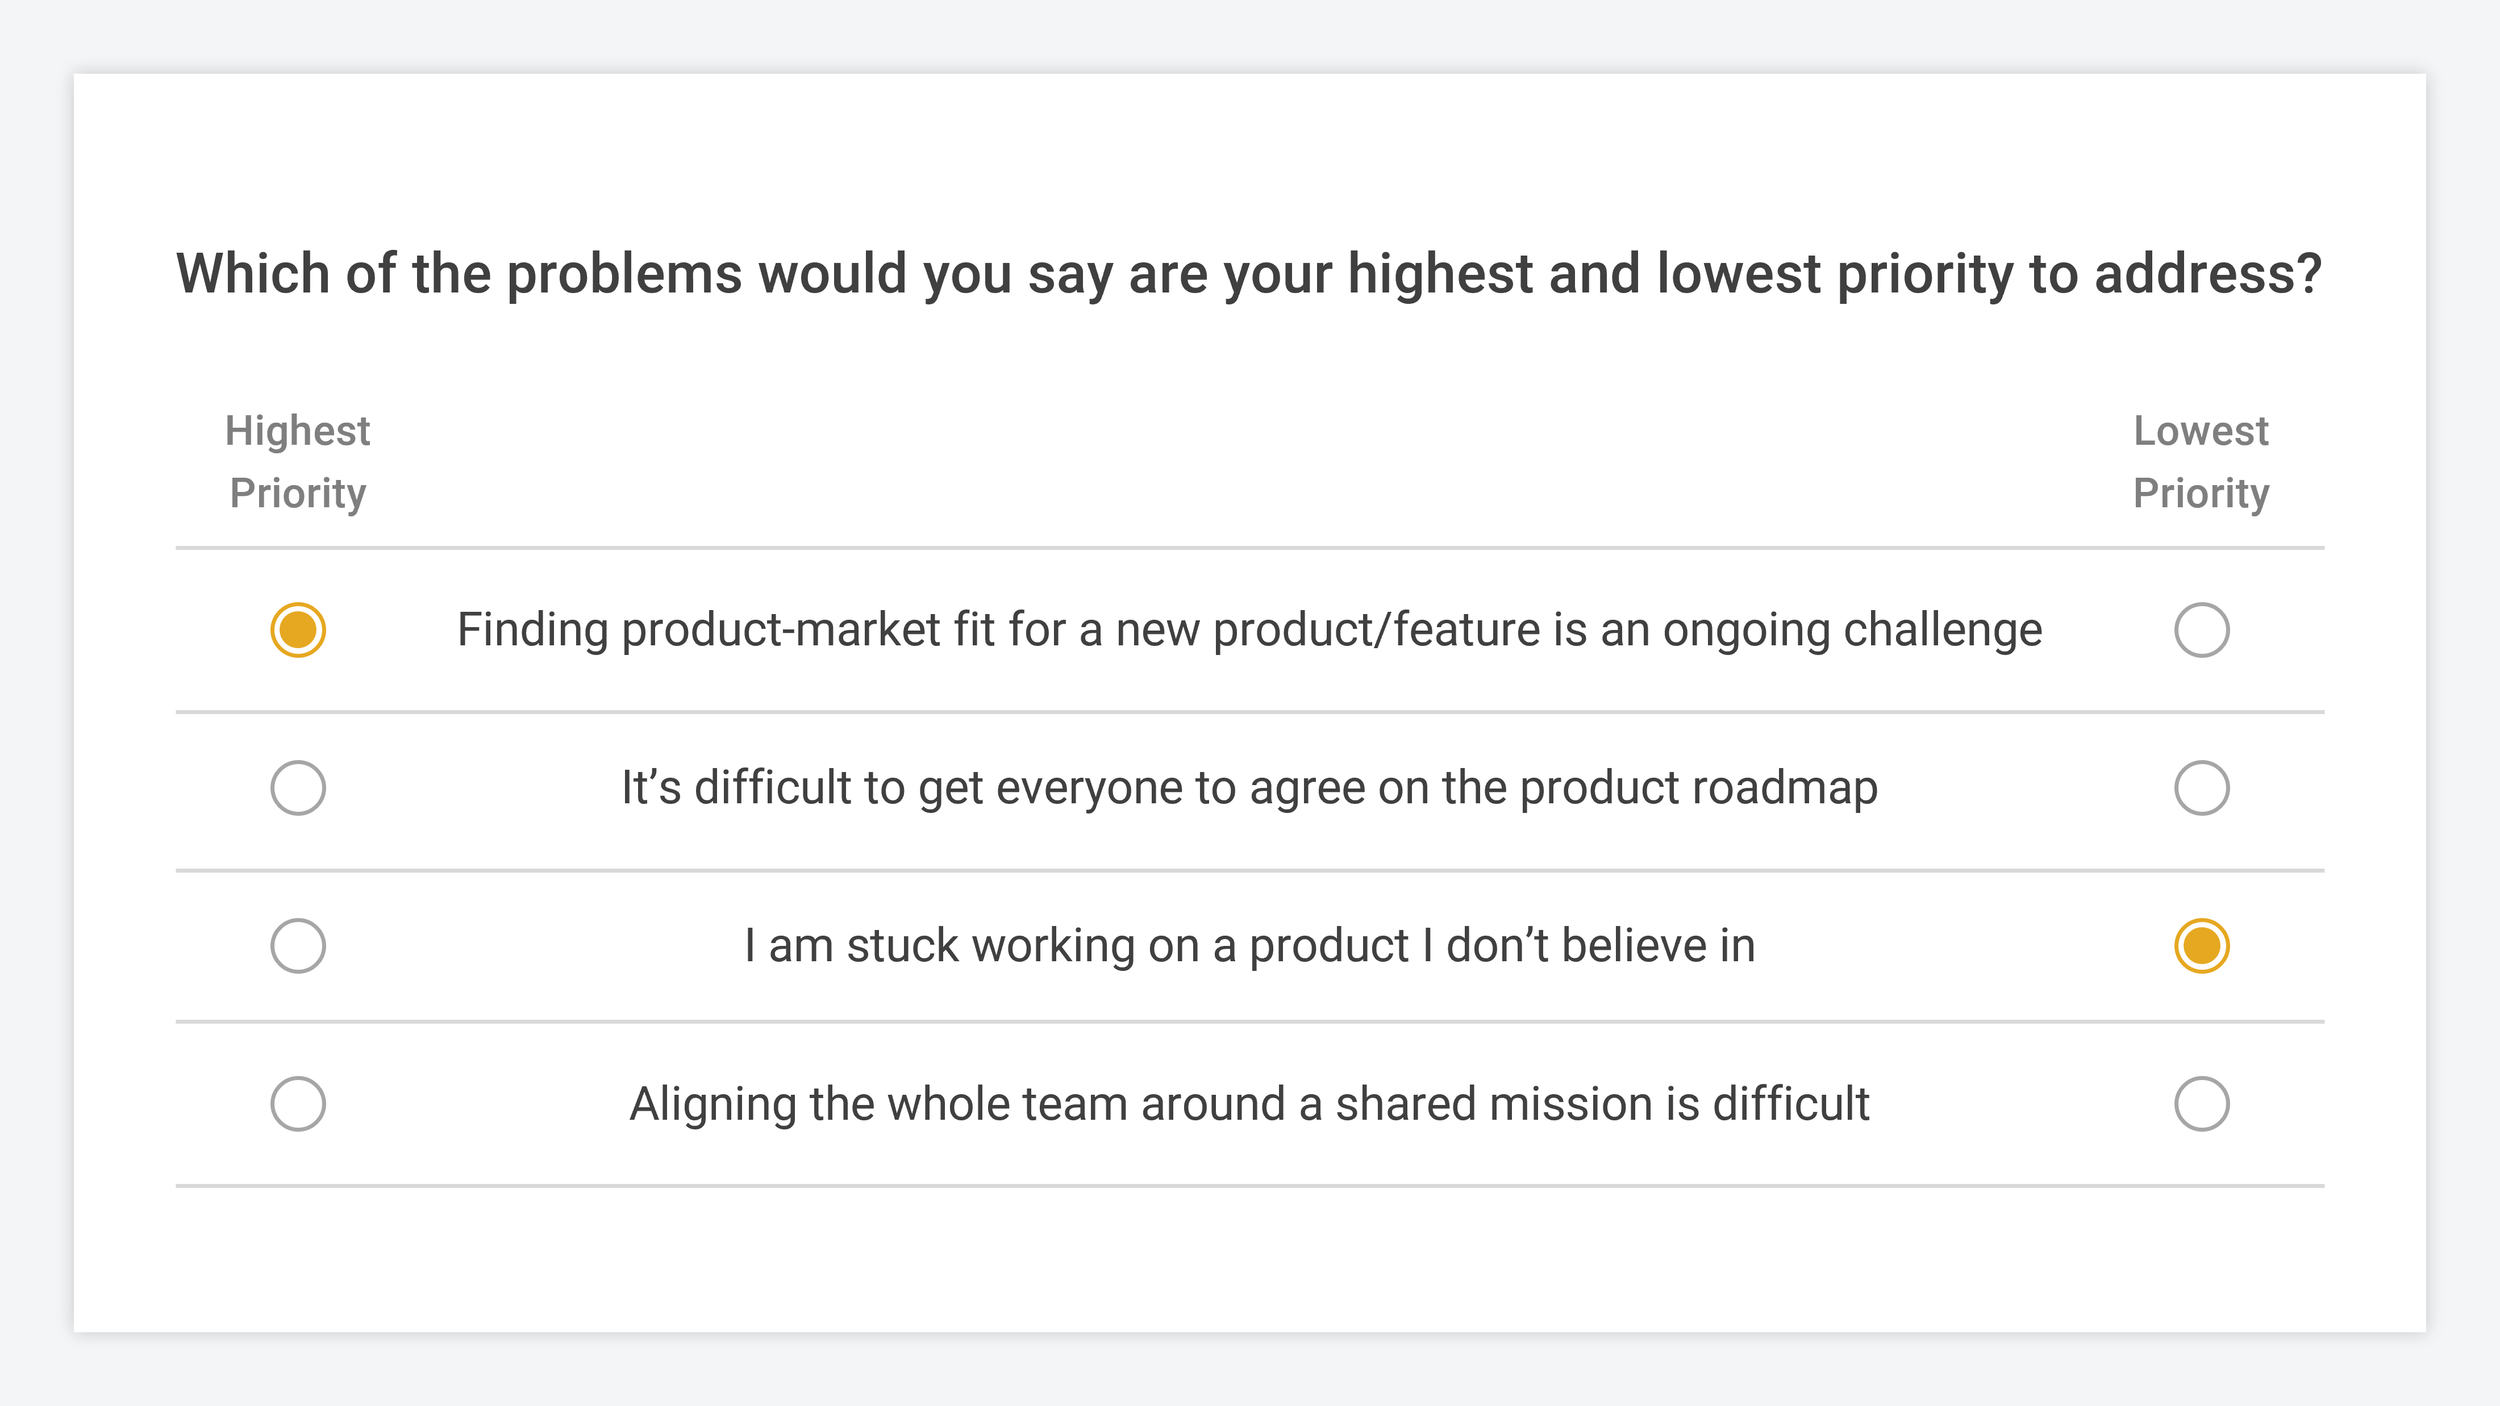
A typical best-worst question shows a set of written options with radio buttons or checkboxes representing "Best" and "Worst" on each side.
Try one for yourself
The best way to understand how these surveys work is to complete one. This example ranks a list of colours from most to least preferred. You'll be shown 7 voting sets, after which you can see the overall results.
How is best-worst different from other survey questions?
Best-worst is a comparative ranking method, which means it forces participants to compare and choose between options according to their personal preferences. That produces continuous data, where answers plot from highest to lowest across a full range of scores.
A 5-star scale produces discrete data instead, where responses pool around fixed points like 3 out of 5 or 4 out of 5. That makes rating scales poor for ranking, because participants can answer them like this:

^ This is exactly why researchers go for forced comparison methods like Best-Worst Scaling instead of rating-based questions like Likert Scales — it’s much better at mapping the minor differences in people’s preferences even when they like all the options.
The gaps between people's preferences are the most valuable output of ranked results. Rating questions destroy those gaps, because every top priority gets flattened into the same 5-star response. Central tendency bias is the reason researchers reach for forced comparison methods instead of Likert scales when the job is ranking.
When is Best/Worst Scaling used?
Best-worst surveys measure priorities, which makes them suited to several research situations.
Prioritisation. Ranking problem statements to find which pain point does the most damage to your key customers, or which feature they most want built. MaxDiff analysis is the version of this most product teams meet first.
Sales and marketing research. Comparing messaging ideas or product claims to see which one your target audience picks. Airbnb's approach to measuring customer concerns is a worked example.
Pricing research. Identifying which features deliver the most value to customers on a specific pricing tier, so you can improve feature discovery or upgrade messaging.
Group voting. Measuring preferences in a room quickly, which makes workshops and team meetings more participatory. Best-worst is particularly useful for ranking subjective opinions or a long list.
Customer segmentation. Because the method captures each person's preferences individually, the output is a dataset you can split to compare what different groups care about. That is needs-based segmentation, and VEED used it exactly this way.
What is the difference between best-worst scaling and MaxDiff analysis?
They are not the same thing, despite decades of people online insisting otherwise.
MaxDiff analysis describes the data collection method. It requires participants to pick the two options with the greatest difference in preference or importance.
Best-worst describes the output data, sorted on a scale from best to worst. That output can be produced by a range of choice-based comparison methods, and MaxDiff is only one of them. Pairwise comparison, ranked choice voting and conjoint analysis can all produce a best-worst scale.
Many sources disagree with this distinction, including ChatGPT. Academia has had it right since Marley and Louviere separated the definitions in 2005, and the renaming was formalised by Jordan Louviere with Terry Flynn and A. A. J. Marley in Best-Worst Scaling: Theory, Methods and Applications (Cambridge University Press). Their framing is that maxdiff scaling is best-worst, but best-worst is not necessarily maxdiff.
The academic record also splits the method into three cases, of which maxdiff is Case 1.
Outside academia the terms get used interchangeably, and we do it ourselves: the OpinionX question type is called "Best/Worst Rank (MaxDiff)" precisely to cover both. So the distinction is worth knowing and not worth arguing about.
What are the advantages of best-worst scaling?
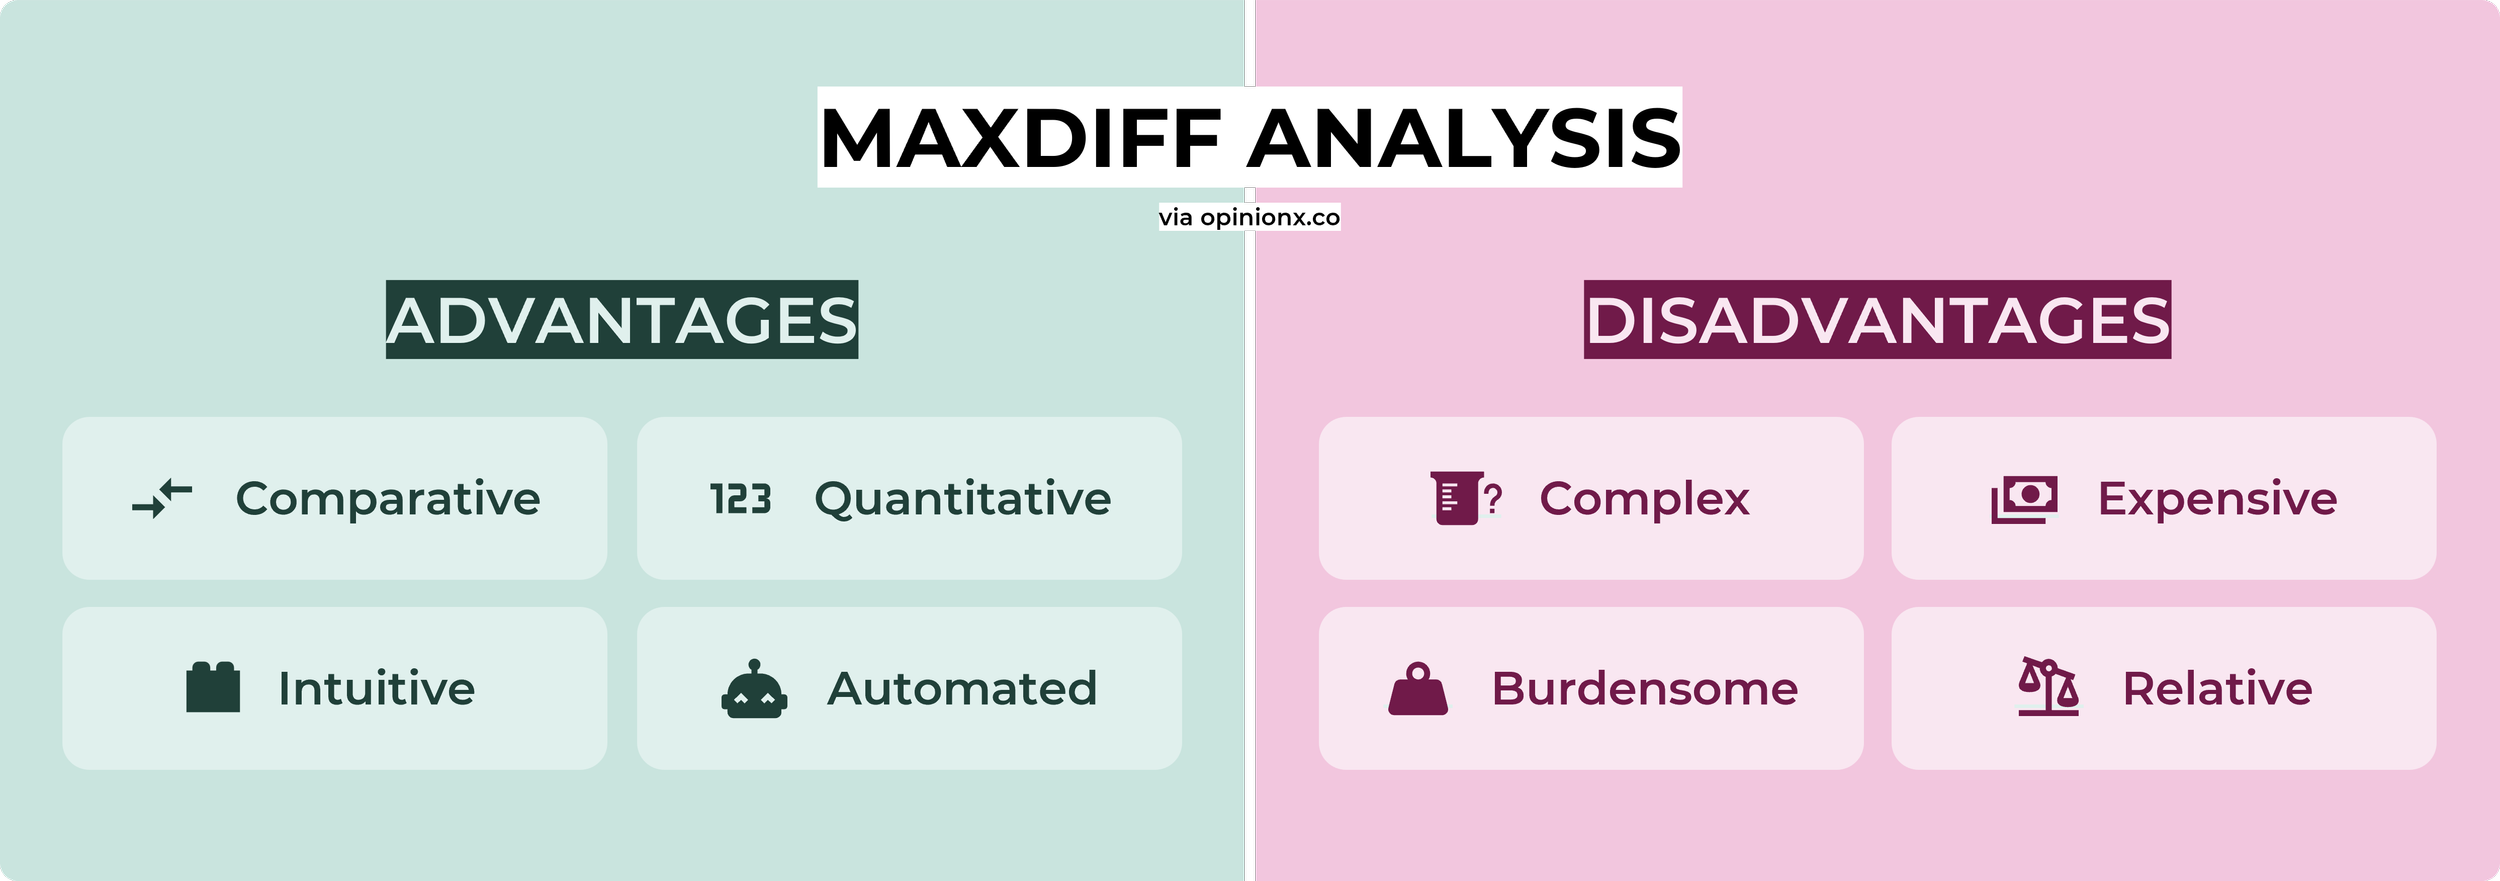
Comparative. Forcing people to compare options turns opinions into a ranked list without anyone having to manually order everything.
Quantitative. The method converts text and images into numerical statistics. Most companies weight quantitative data above quotes, which makes best-worst useful when a big decision needs defending.
Intuitive. A six-year-old could complete one. Pick the best and worst from a set of 3 to 6 choices, repeat. It works as easily on mobile and tablet as on desktop, where manually ranking or rating a long list puts a much higher cognitive load on participants.
Automated. The structured voting means collecting and analysing the data is as easy with 10 participants as with 10,000, which is what makes advanced analysis like segmentation possible at scale.
What are the disadvantages of best-worst?
Complex scoring. Some products use advanced scoring methods such as linear regression or Bayesian rating systems, which produce statistics most people can't decipher.
A simple formula like (best-worst)/appearances gives each option a score from -100 to +100, which is far easier to explain and to defend when someone challenges your results. That formula is how the "Best/Worst Rank" question type calculates final scores on OpinionX.
Expensive elsewhere. Most research tools treat the method as advanced and price it accordingly. The tool comparison further down shows what nine of them charge.
Burdensome if overloaded. Intuitive as it is, the method becomes cognitively heavy if you show too many options at a time. The rule of thumb is 3 to 6 at most. If in doubt, switch to pairwise comparison, which only shows two options at a time.
Relative, not absolute. Like all discrete-choice methods, best-worst scores options relative to each other. It'll tell you which option beats the others on your list, and it can't tell you whether the list itself was any good. Always run qualitative research first to make sure your voting list covers a sufficient range.
How are best-worst results calculated?
Some tools use Bayesian statistics models or linear regression. This explanation uses the more common aggregate-scoring method.
The aggregate-scoring method takes the total number of "best" votes, subtracts the total number of "worst" votes, and divides by the number of times the option appeared. In other words, (best-worst)/appearances.
An option that appeared in 100 voting sets, picked best 50 times and worst 15 times, scores (50-15)/100 = 35%.
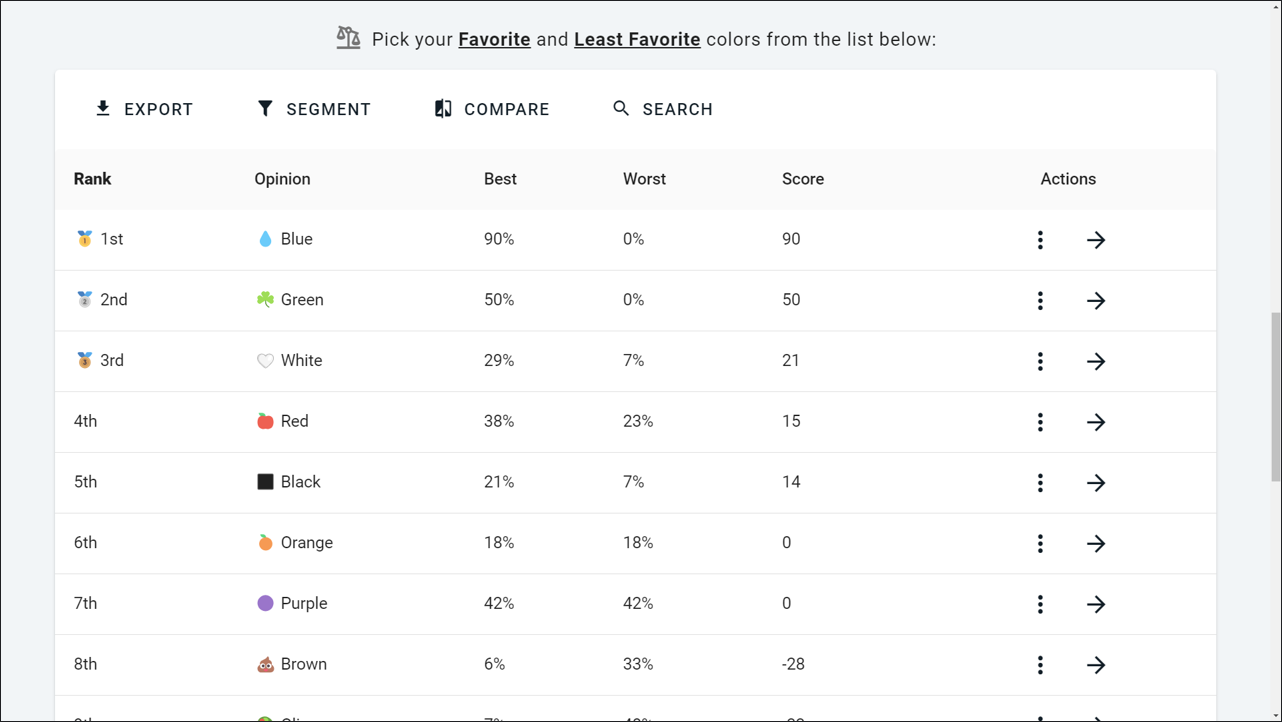
Screenshot of the results table on a Best/Worst Rank survey hosted (via OpinionX)
How do you calculate sample size for a best-worst survey?
Most guides hand you an arbitrary minimum of 100 participants. That number is meaningless on its own. The right target depends entirely on how your survey is configured.
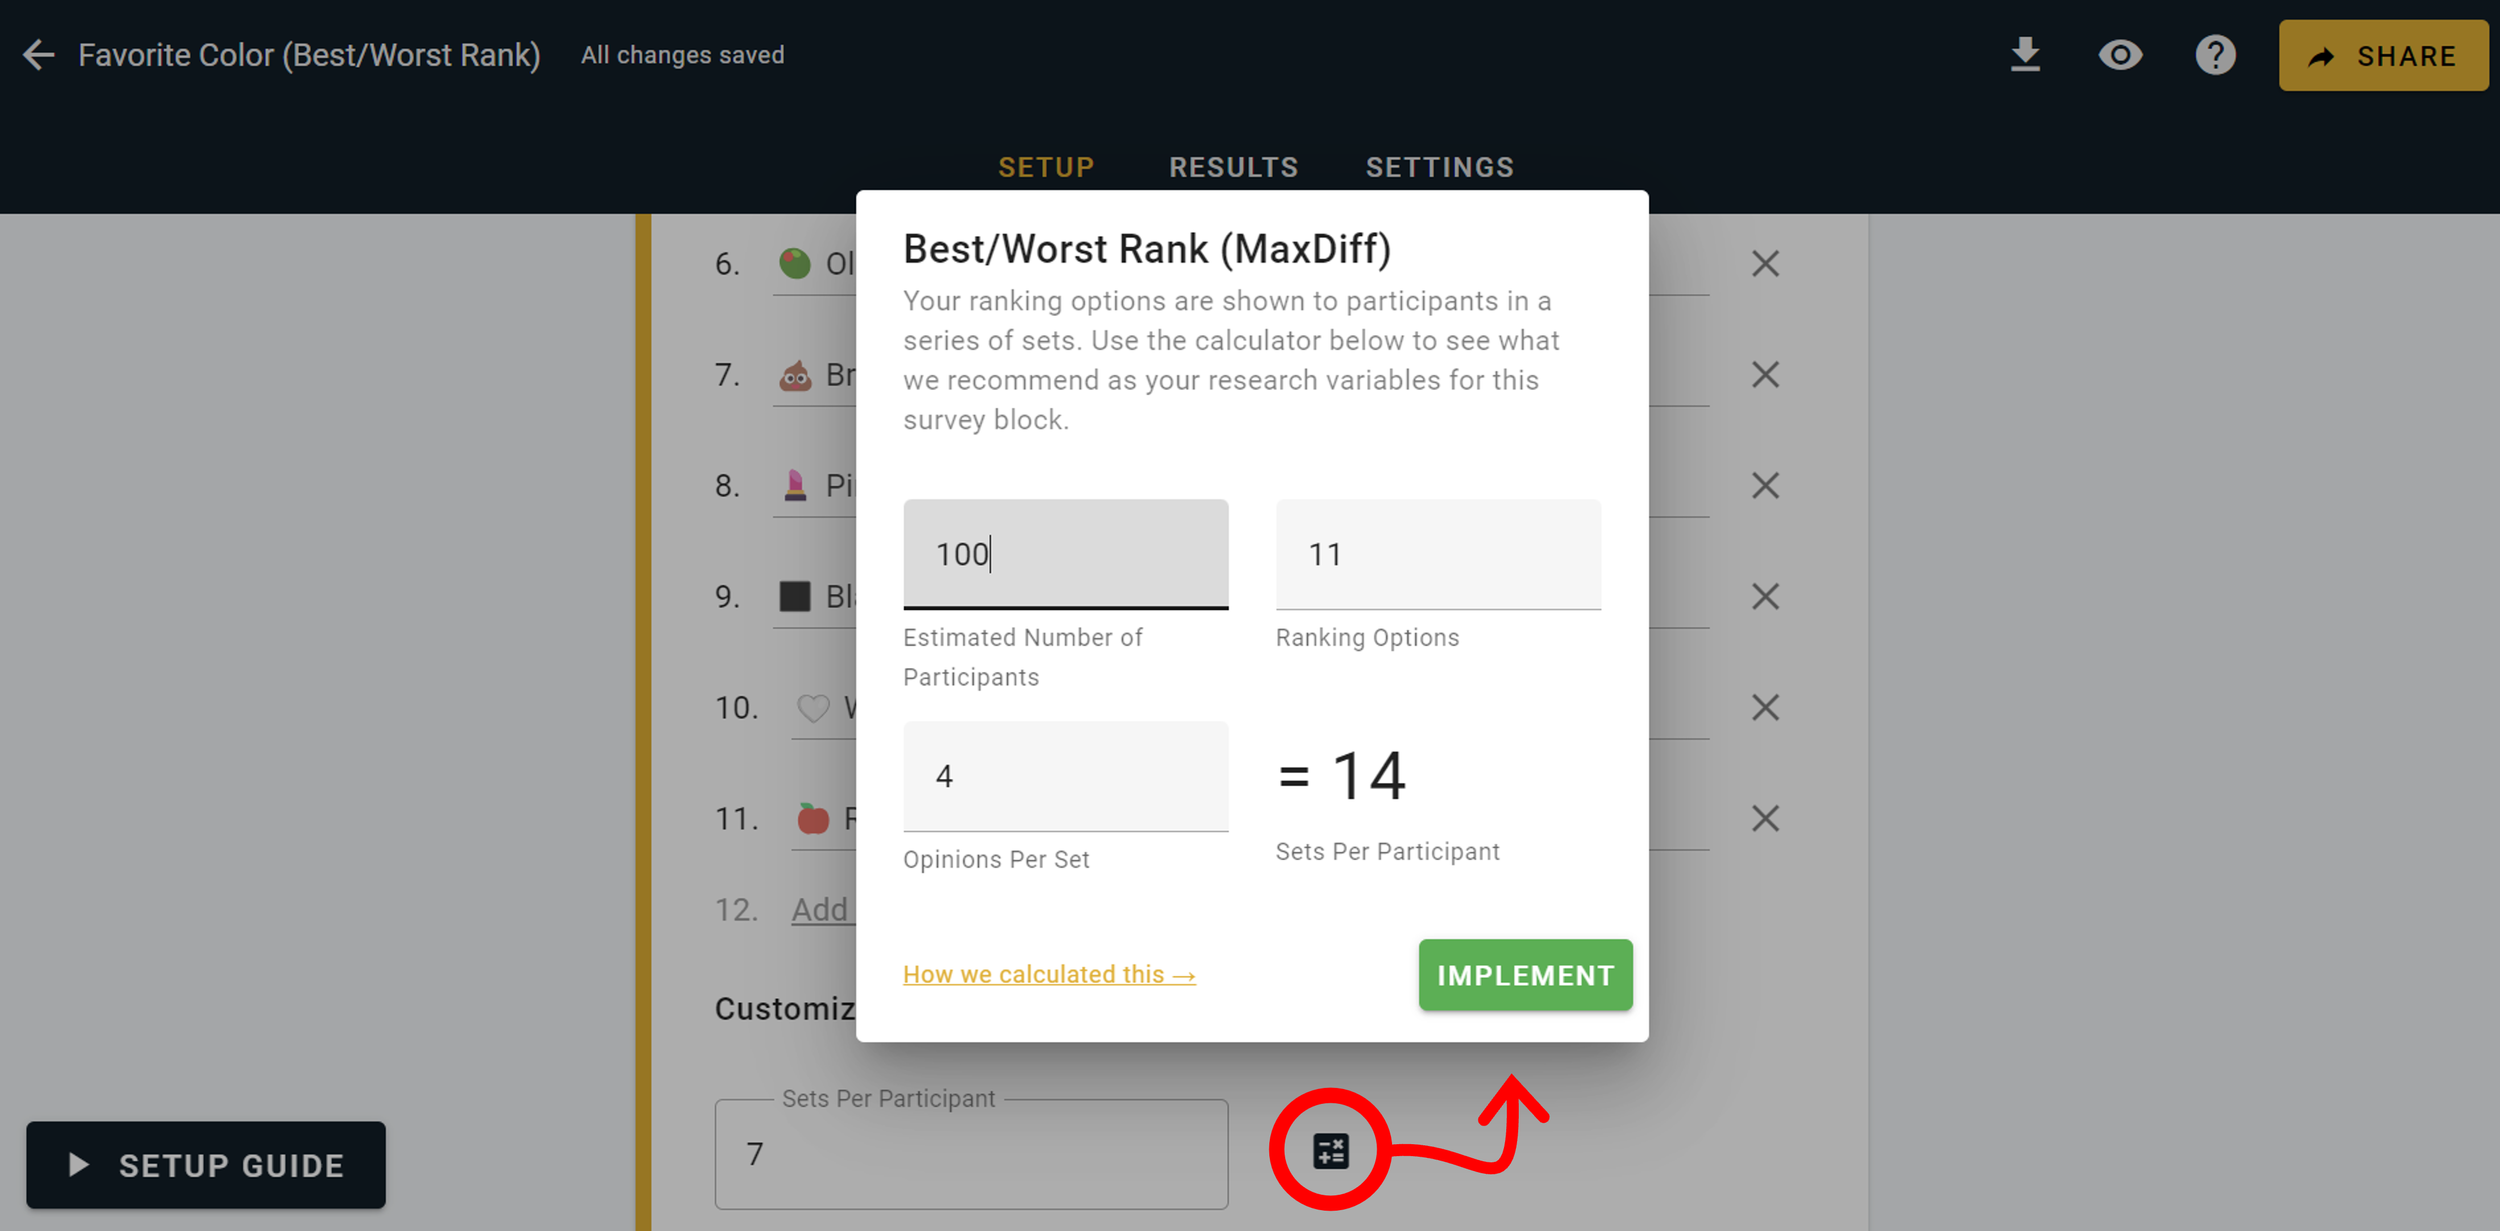
Every survey of this kind is built from the same five variables:
| Variable | What it means |
|---|---|
| x | Total number of ranking options in your survey |
| n | Number of options shown per set |
| p | Participants you expect to complete it, as a minimum estimate |
| s | Sets per participant, meaning how many best/worst picks each person makes |
| r | The reliability variable, ensuring each option appears in at least r comparisons |
They combine as rx/np = s.
Set r to at least 200, so every option appears for voting at least 200 times across the survey. Everything else depends on how you build it. The output, s, is the easiest variable to change when you want more reliable results.
Take a survey with 30 ranking options (x), showing 4 options per set (n), where you expect at least 80 people to finish (p). The calculation runs 200(30)/4(80) = 18.75. Always round up on these, so s is 19 sets per participant.
Four caveats on the calculation
Never go below 10 sets. If the formula returns anything under 10, show 10 anyway. Each set takes a few seconds, and extra data costs you almost nothing, provided the rest of your survey isn't already long.
The formula works in any direction. Rearrange it to solve for a different variable. To work out how many participants to recruit, use p = rx/sn.
Count the whole survey, not just this question. If your survey has multiple ranking questions, add up every vote a participant will cast. Completion rate drops as that total climbs, and anything above 40 sets across a whole survey is a lot to ask without a financial incentive.
Segmenting changes the participant number. If segmentation matters to your analysis, substitute the participants variable for the number of people you expect from your smallest key segment.
Comparing the 9 most popular best-worst scaling tools
Three criteria decided the verdict for each tool:
Is there a free version?
Can you try it without talking to a sales team?
Is the survey usable, and are there analysis features once the data comes in?
All but two turned out to be paid-only, and for some I couldn't find proof that the format genuinely exists.
| Tool | Entry price | Try without sales? | Verdict |
|---|---|---|---|
| OpinionX | Free tier, then $900/year | 🟢 Yes | 🟢 Full method free, capped at 25 participants |
| Sawtooth Software | Not published | 🔴 No | 🟡 The rigour standard, if you have budget |
| Qualtrics | Add-on to an existing licence | 🔴 No | 🔴 Fixed voting sets in the demo |
| SurveyMonkey | Team Premier, 3-seat minimum | 🔴 No | 🔴 No public evidence it exists |
| Forsta | Not published | 🔴 No | 🔴 No demo, no price, sales call only |
| QuestionPro | Research Suite, custom quote | 🔴 No | 🔴 Top tier only |
| SurveyKing | Free preview, then per-user monthly | 🟡 Partly | 🟡 Free tier caps at 3 options, repeat sets |
| Alchemer | Full Access tier, max 3 users | 🔴 No | 🔴 Most expensive tier only |
| Q Research / Displayr | Licence purchase required | 🔴 No | 🟡 Built for traditional market researchers |
1. OpinionX 🟢
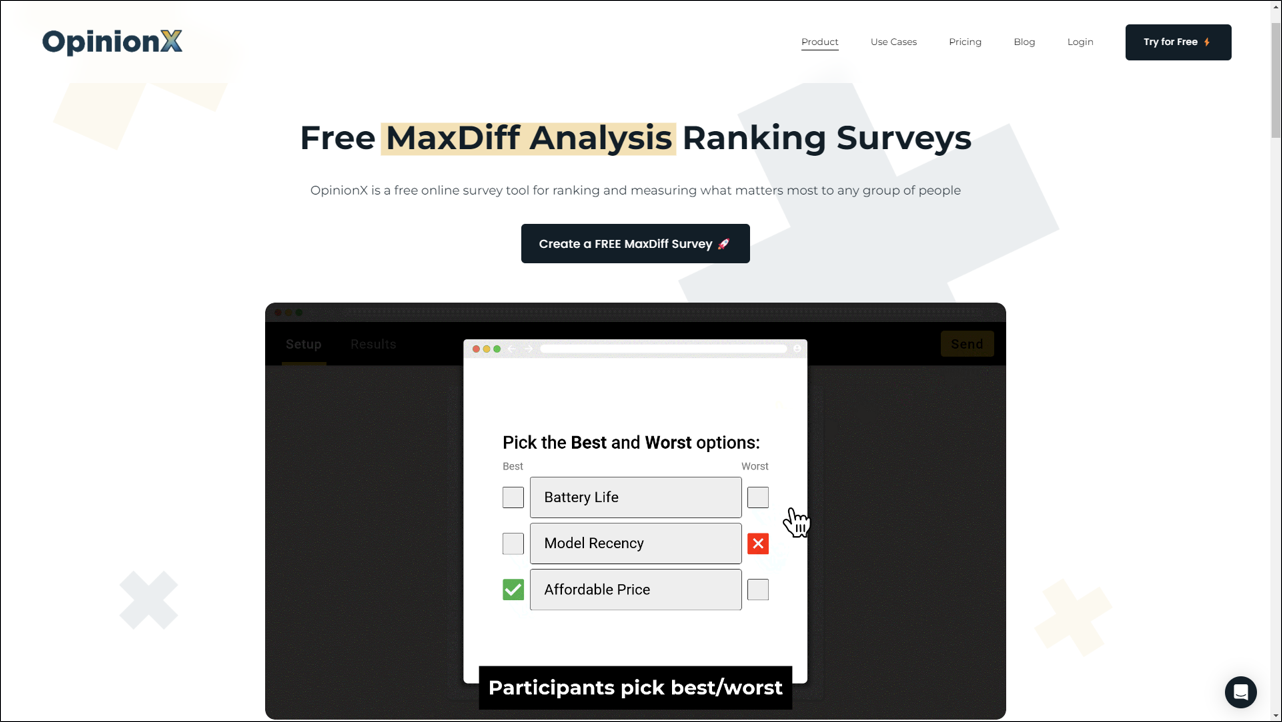
OpinionX runs ranking surveys, including a question type called Best/Worst Rank (MaxDiff), available on the free plan.
The free tier covers unlimited surveys, unlimited questions, unlimited teammate seats, and every analysis feature, capped at 25 participants per survey. That is enough to design a real survey, test the configuration, run the sample size calculator and read the results before deciding anything.
The Analyze tier is $900 a year and removes the participant cap. Same setup, same analysis, unlimited participants. Billing is yearly, with no per-survey fees and no feature gating, so the only thing you pay for is response volume. If you want to see how the format compares against the other tools in more depth, we keep a separate MaxDiff tool comparisonand a list of MaxDiff alternatives.
Teams at Google, Amazon and Shopify use OpinionX, alongside academic researchers and national governments.
Verdict: the only tool on this list where the full method, the sample size calculator and the segmentation analysis all work before you pay anything.
2. Sawtooth Software 🔴
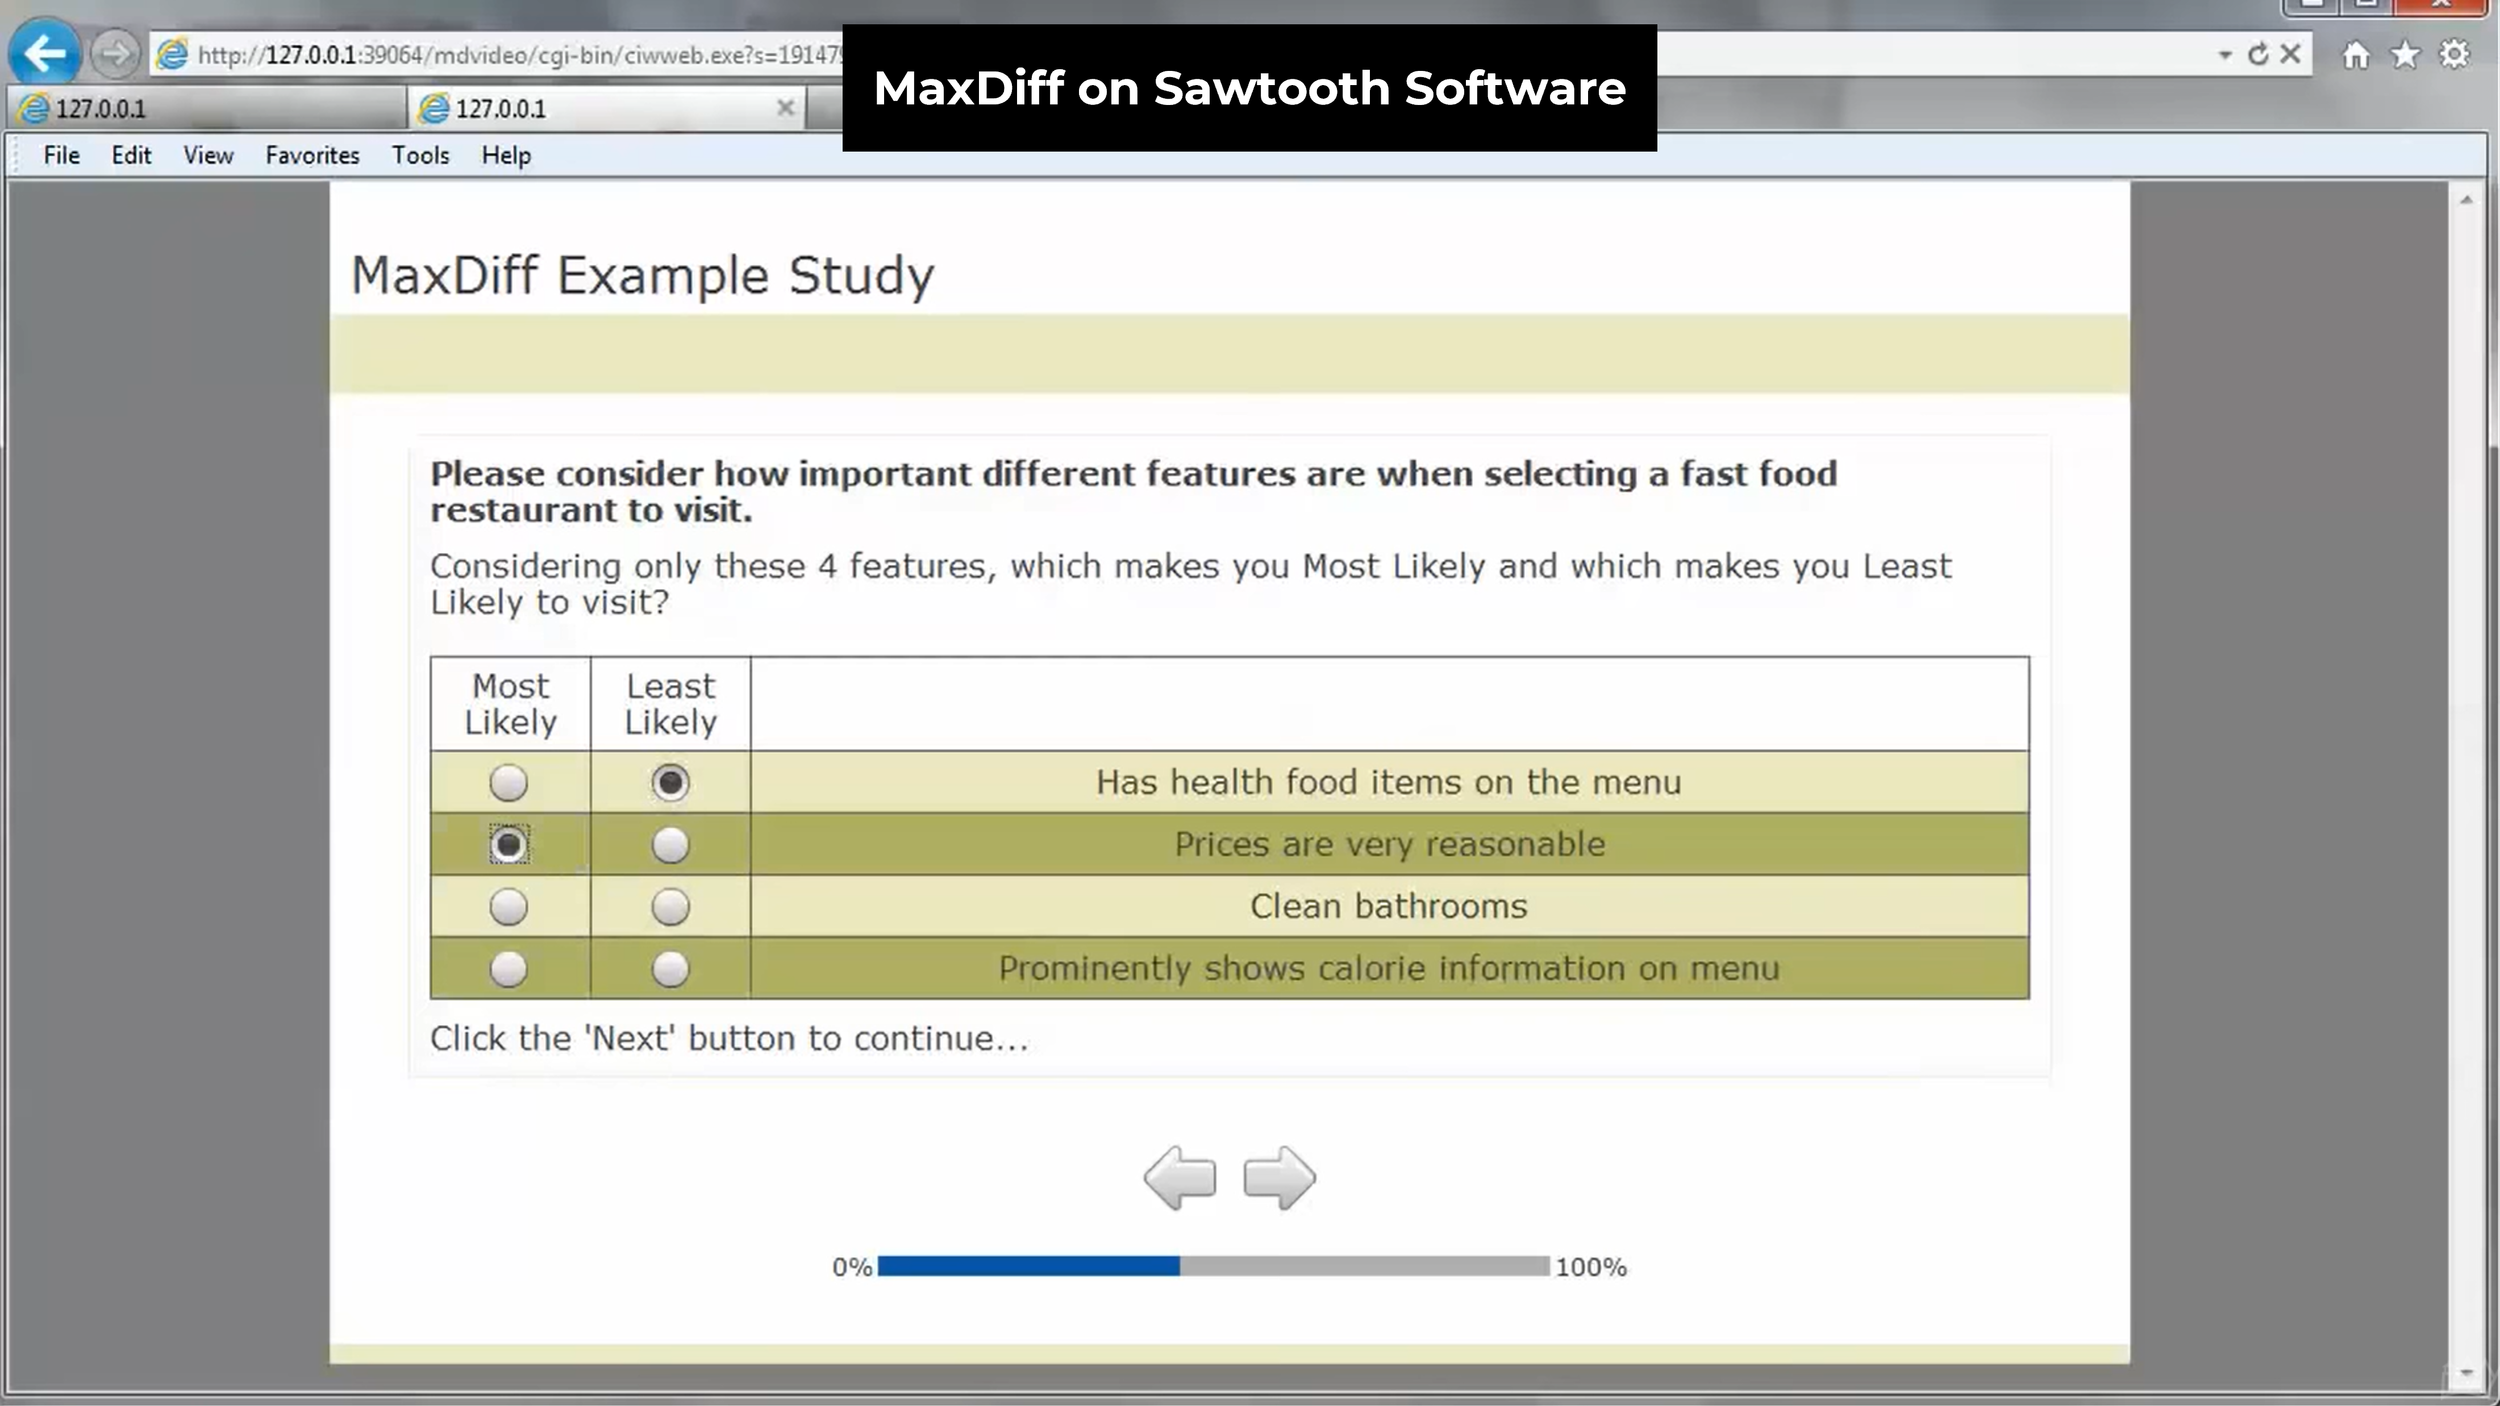
Sawtooth Software provides digital market research tooling with a particular focus on conjoint analysis. Founded in 1983, it targets academics and market research organisations and sells research expertise as an additional service.
Sawtooth built a proprietary version called "Bandit MaxDiffs", which uses Thompson Sampling to adapt its choice sets to each subsequent participant.
There's no free or demo version. You can request a demo of Lighthouse Studio, a Windows-only desktop application, from their sales team. Their pricing page lists no per-seat figures.
Verdict: if you need academic-grade methodology and adaptive designs, Sawtooth is the standard and worth the process.
3. Qualtrics 🔴
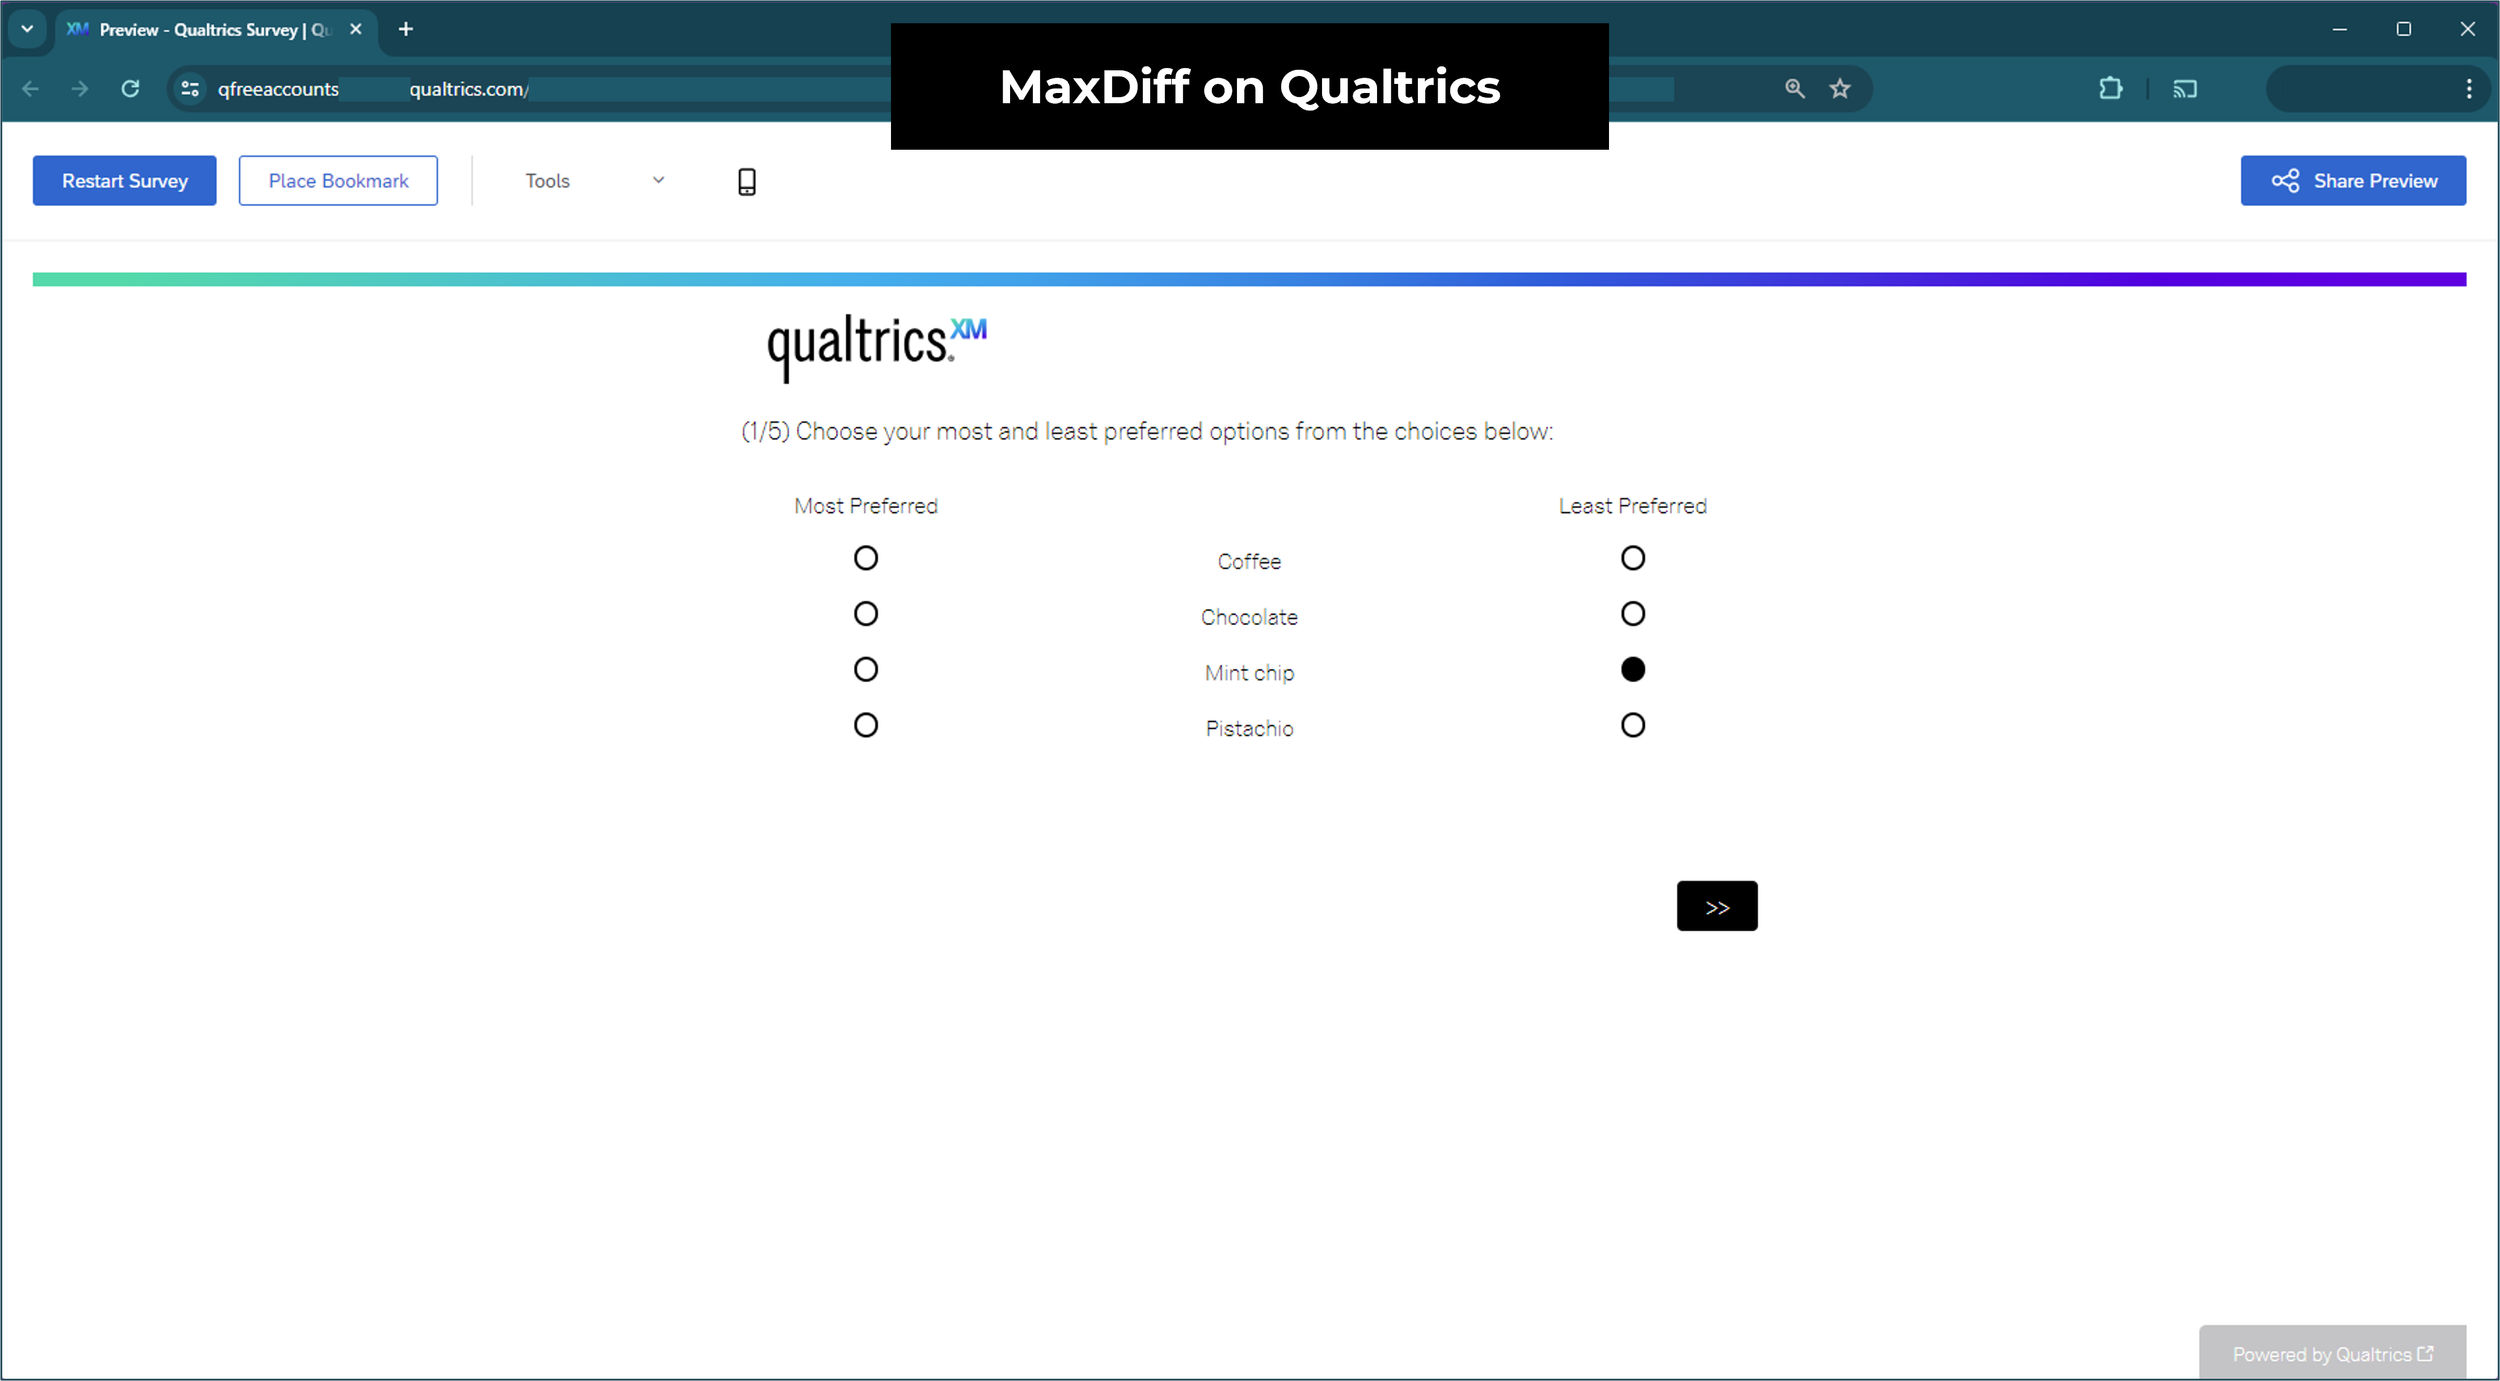
Qualtrics has a best-worst question format, but it requires an existing PX or EX premium subscription, or a CX licence including the journey optimiser. Even then, unlocking it needs an additional purchase through your account executive.
I got access to a test version, which shows a dummy survey pre-filled with sample data. The voting sets appear to be fixed and identical for every participant, which is no use for almost any best-worst research project.
Verdict: the highest entry price on this list for a format that, in the version I saw, doesn't randomise sets.
4. SurveyMonkey 🔴
SurveyMonkey added a best-worst question type in October 2023. Their pricing page shows it on all paid plans, but a friend's premium account showed it only unlocking on Team Premier, their most expensive tier, at a 3-seat minimum billed annually. The information from SurveyMonkey is contradictory.
After searching for a single example of anyone mentioning it online, I couldn't find one screenshot of what their Best-Worst Scale actually looks like. An obscure Reddit comment suggests one person used it in December 2023, but that survey has since closed.

SurveyMonkey's own help centre article on the question type contains no screenshots either. They used text tables instead. Billions of questions answered on the platform since launch, and nobody has posted anything about this feature.
Verdict: my guess, based on the original press release, is that this belongs to their enterprise market research range and not the self-service product. If anyone can confirm it exists on the self-serve plans, I'd like to see it.
5. Forsta 🔴
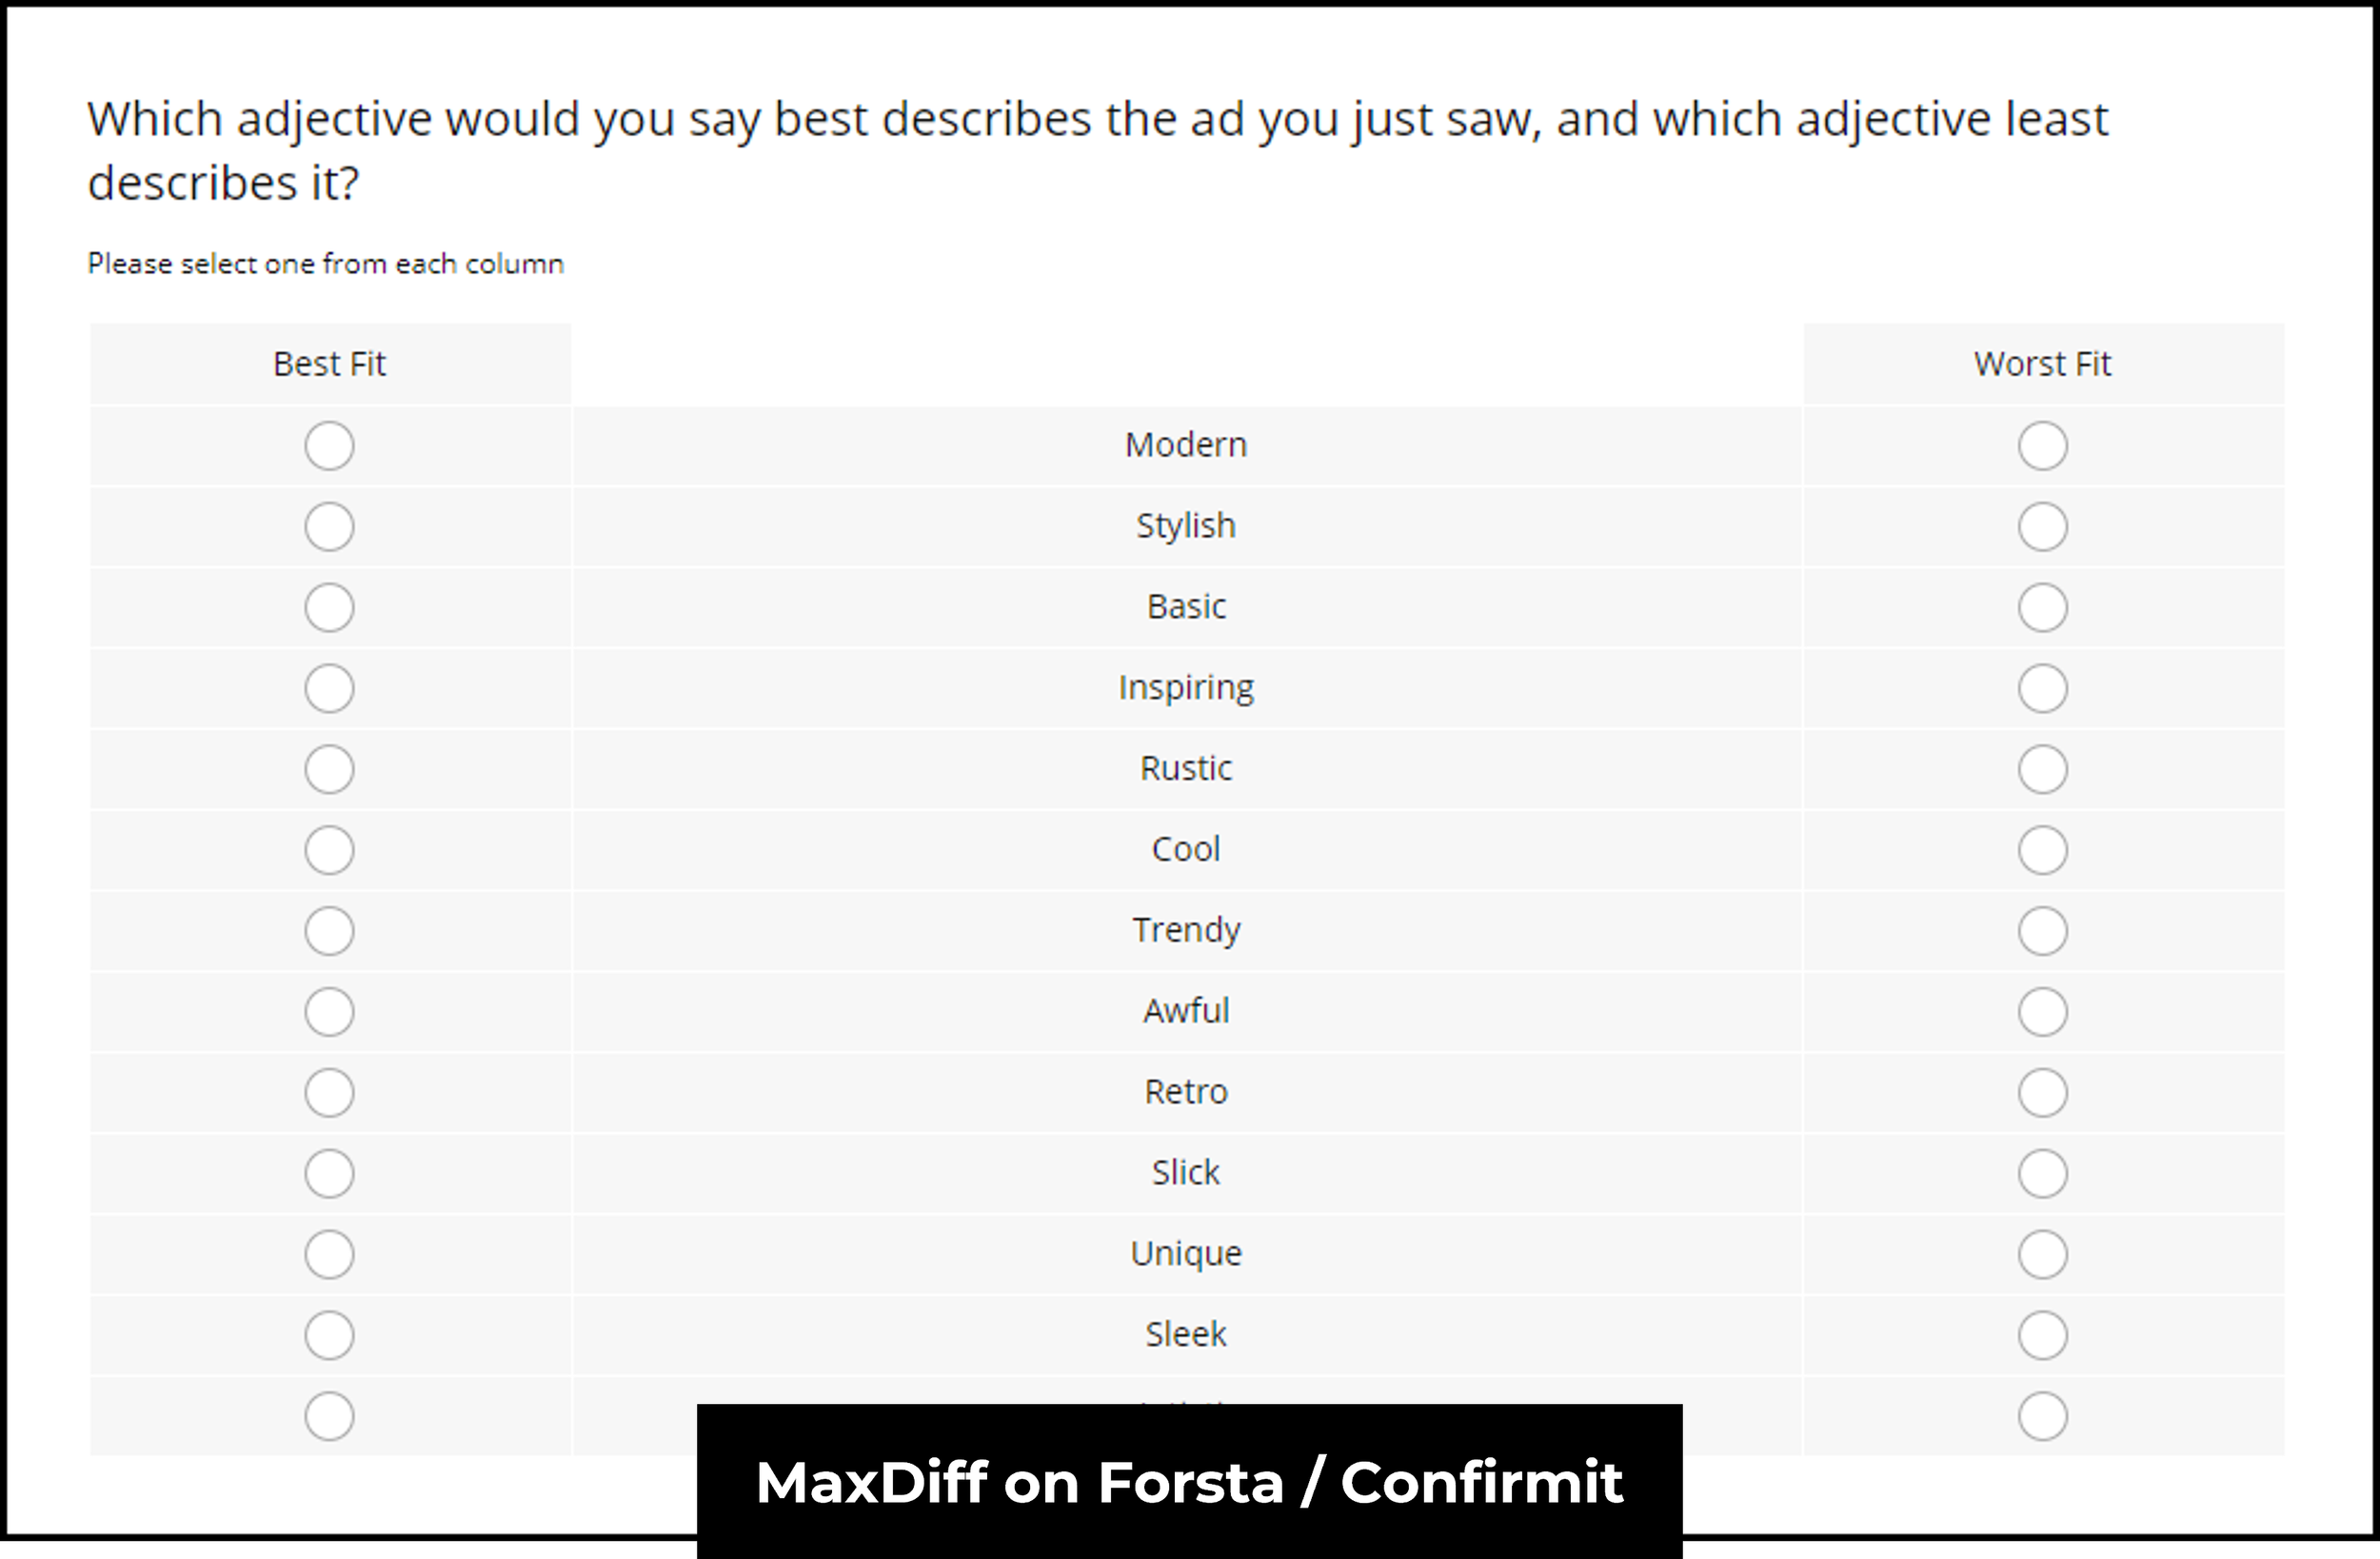
Forsta, the brand that emerged from the merger of Confirmit, FocusVision Decipher and Dapresy, offers a best-worst format as part of its "dynamic questions" range.
I searched for a live demo or a rough price range and found neither. You have to go through a full sales qualification conversation to find out what it costs, which tells you something on its own.
Verdict: no demo, no published price, no way to evaluate it without a sales process.
6. QuestionPro 🔴
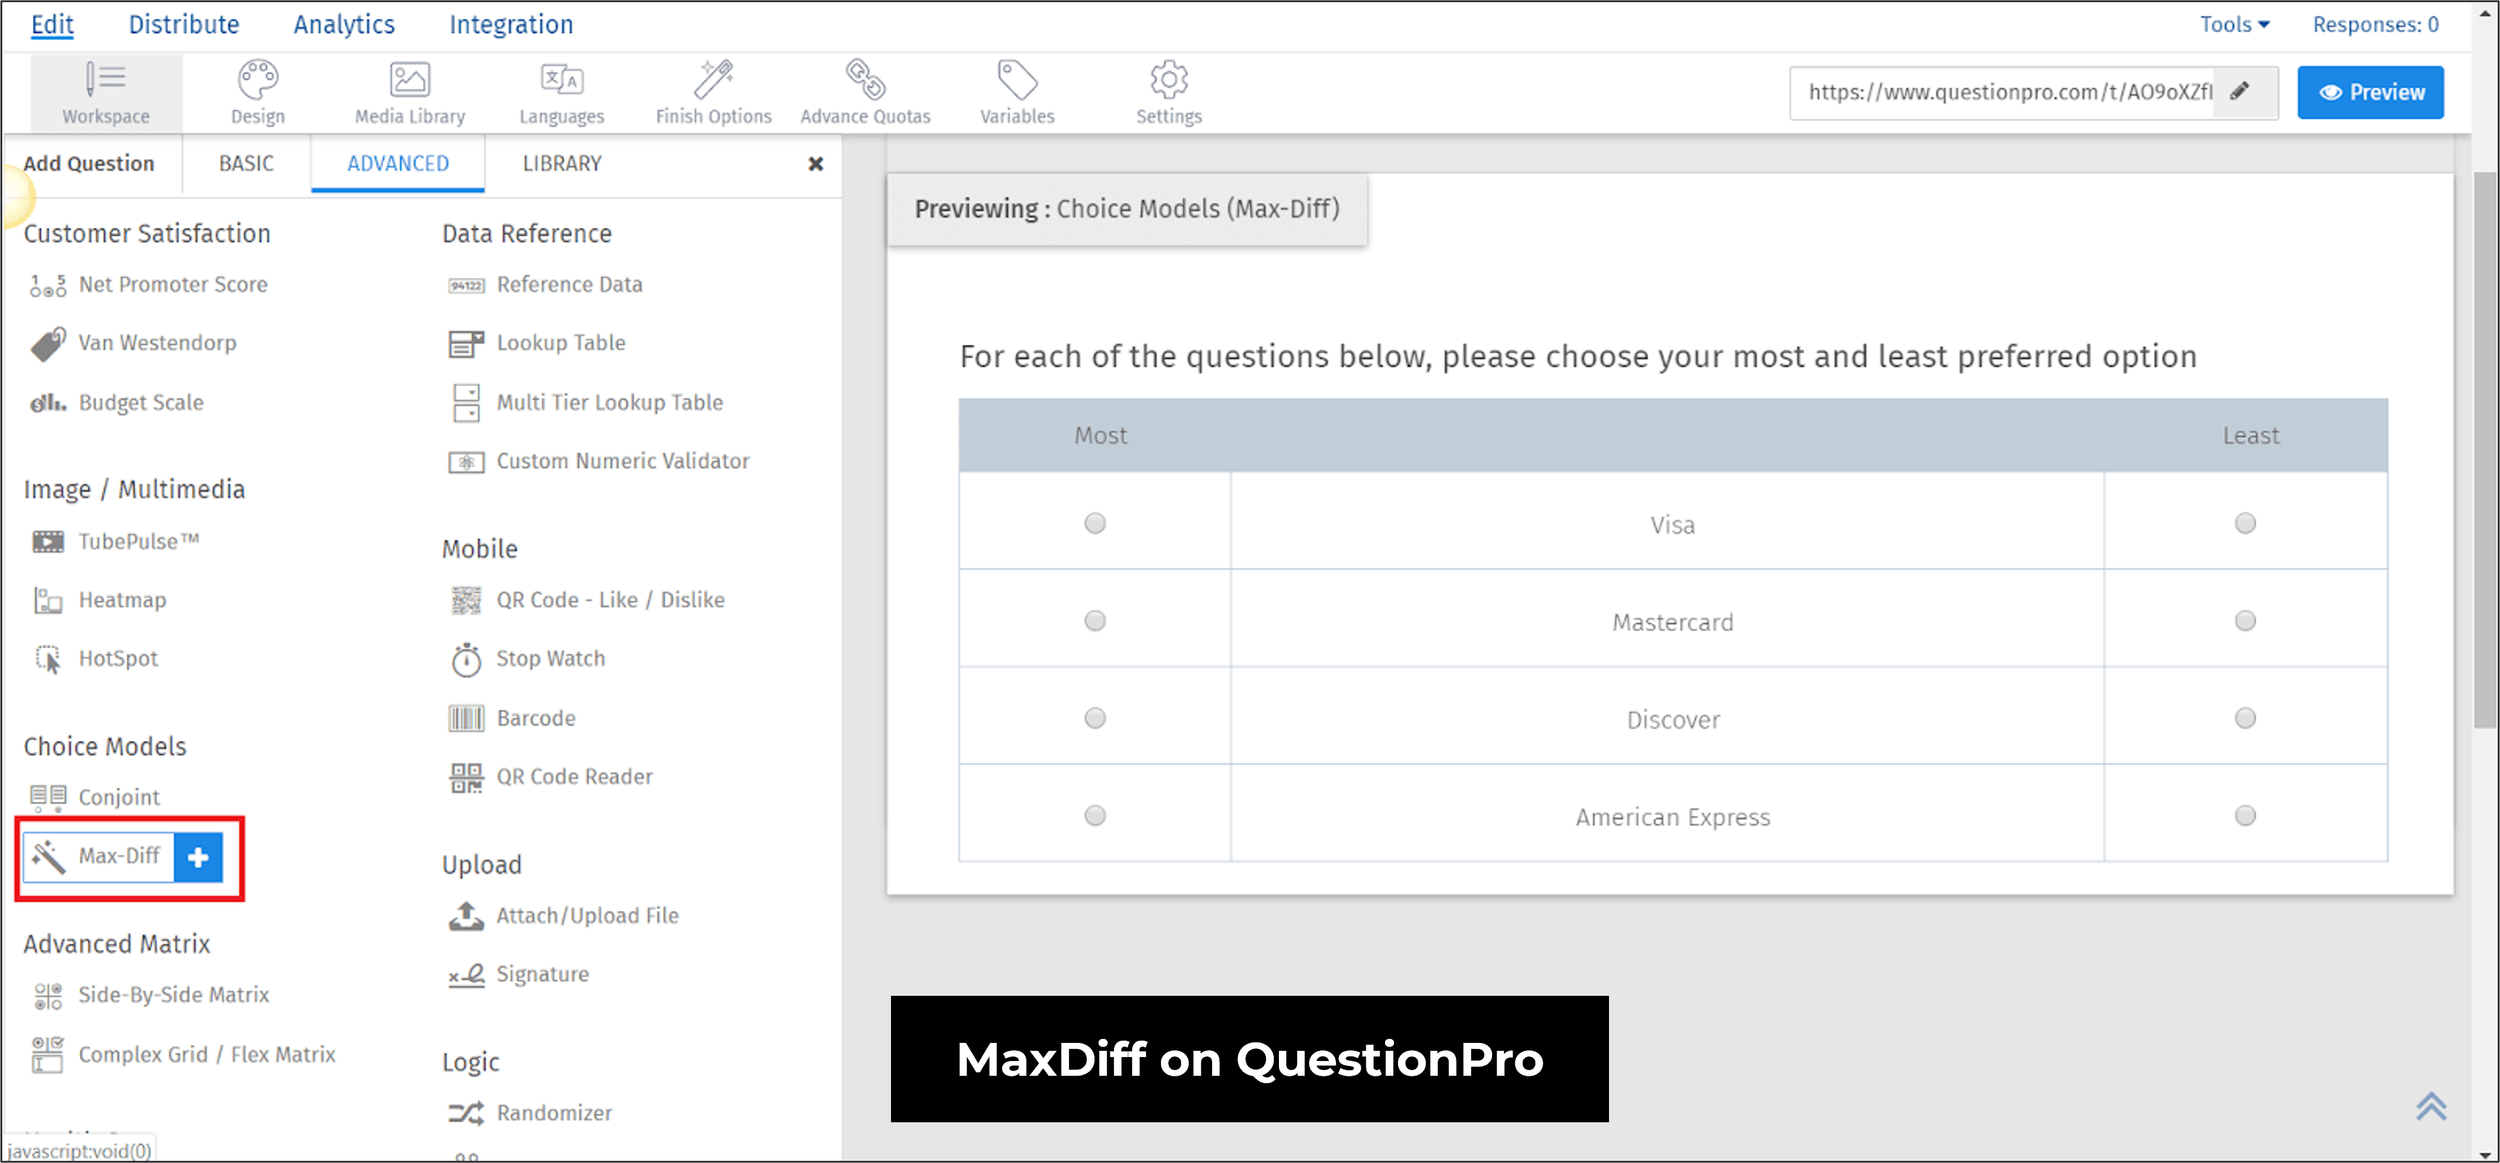
QuestionPro is another of the large survey platforms, and it doesn't differ much from SurveyMonkey in functionality or price. Best-worst and conjoint analysis appear only in the Research Suite tier, available by custom quote.
Verdict: advanced methods locked behind the top tier with no self-serve path.
7. SurveyKing 🟡
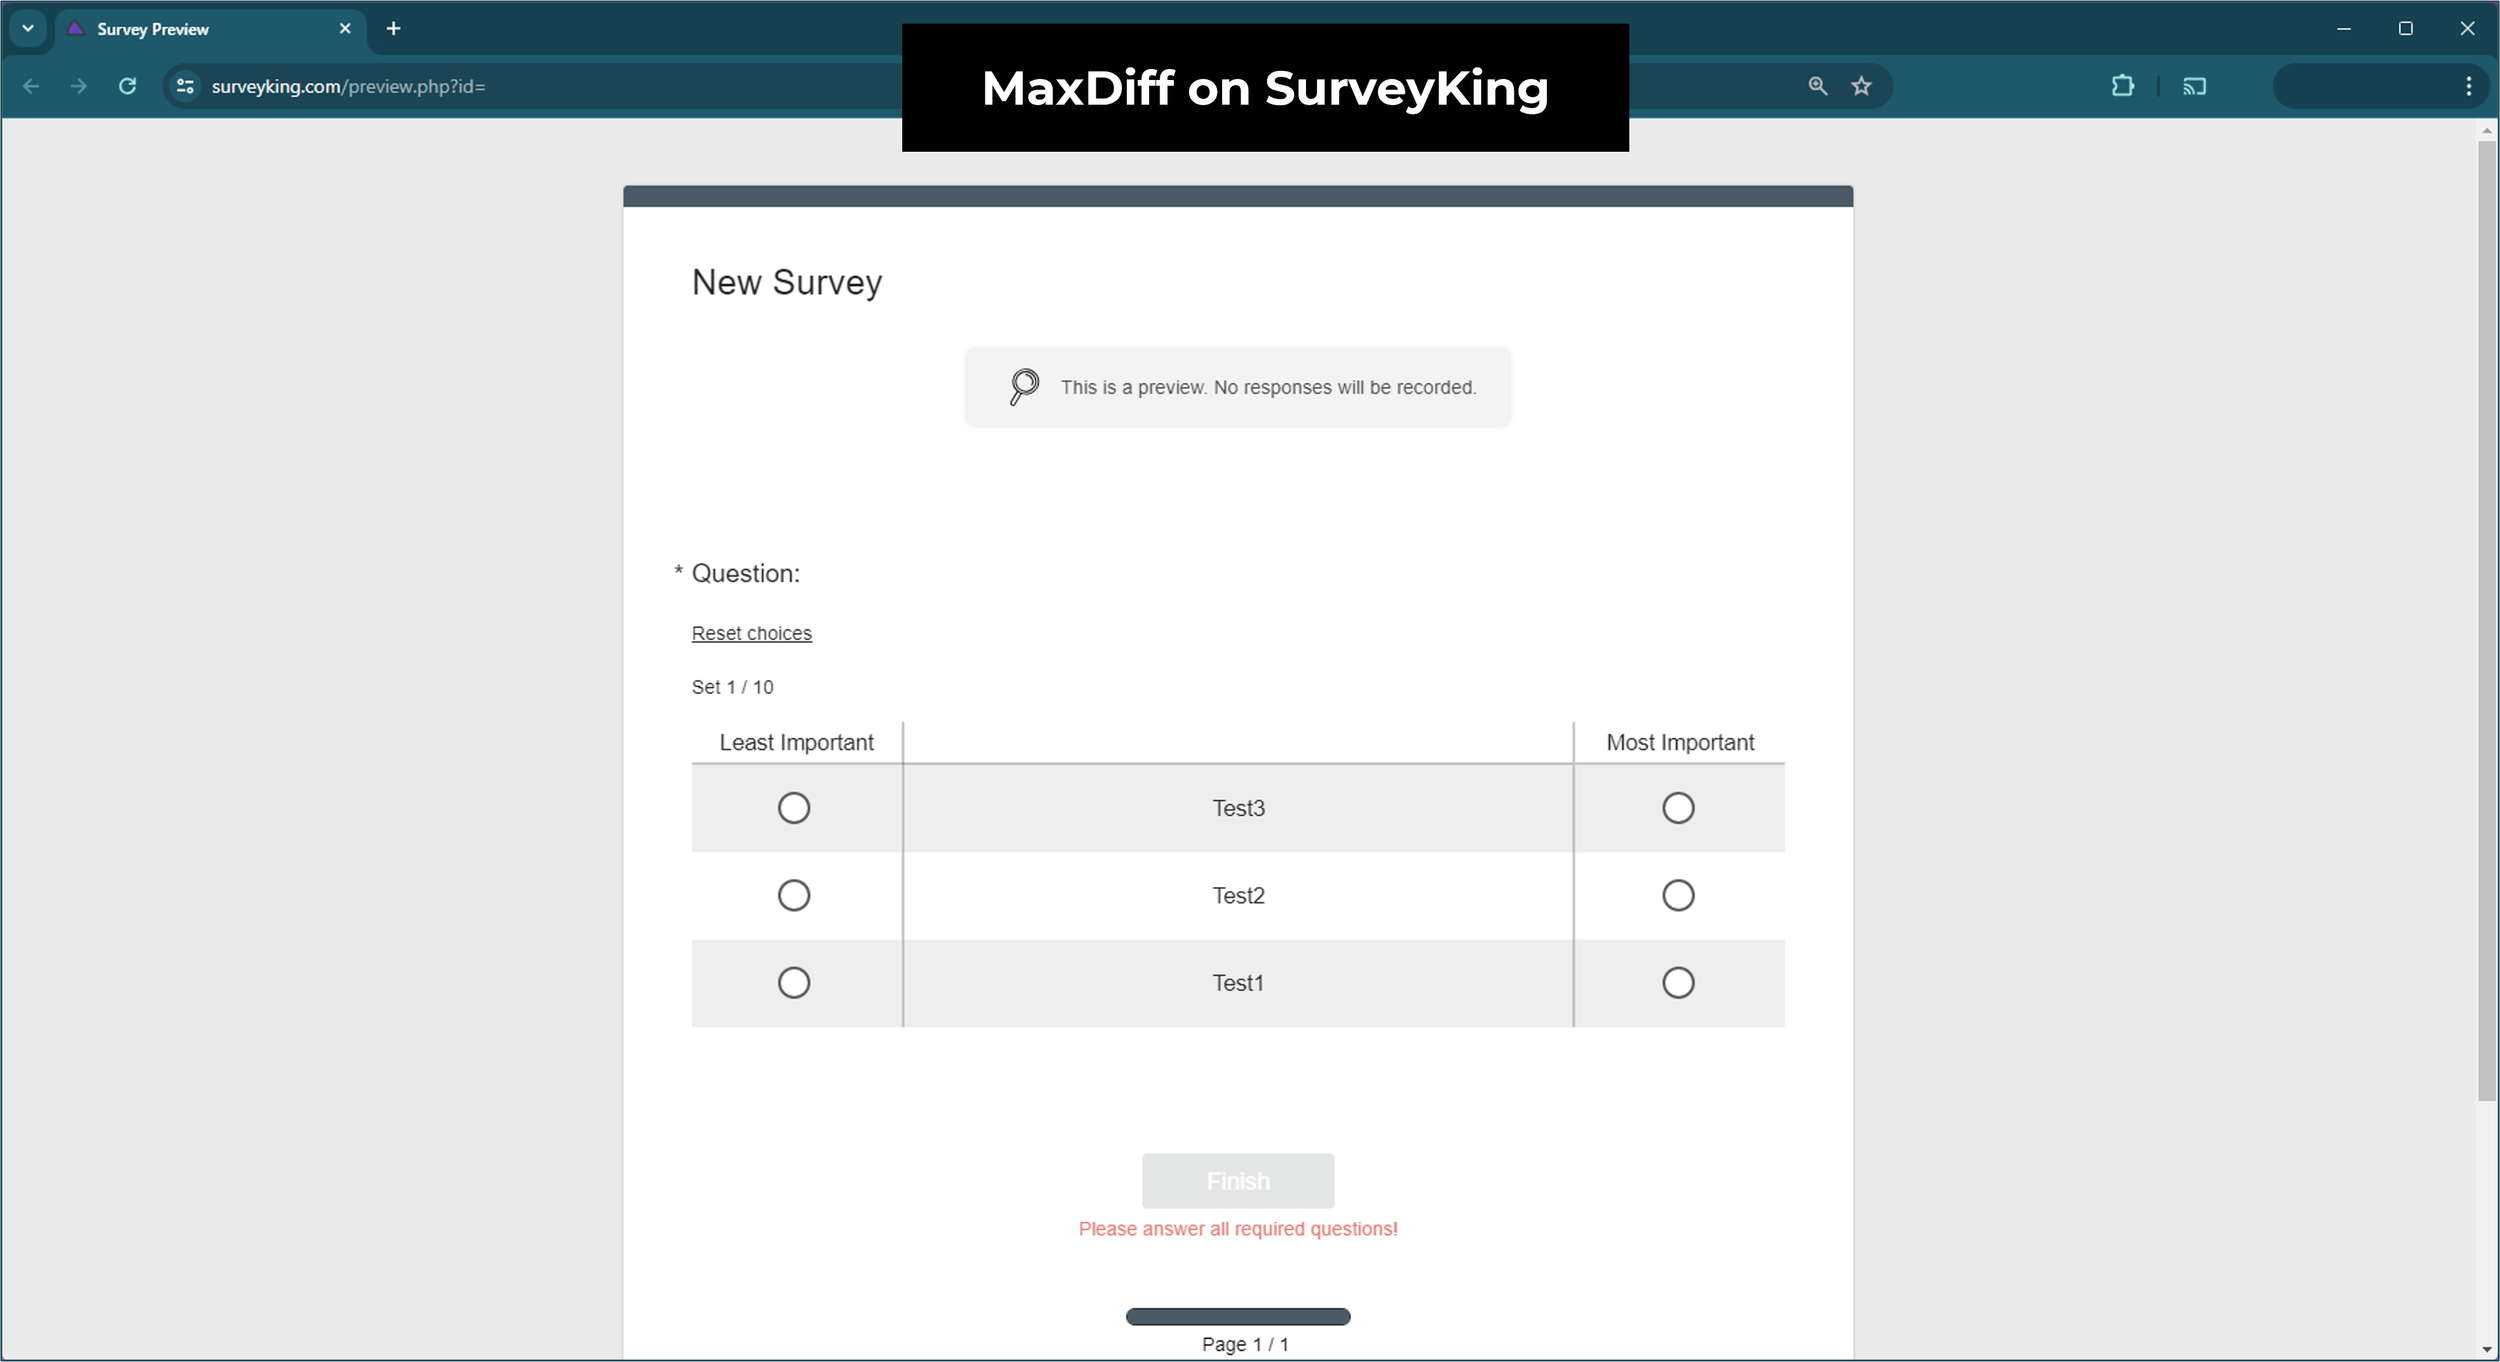
SurveyKing offers a wide range of question types at a low price. Free users can create a test best-worst survey, but only with three ranking options, so it works as a design preview and not a usable survey.
There's also nothing stopping the same set of options appearing repeatedly for one participant, which is a problem for both usability and data integrity.
Verdict: the cheapest paid route to the format on this list, and the free tier is too limited to rank anything.
8. Alchemer 🔴
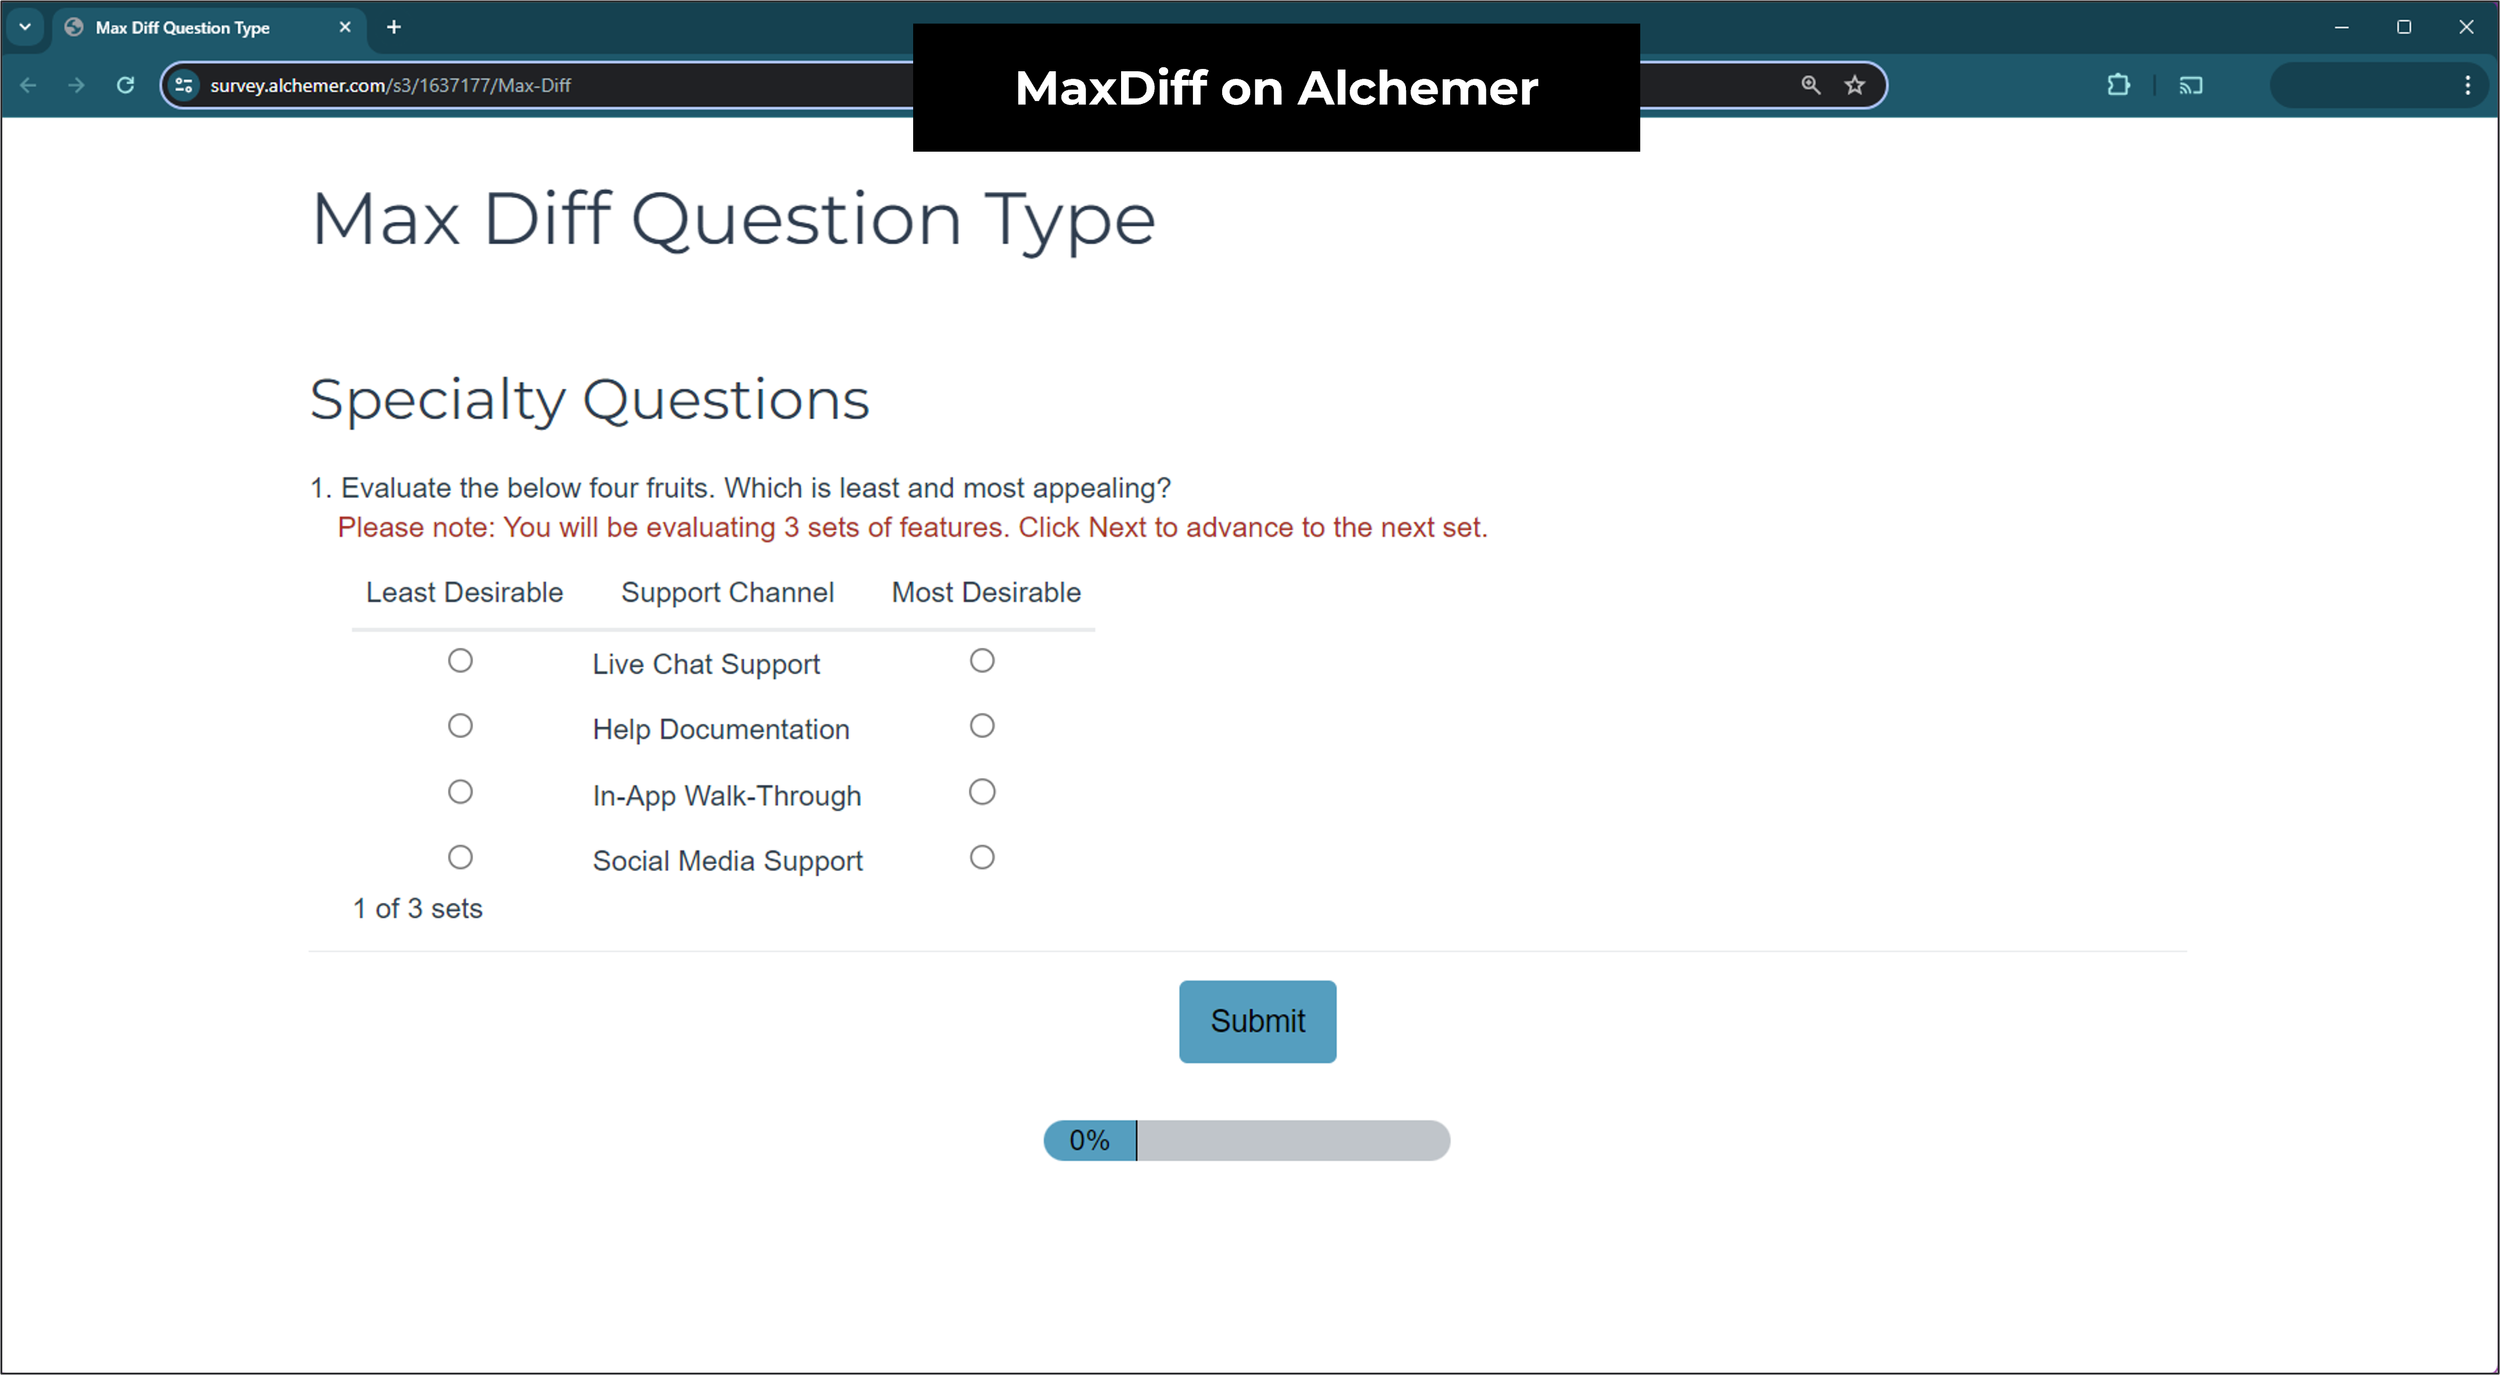
Alchemer, formerly SurveyGizmo, describes itself as providing tools that rival Qualtrics at a price closer to SurveyMonkey. Best-worst sits only on their Full Access plan, their most expensive tier, with no free trial. Full Access is capped at three users, beyond which you negotiate a custom enterprise contract.
Verdict: top tier only, three-user ceiling, no trial.
9. Q Research Software / Displayr 🔴
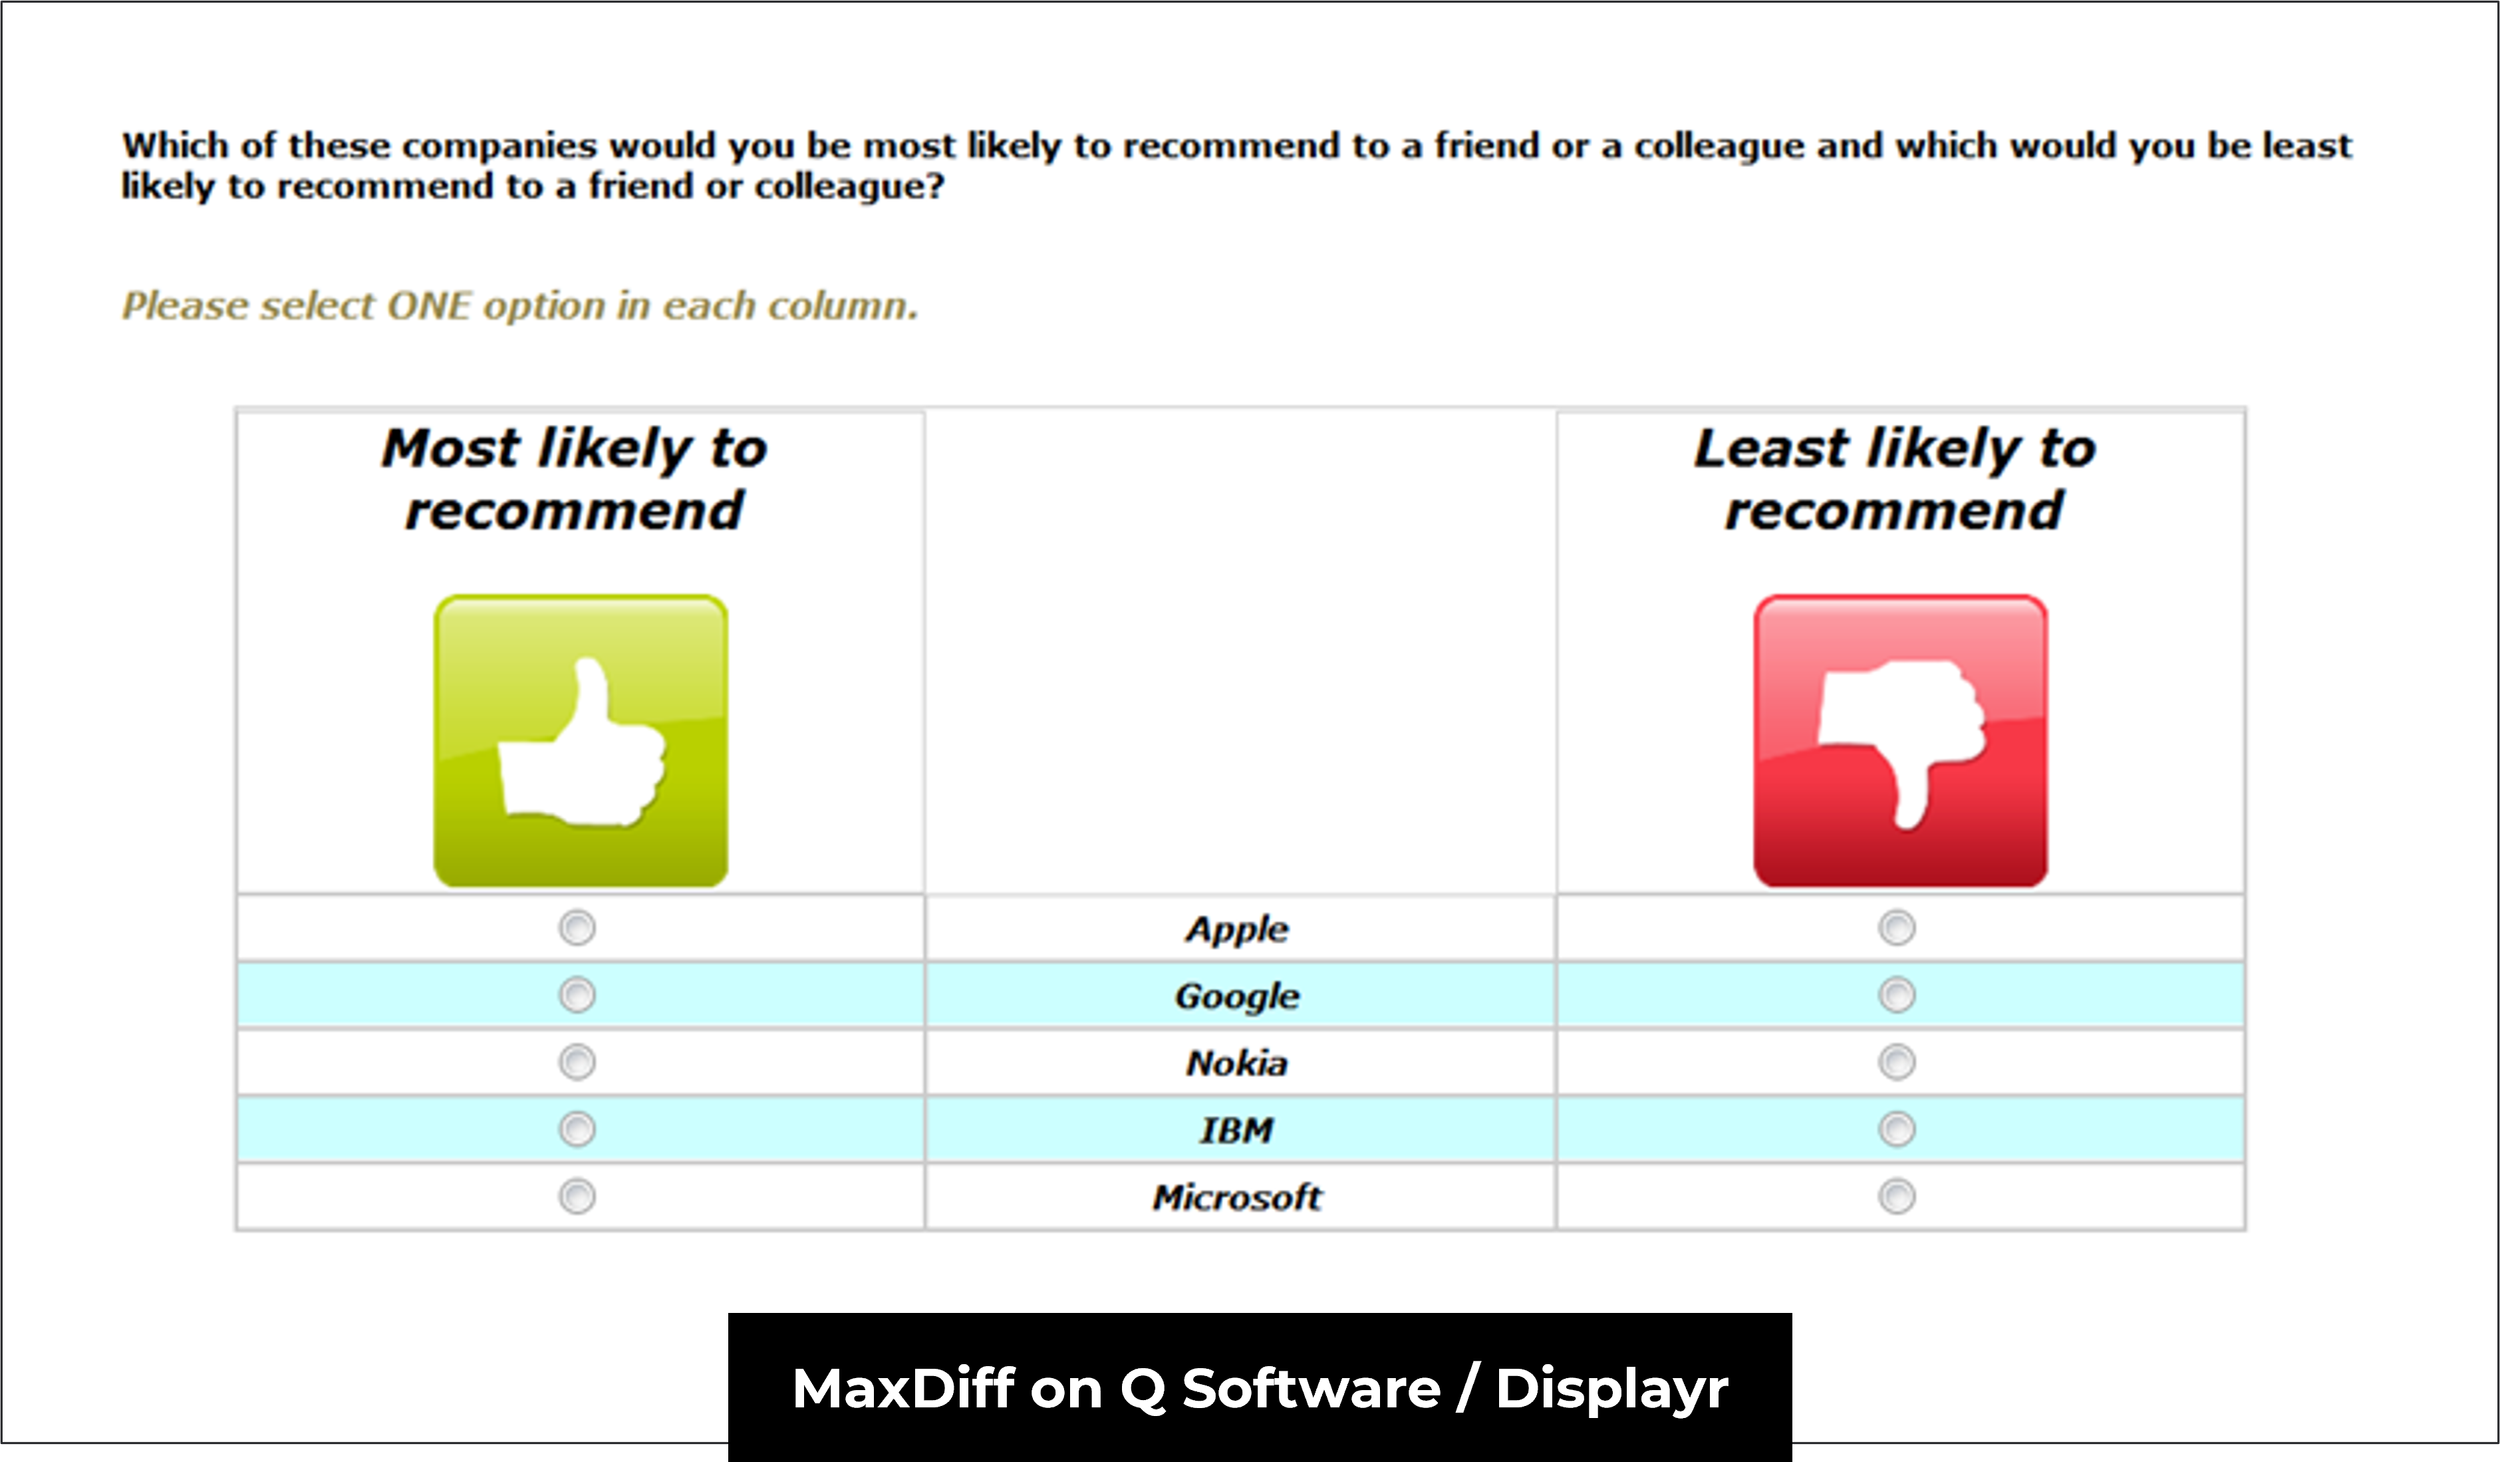
Q Research Software is a data analysis and reporting tool built for traditional market researchers, part of Displayr's portfolio. It offers specialised functionality for that audience, including automated data cleaning, formatting and statistical testing.
There's no free tier and no publicly available demo of their best-worst tool. You have to buy a licence first.
Verdict: genuinely good analysis software for professional market researchers, sold in a way that makes evaluation impossible.
4 alternatives to best-worst ranking
Four other survey methods do a similar job.
| Method | Options per screen | Use it when |
|---|---|---|
| Pairwise comparison | 2 | Very long lists, or ranking images |
| Ranked choice voting | All of them | Short lists of 6 to 10 options |
| Points allocation | All of them | You need magnitude, not just order |
| Conjoint analysis | Multi-variable profiles | Ranking features and their levels together |
Alternative 1: Pairwise comparison
Pairwise comparison ranks a list by comparing options in head-to-head pair votes. Counting how often an option wins measures preferences from best to worst.
It works almost identically, just with two options instead of 3 to 6. Every pair produces a best, being the chosen option, and a worst, being the loser. Pairwise comparison on OpinionX takes unlimited ranking options and can also rank images.

^ Pairwise Comparison voting and results on an OpinionX survey
Alternative 2: Ranked choice voting
Ranked choice voting hands each participant the full list and asks them to place the options in order. It's the simplest of the four alternatives, with one limit: keep rank order questions to 6 to 10 statements at most. Beyond that, move to best-worst or pairwise comparison, both of which handle long lists better.
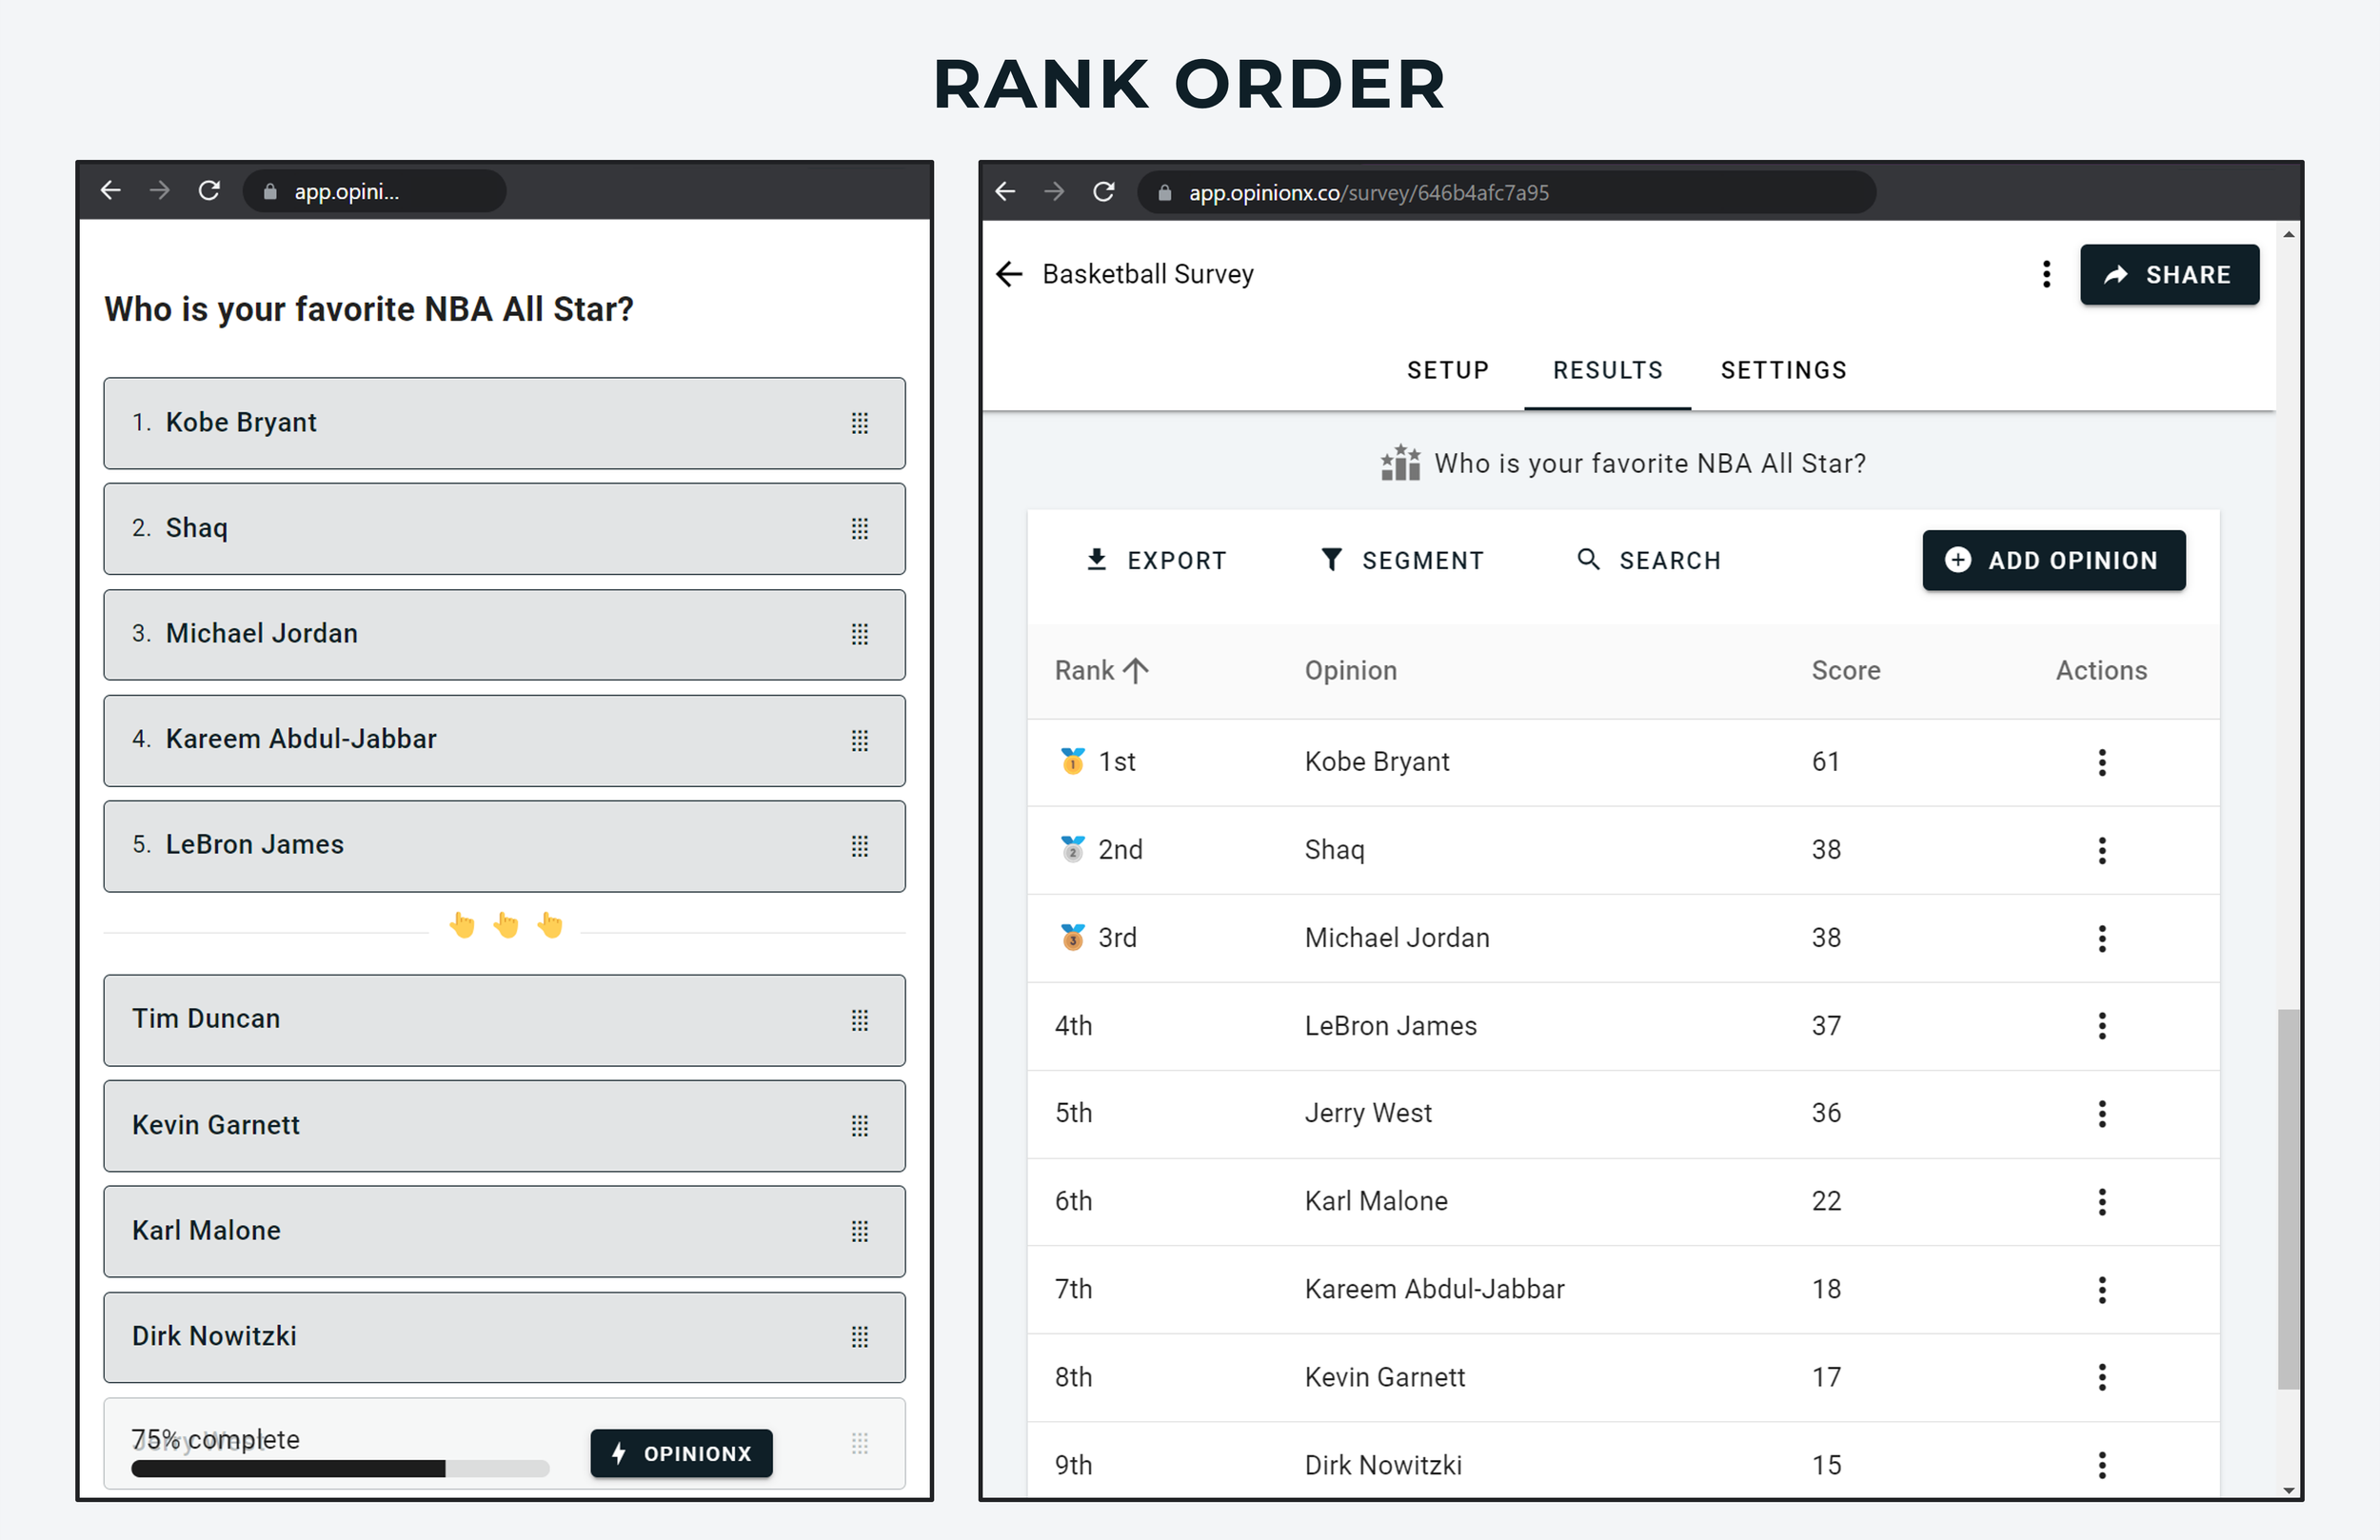
^ “Order Rank” voting format and results on OpinionX
Alternative 3: Points allocation, or constant sum
Best-worst and pairwise comparison both score options relative to each other, without telling you whether the list itself is any good in absolute terms.
Points allocation fixes that. Each participant gets a pool of credits to distribute across the options however they want, which shows the magnitude of a preference and not only its order. Simon gives apples 9 of his 10 points, which tells you how far ahead of bananas they sit.
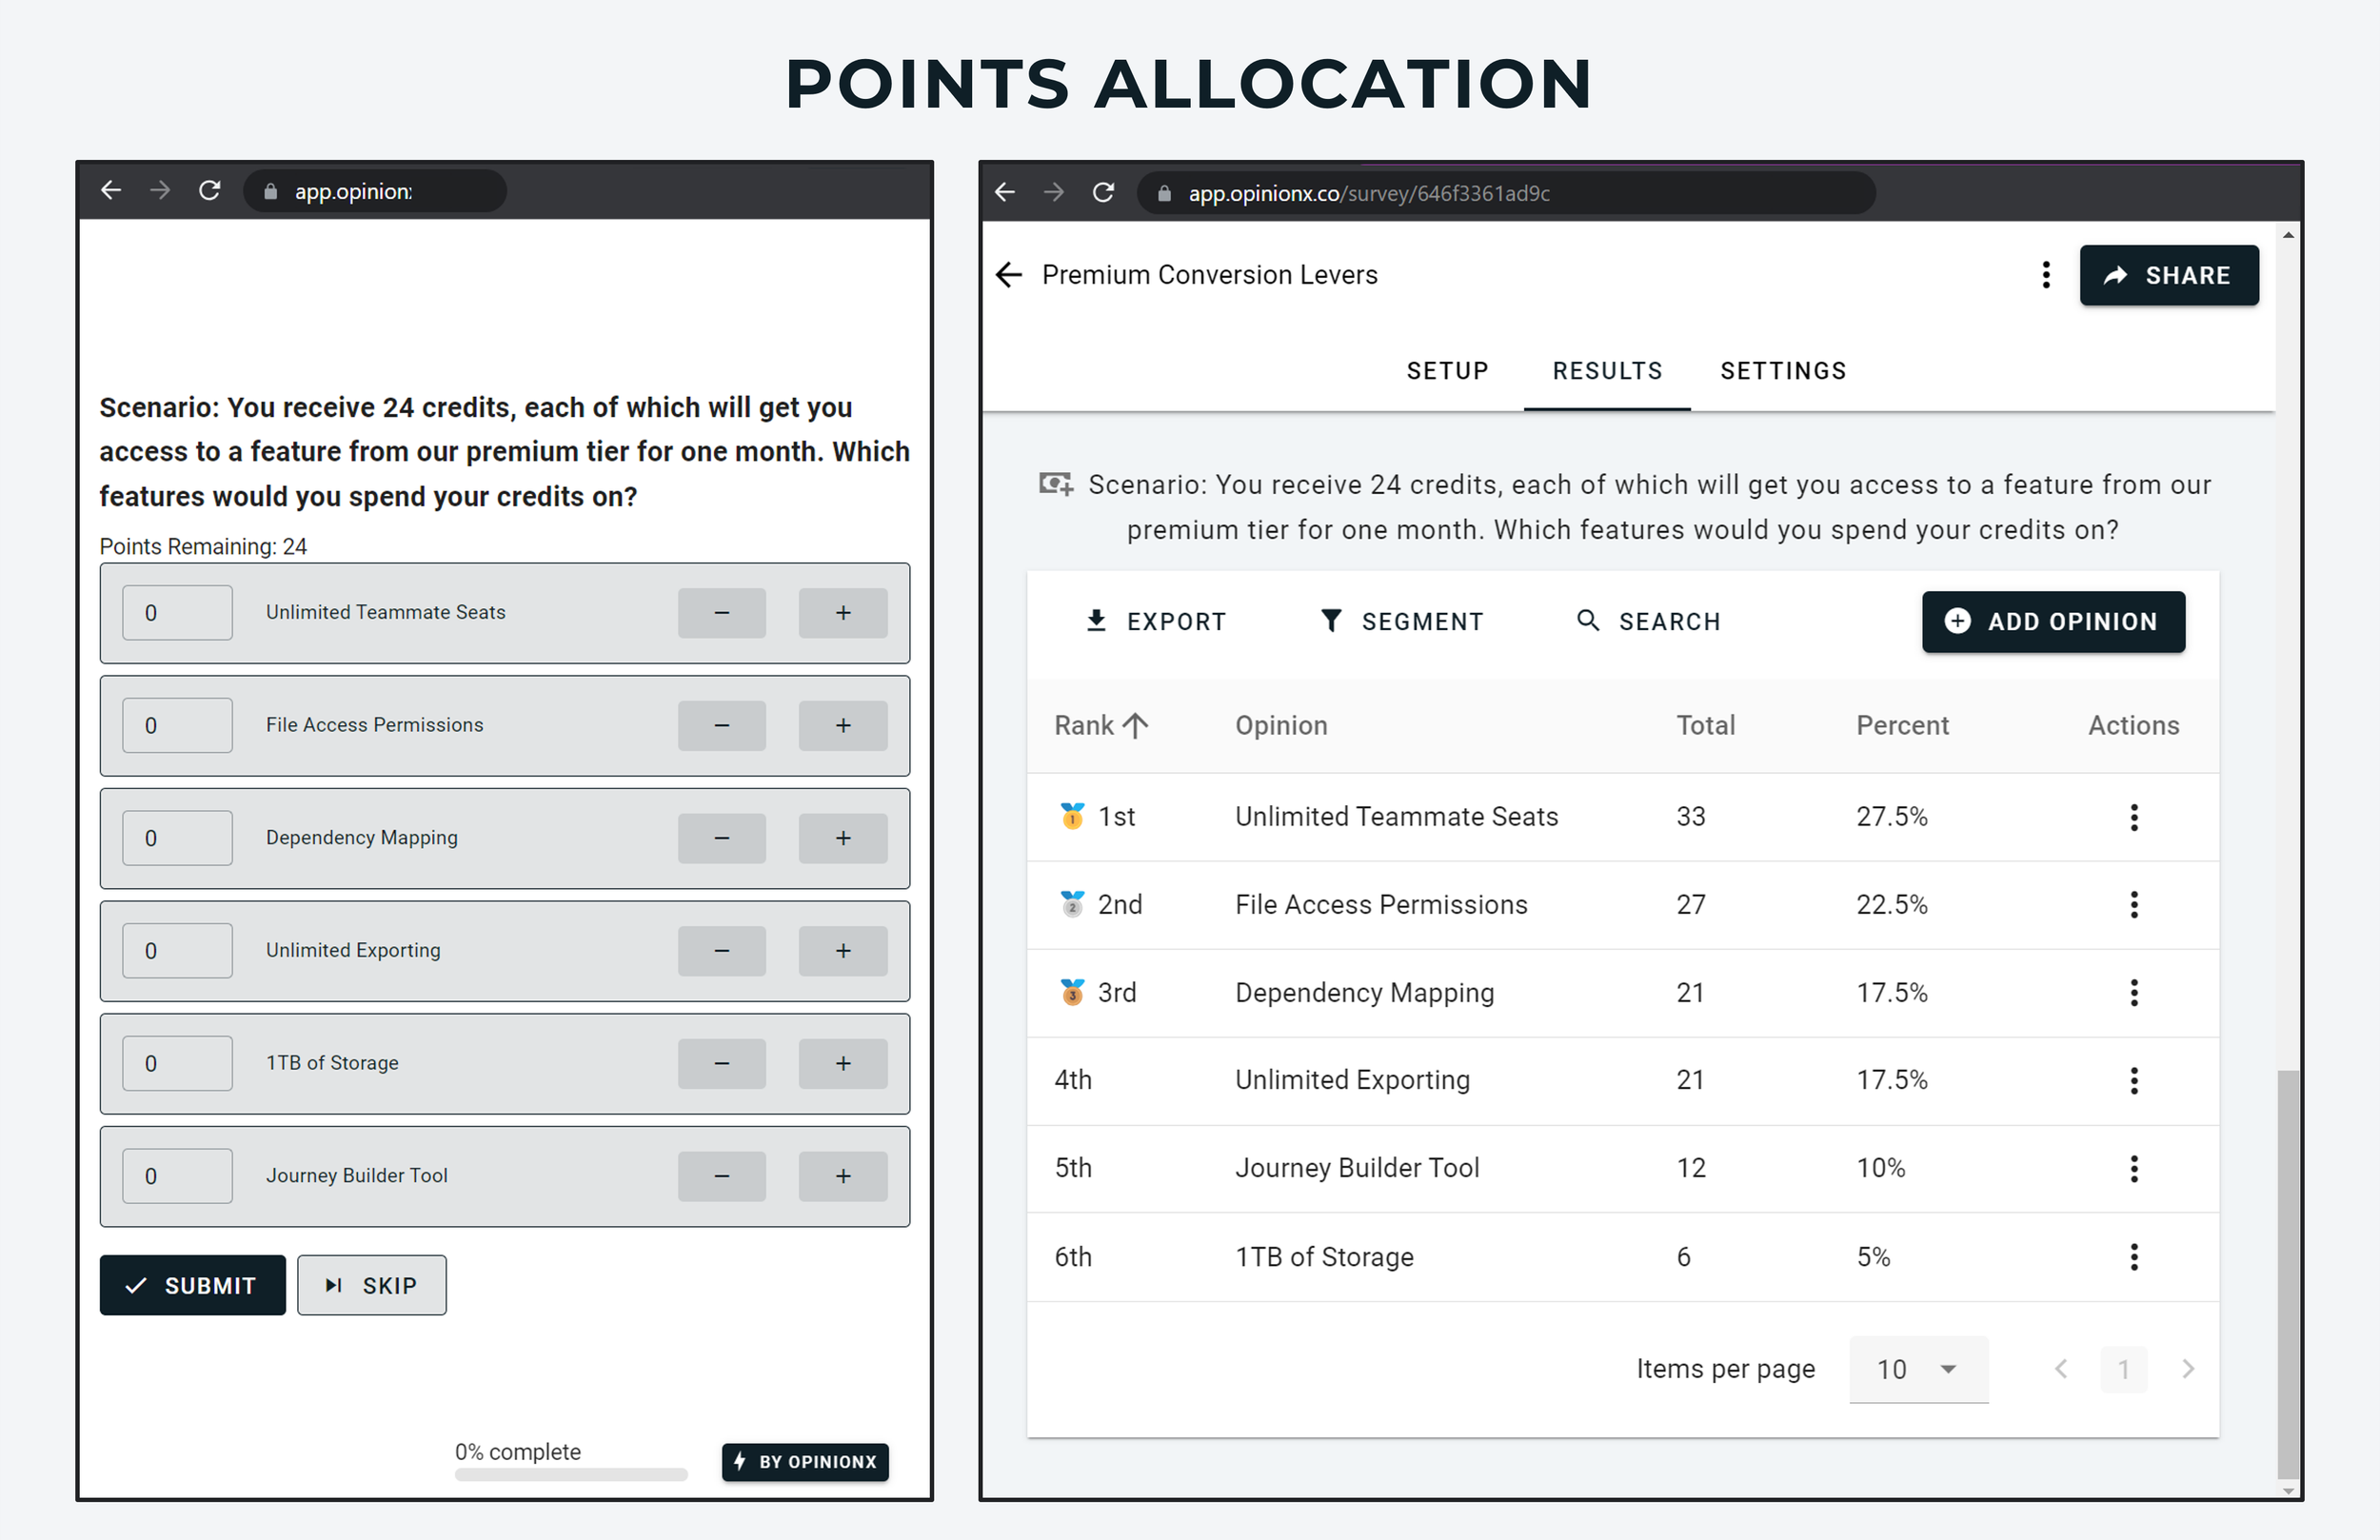
^ Points Allocation voting and results on an OpinionX survey
Alternative 4: Conjoint analysis
Conjoint analysis is a multi-factor ranking method where participants vote on profiles containing several variables at once. It works out how important different aspects of a product are within the overall offering.
Conjoint will rank the importance of a phone's battery life, storage and colour, while simultaneously ranking the individual colours: black, white, rose gold.
That makes it more complex than best-worst, and a good deal more expensive elsewhere. Our breakdown of conjoint analysis tools covers what the market charges, and when not to use conjoint analysis covers where the method is the wrong choice. Conjoint is available on OpinionX, on the free tier alongside every other method.
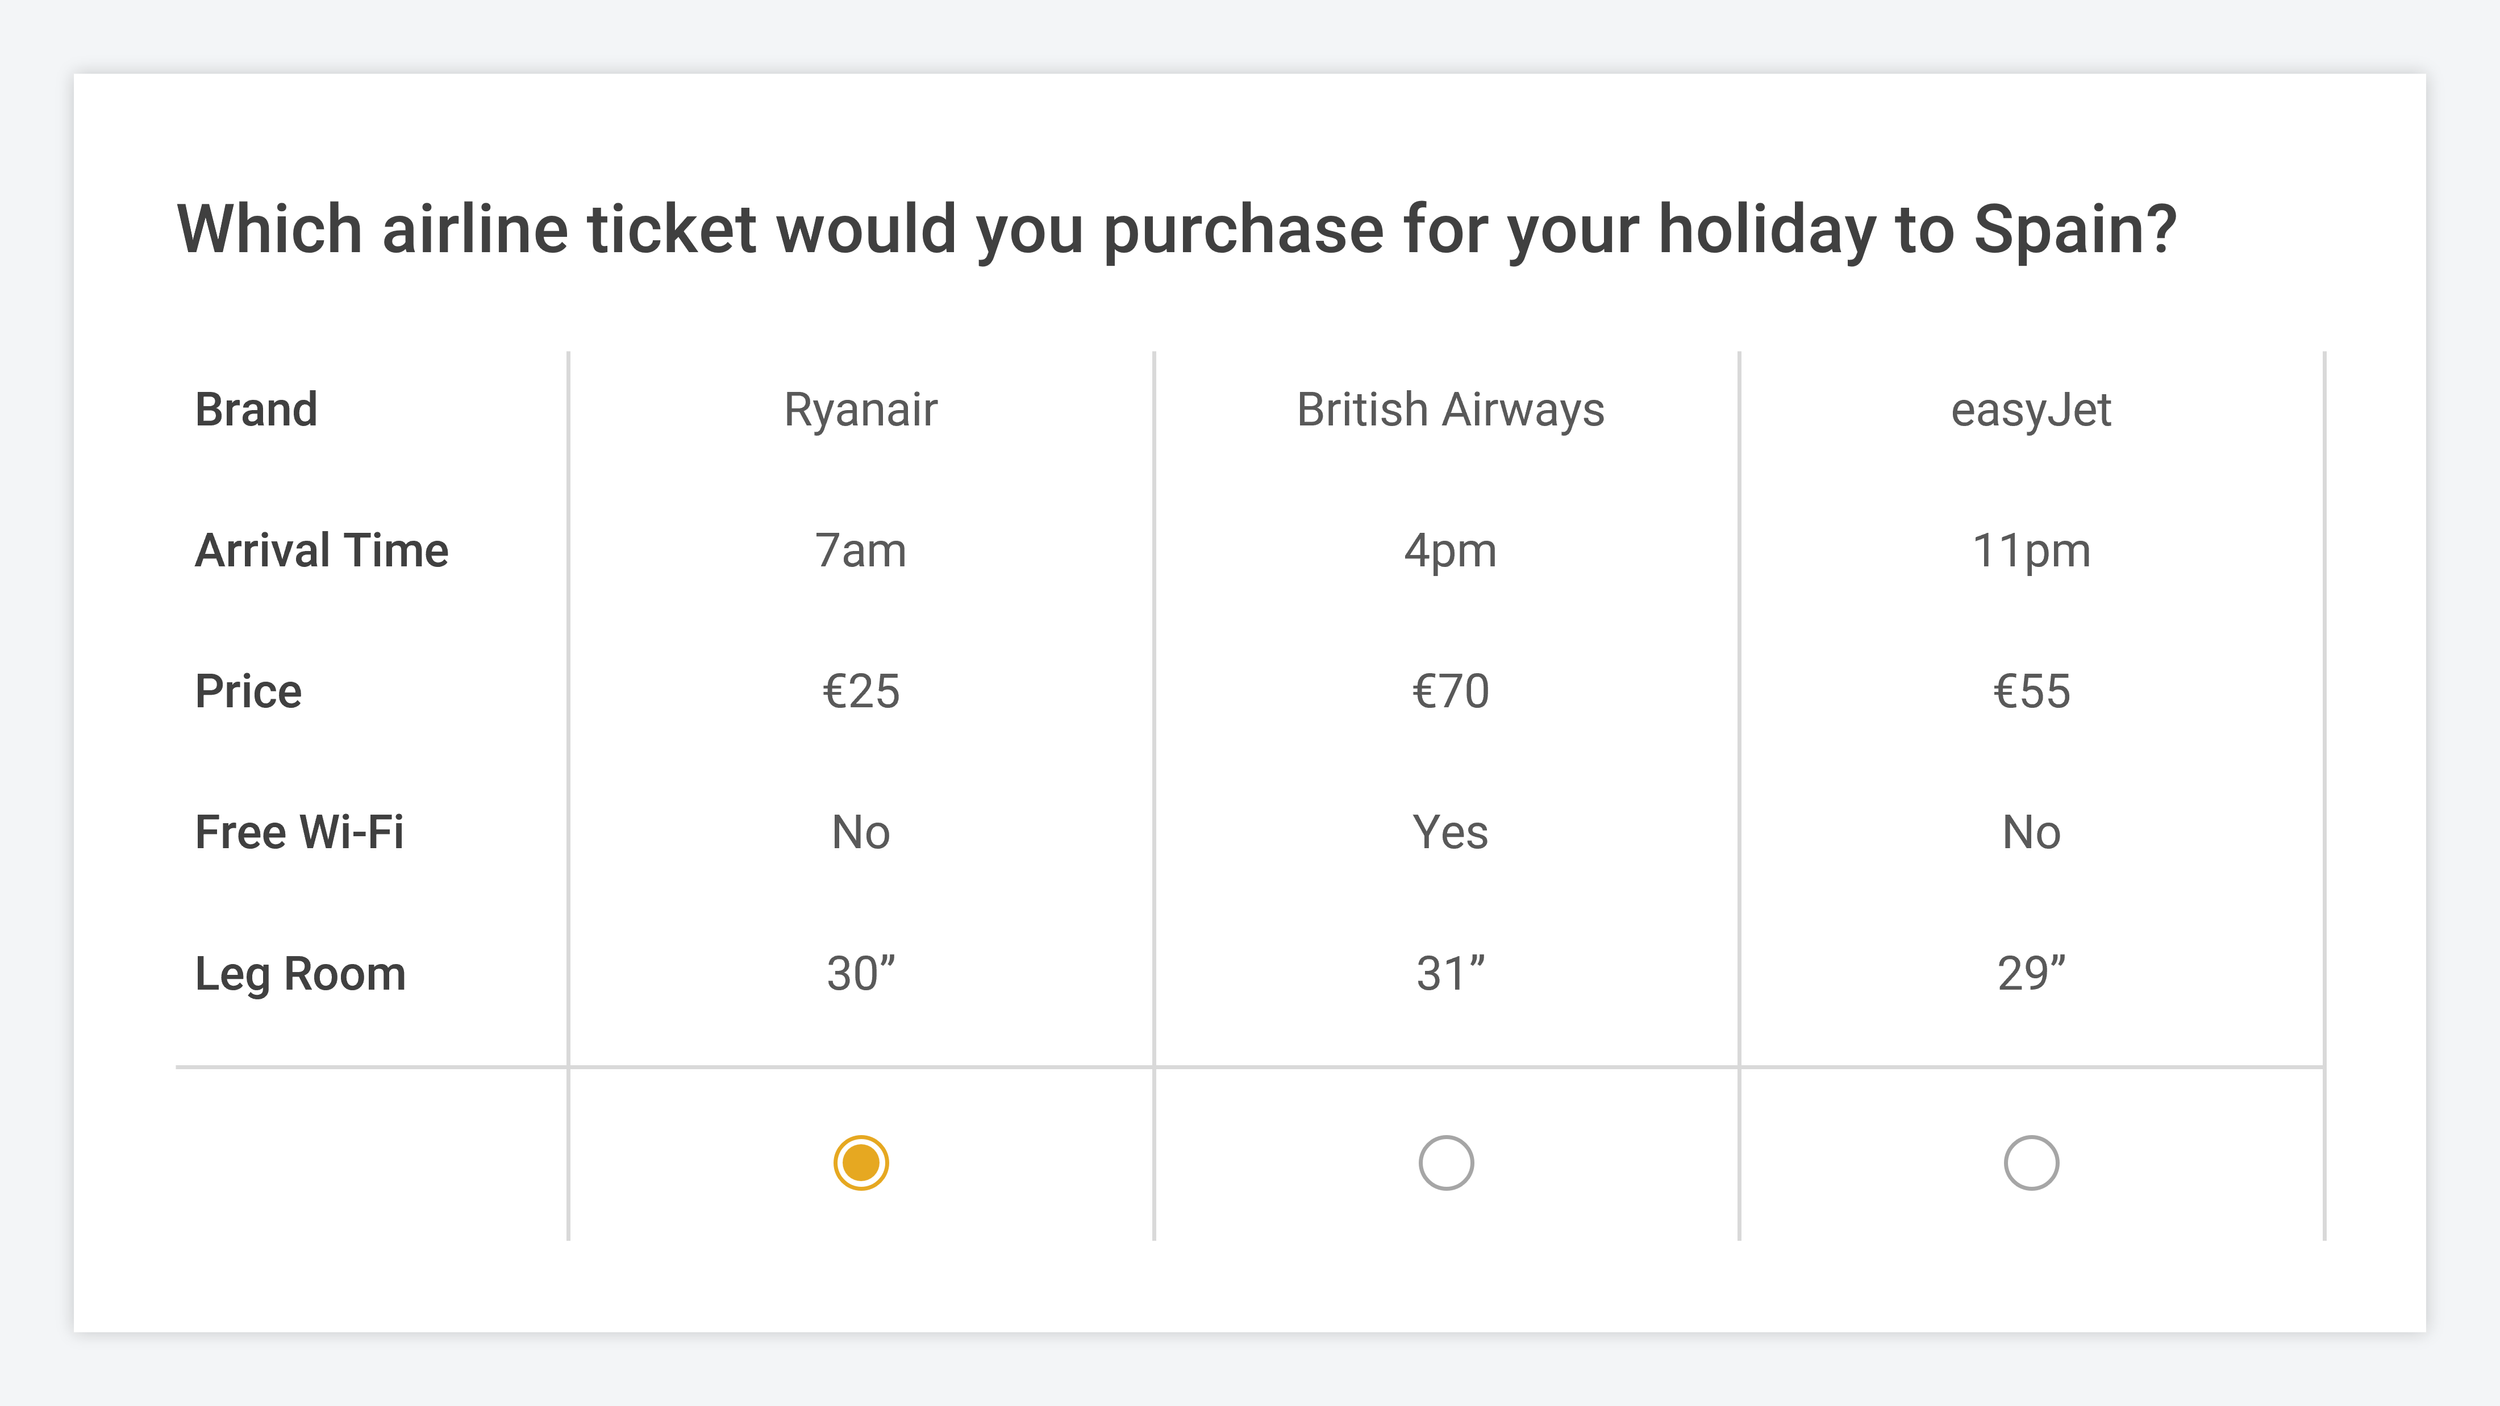
^ Example of a typical Conjoint Analysis question
Frequently asked questions
What is best-worst scaling in simple terms?
It's a survey method that shows people a small group of options, usually 3 to 6, and asks which is best and which is worst. Repeating that across different groups produces a full ranking of the whole list, with a score for each option.
How is best-worst calculated?
The most common approach is aggregate scoring: (best-worst)/appearances. Subtract an option's worst votes from its best votes, then divide by how many times it appeared. An option seen 100 times, picked best 50 times and worst 15 times, scores 35%. Scores run from -100 to +100.
Is best-worst scaling the same as MaxDiff?
No. MaxDiff describes a data collection method where participants pick the two options with the greatest difference in preference. Best-worst scaling describes the output, a scale sorted from best to worst, which pairwise comparison, ranked choice voting and conjoint analysis can also produce. Academia has separated the two since 2005, though the terms get used interchangeably everywhere else.
How many participants do you need?
There's no fixed minimum, despite the commonly cited figure of 100. The number depends on your configuration, calculated with rx/np = s, where each option should appear at least 200 times across the survey. A 30-option survey showing 4 options per set to 80 participants needs 19 sets each.
Is there a free best-worst scaling tool?
OpinionX offers the full method on its free tier, capped at 25 participants per survey, with the sample size calculator and segmentation analysis included. SurveyKing has a free version limited to three ranking options, which is a design preview and not a working survey. Every other tool covered in this guide is paid-only.
Over 42,000 researchers and product people get one method breakdown like this each week in The Full-Stack Researcher.
Run a best-worst survey with the sample size calculator, the segmentation analysis and every question type unlocked. The free tier caps at 25 participants per survey, which is enough to validate the design and read real results before deciding whether to pay.