
Competing Values Framework: Methods, Tools, Templates
“The Competing Values Framework maps organisational culture on a 2x2 built from two tensions: internal against external focus, and stability against flexibility. The four quadrants that fall out of it are Collaborate, Create, Compete and Control. This guide covers where the framework came from, how to run an assessment, how to analyse the results, and how to segment them by team.”
The Competing Values Framework (CVF) is one of the most widely used academic theories for understanding how organisations behave. It uses a 2x2 matrix to map an organisation's culture in a way that is both simple and empirically validated, which lets leaders plan how to change that culture over time. Quinn and Rohrbaugh's original paper appeared in Management Science in 1983, building on their 1981 work, and it remains one of the most cited models in the study of organizational culture.
What is the Competing Values Framework?
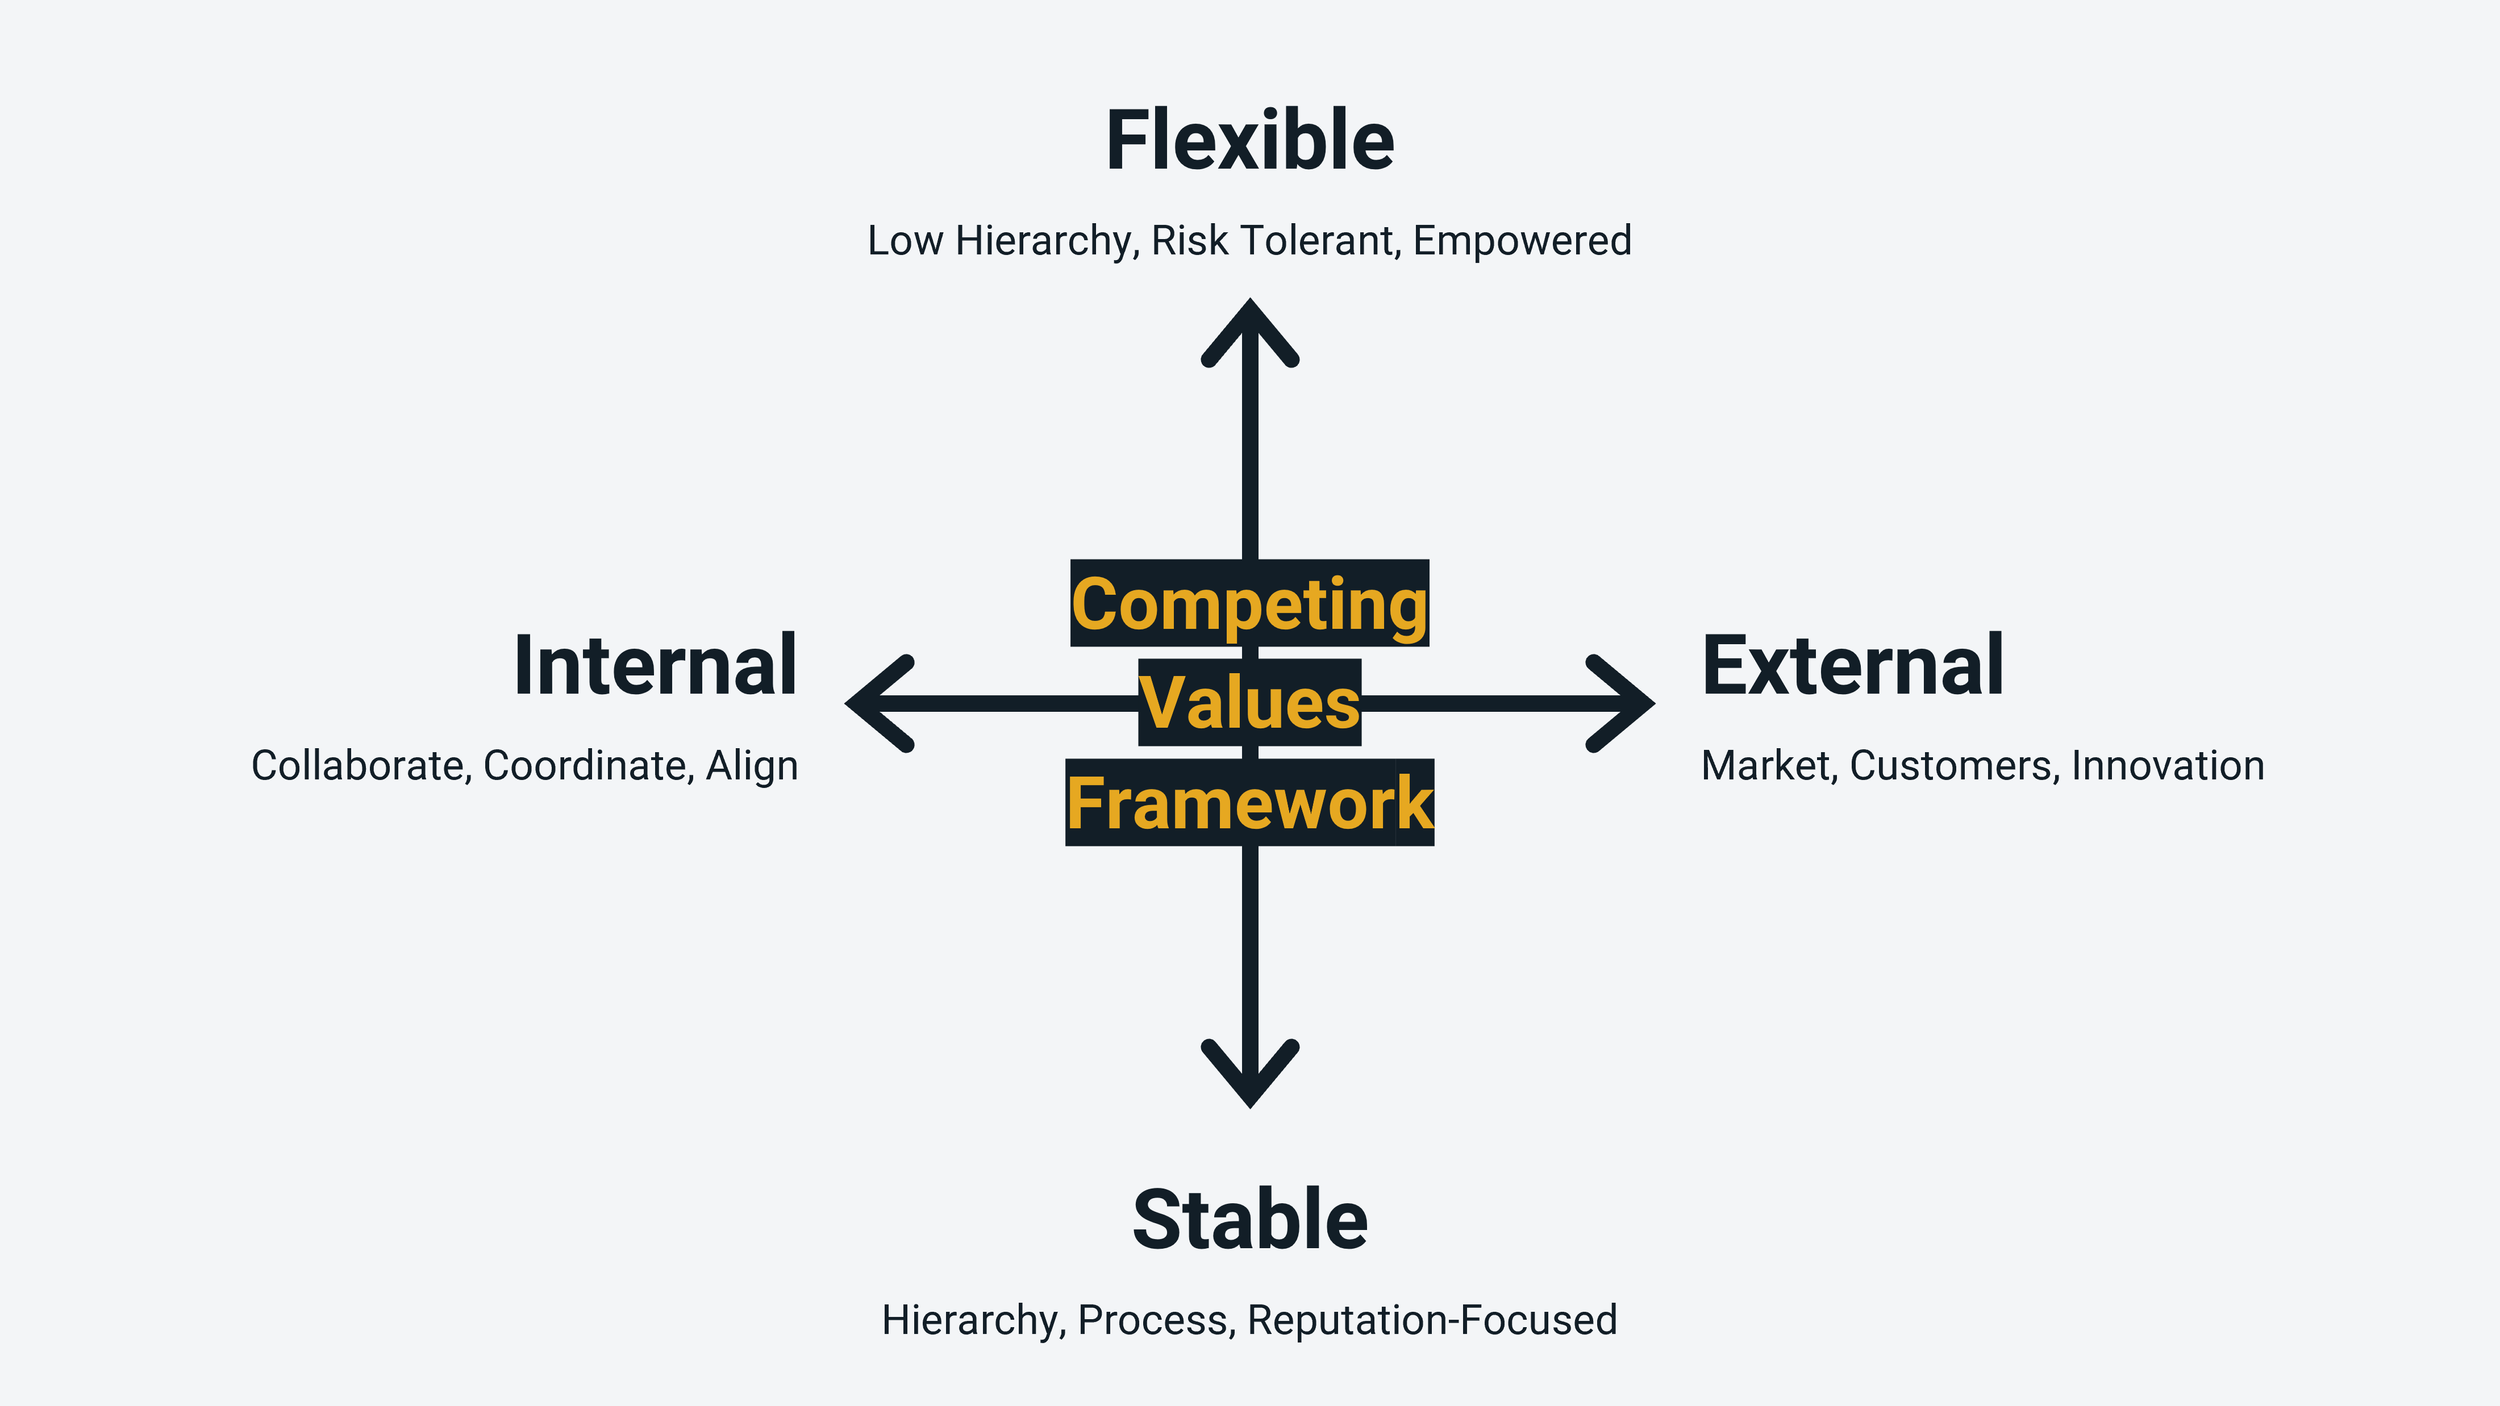
The Competing Values Framework states that there are two main sources of tension inside every organisation: internal against external focus, and stable against flexible operation.
Internal against external. An internally dominant culture focuses on collaborating, coordinating and developing employees. An externally dominant culture focuses outward, on technological change, customer needs and competitor activity. Stable markets tend to encourage internal focus, and volatile markets push companies towards external orientation.
Stable against flexible. A culture prioritising stability builds clear hierarchies, planning and budgeting processes, and a reputation for reliability. A culture prioritising flexibility favours adaptability and a bias for action, risk-taking and experimentation, and empowered teams with less hierarchy.
Those two pairs are the competing values the framework is named after. Map them on a 2x2 and four cultural archetypes appear.
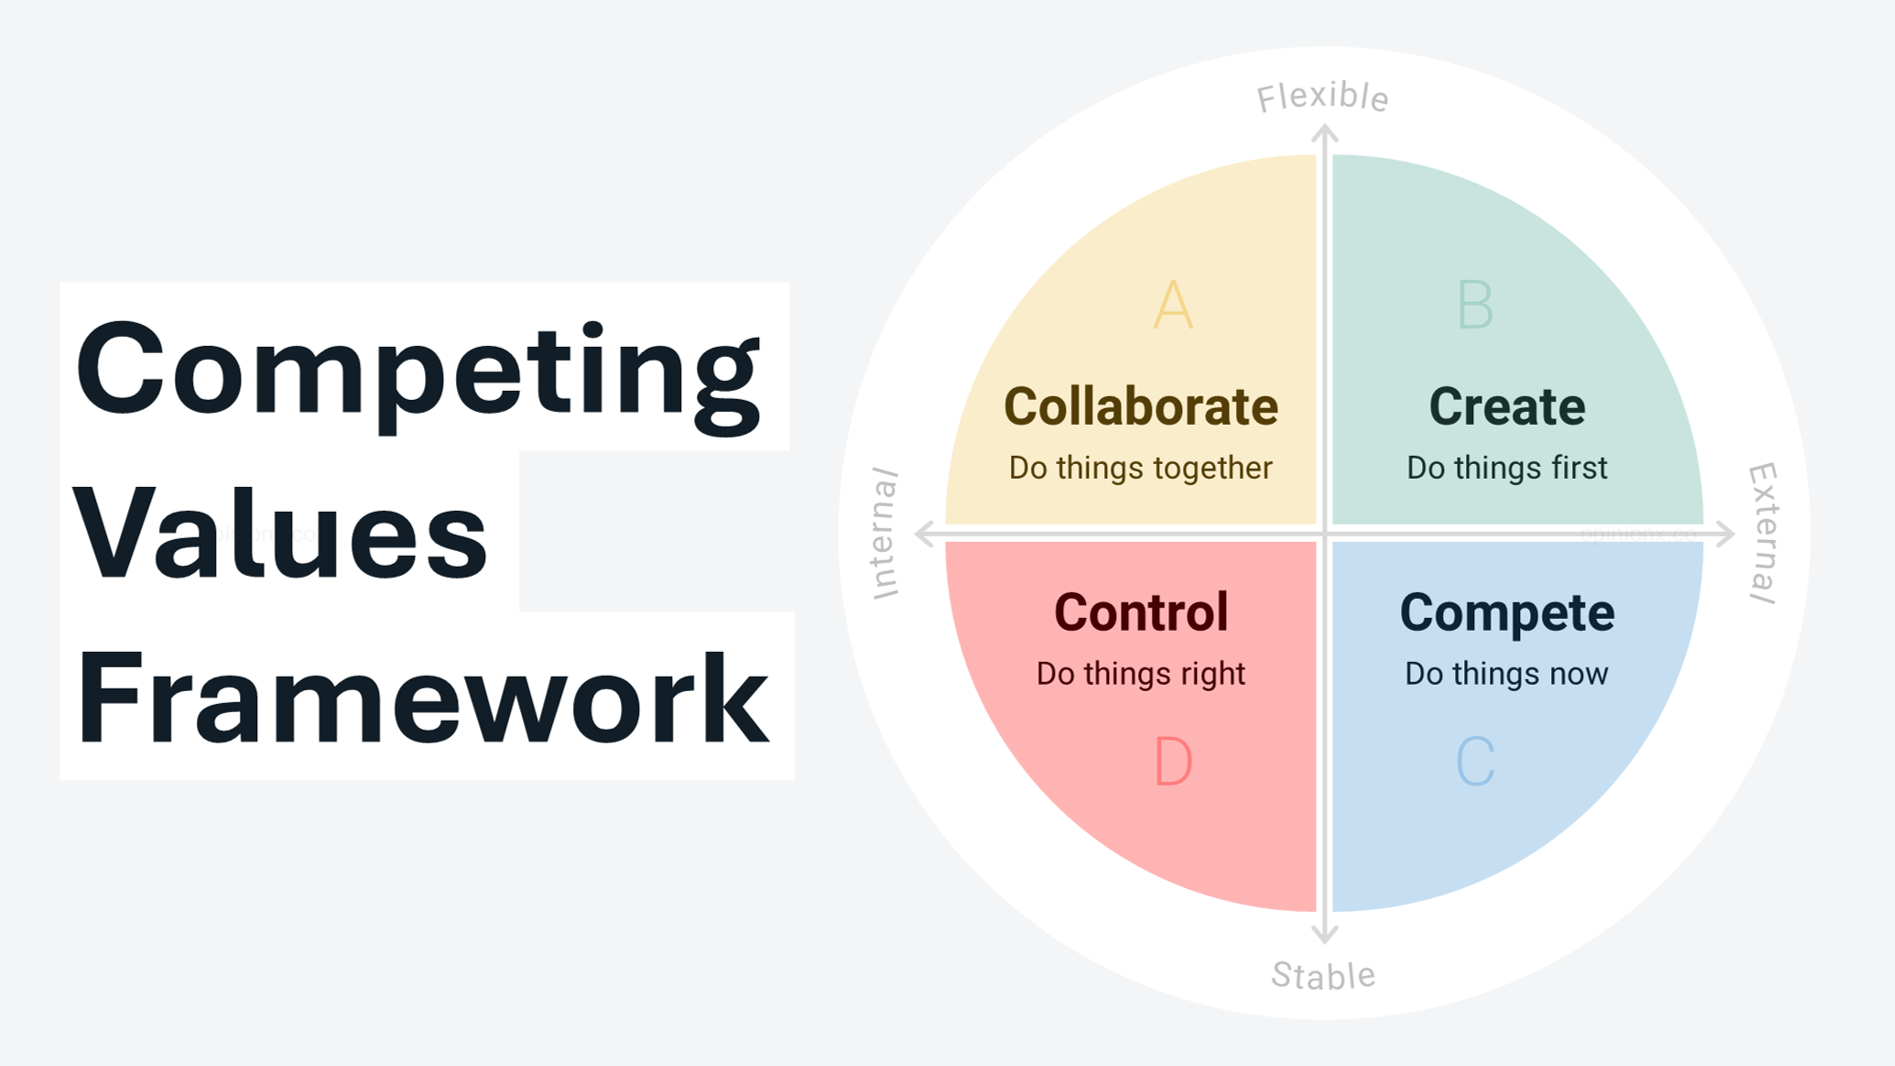
The four culture types
Flexible + Internal = Collaborate. People-focused organisations with a family-like atmosphere that promotes teamwork, participation and decision-making by consensus. Associated with healthcare, education and non-profits.
Flexible + External = Create. Risk-taking and innovative companies that break established rules and paint a vision of a better future for their teams to pursue. Associated with tech startups.
Stable + External = Compete. Moves fast, thrives on process, and focuses on ambitious targets. Results are the currency and winning is the goal. Associated with professional services, consumer goods and larger tech companies.
Stable + Internal = Control. Formal, structured and hierarchical. Formal rules are the norm, reliability is essential, and errors are not taken lightly. Often seen as conservative and cautious. Associated with military and banking.
How do you measure culture with the Competing Values Framework?
The Competing Values Framework was a theoretical concept when Robert E. Quinn and John Rohrbaugh first published it in 1981. Turning it into a usable research method came later, when Quinn worked with Kim Cameron to produce the Organizational Culture Assessment Instrument (OCAI).
The OCAI is a survey template based on the framework that measures how a company's culture compares against the four archetypes. It has six main questions where employees allocate 100 points across four statements, each statement representing one archetype. Averaging the share of points each archetype receives gives you a map of how employees perceive the organisation. The mechanics are the same as any points allocation ranking.
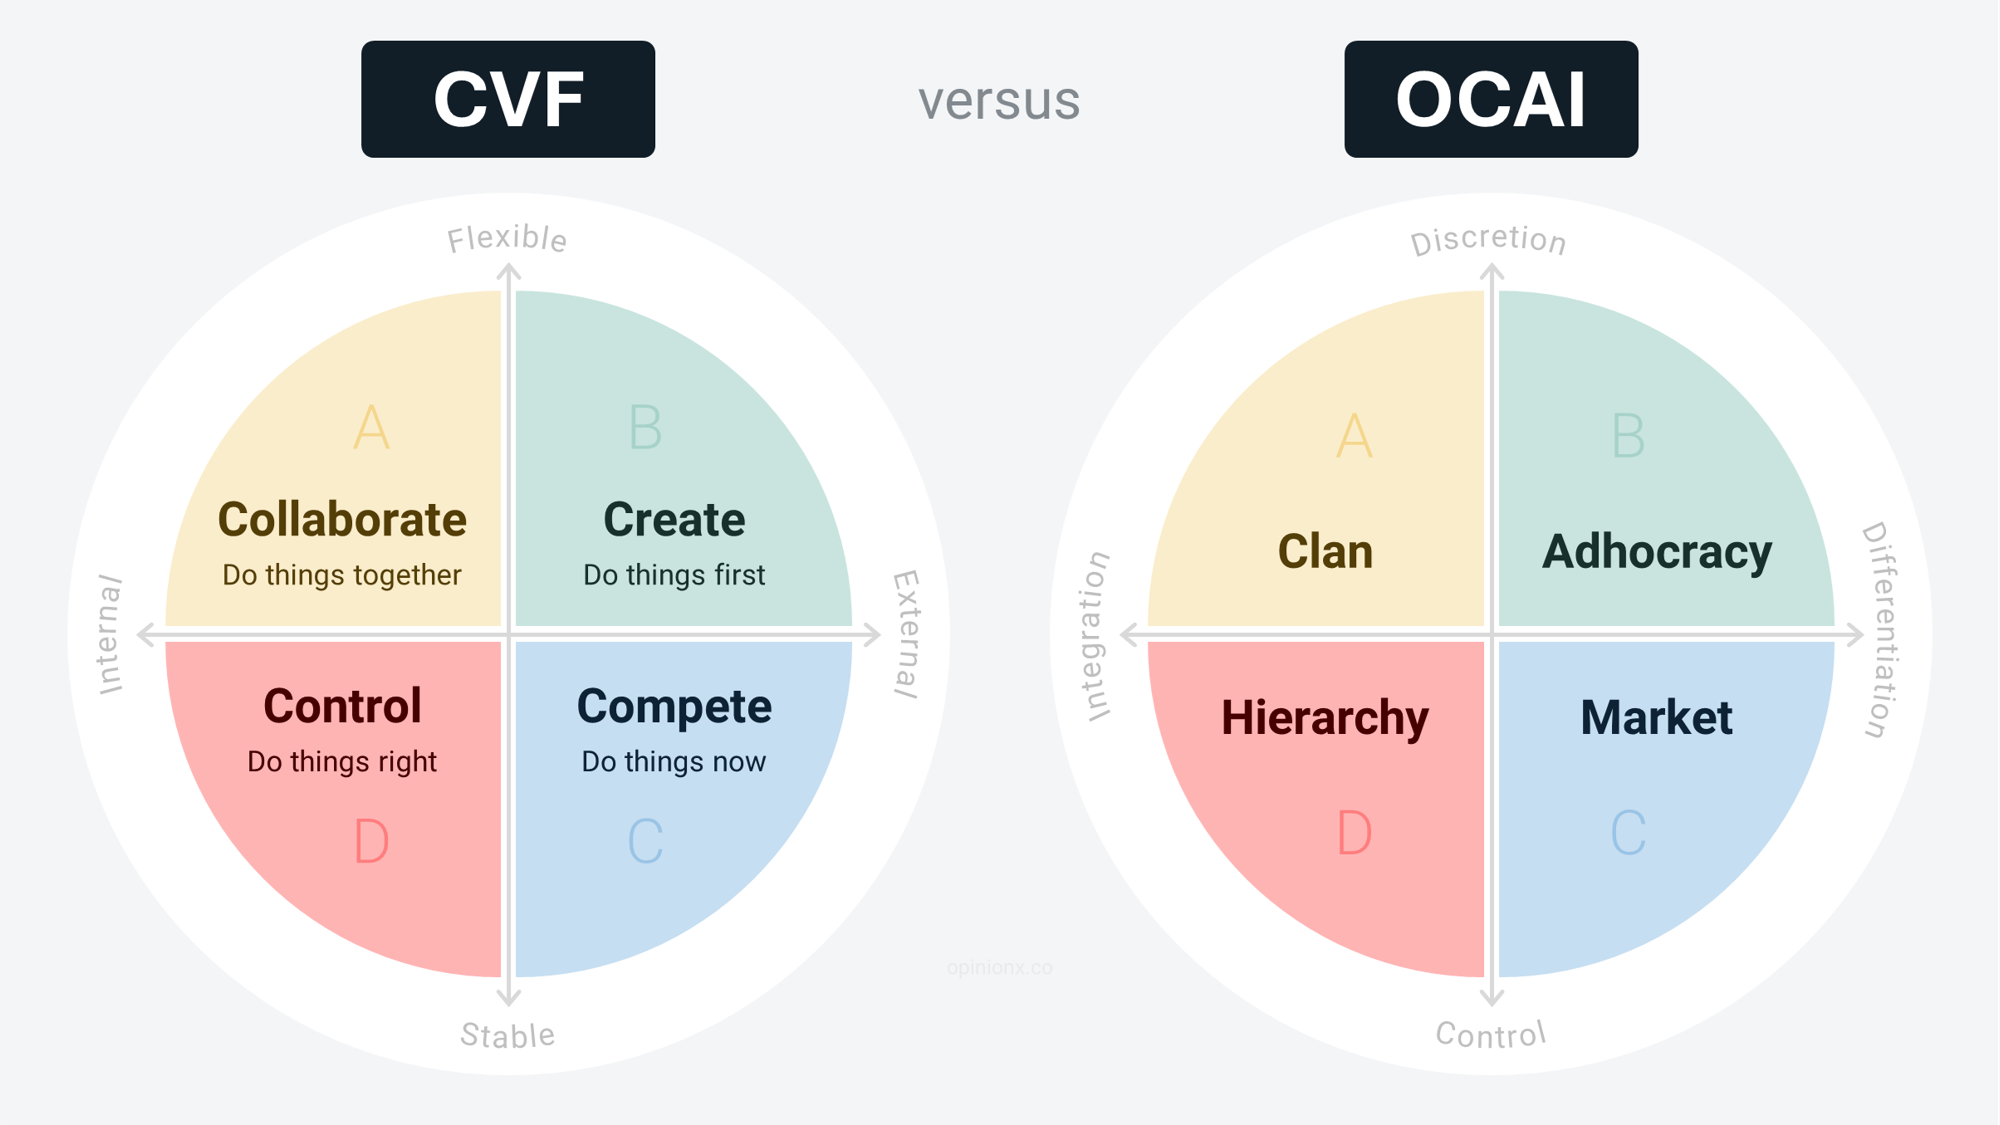
On terminology. In academia, CVF is the theory and OCAI is the practical assessment built on it. In commercial settings the two get used interchangeably. This guide mostly uses the CVF terms.
Implementing the OCAI
The OCAI uses six questions, each focused on a different aspect of how the organisation functions. For each one, participants distribute 100 points across four statements, one per archetype.
Here is what points-based voting looks like using the Points Rank format on an OpinionX survey:
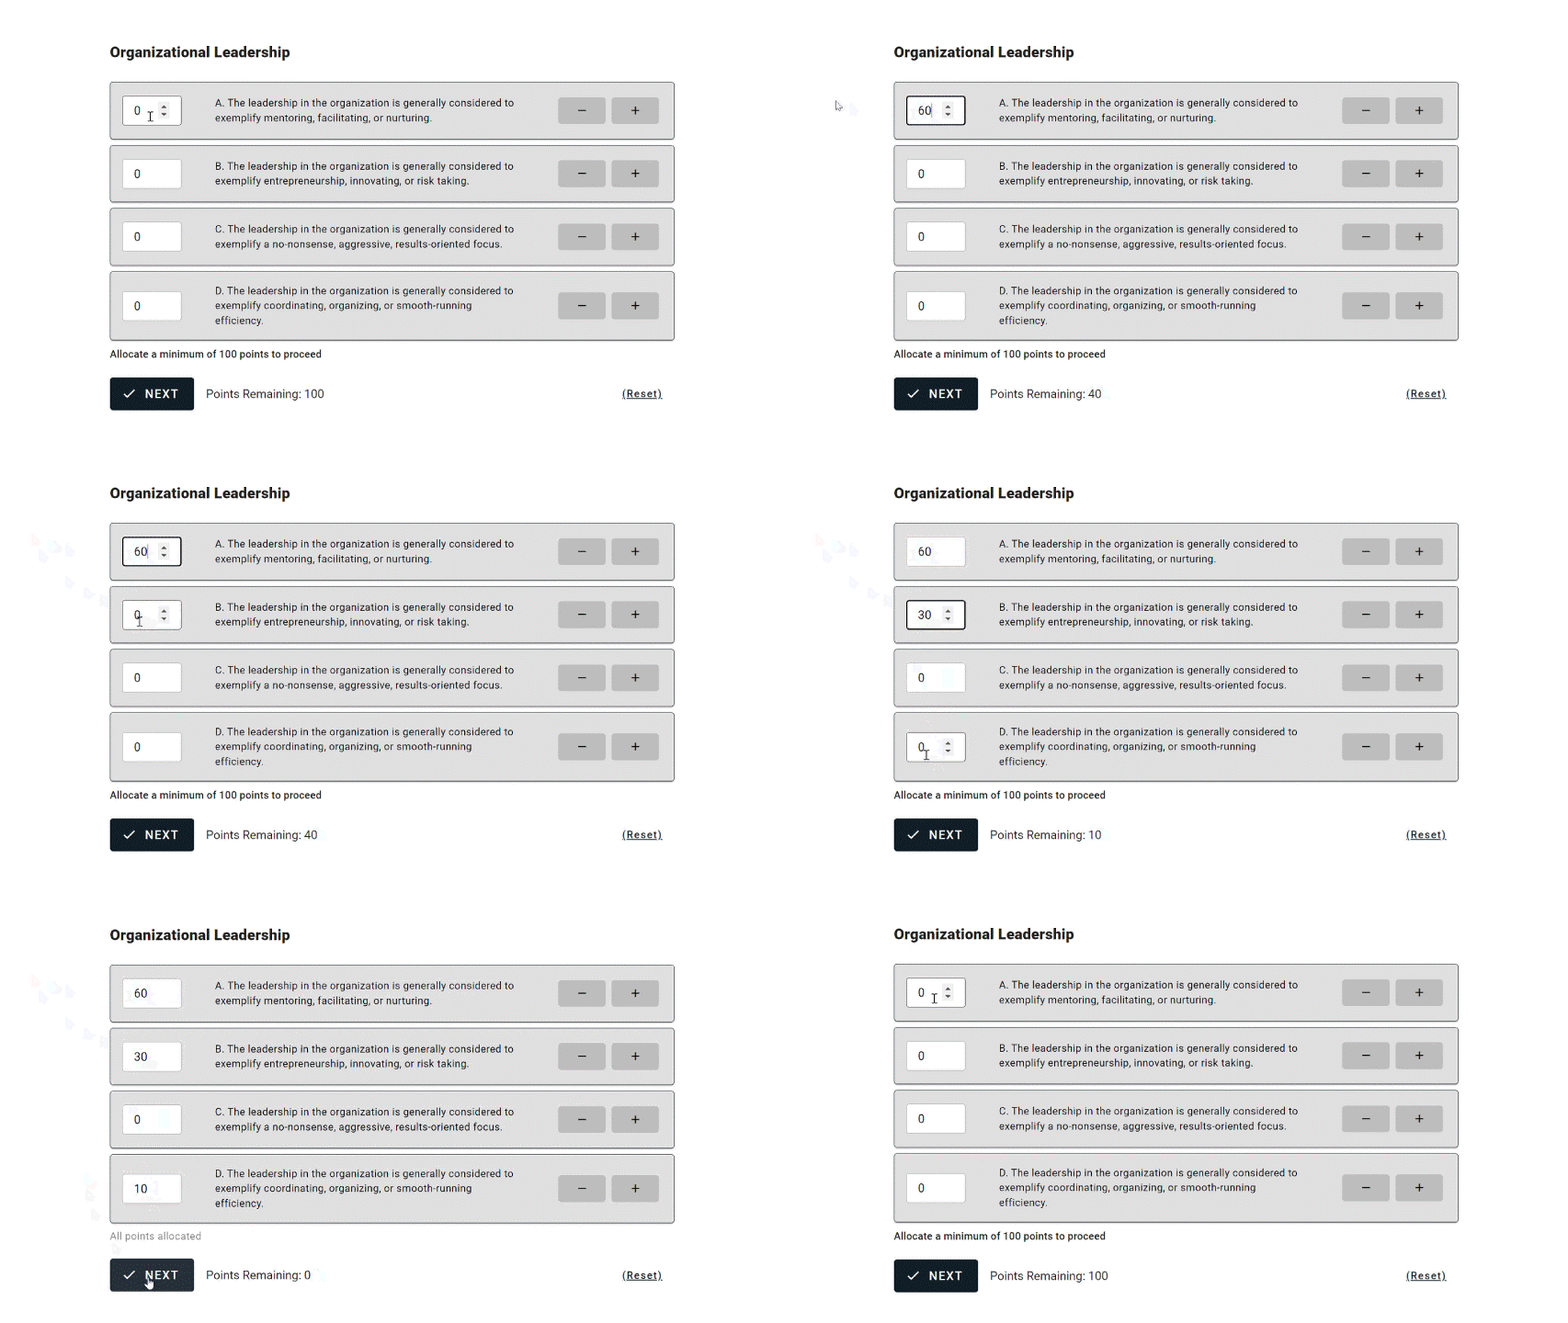
The six dimensions the instrument measures:
| Dimension | What it asks about |
|---|---|
| 1. Dominant characteristics | What the place feels like to work in |
| 2. Organizational leadership | What leaders are seen to exemplify |
| 3. Management of employees | How people are managed day to day |
| 4. Organization glue | What holds the organisation together |
| 5. Strategic emphases | What the organisation prioritises |
| 6. Criteria of success | How success gets defined |
Within each dimension, statement A represents Collaborate, B is Create, C is Compete and D is Control.
In a full OCAI survey, the six dimensions are completed twice. The first run-through covers the organisation's culture as it exists today. The second covers the preferred culture employees would like to see the company develop.
Best tools for running a Competing Values Framework assessment
The right format for an OCAI survey is points allocation, also called constant sum, which gives participants a pool of points to spend across a list according to their preferences.
Why not a 5-star rating or a Likert scale? Because rating formats let people score everything the same, such as giving all four statements five stars. Central tendency bias is the documented version of that problem. Points allocation introduces scarcity. A limited pool forces participants to compare the options, weigh the trade-offs, and spend on what they feel strongest about, which also suppresses survey straightlining.
OpinionX includes a Points Rank question type on the free tier, alongside unlimited surveys, unlimited questions and unlimited researcher seats, capped at 25 participants per survey. Paid plans start at $900 a year and remove that cap.
⬆️ Example of an OCAI culture assessment survey on OpinionX ⬆️
Analysing OCAI questionnaire results
When people complete your survey, you see the average percentage of points each statement received.
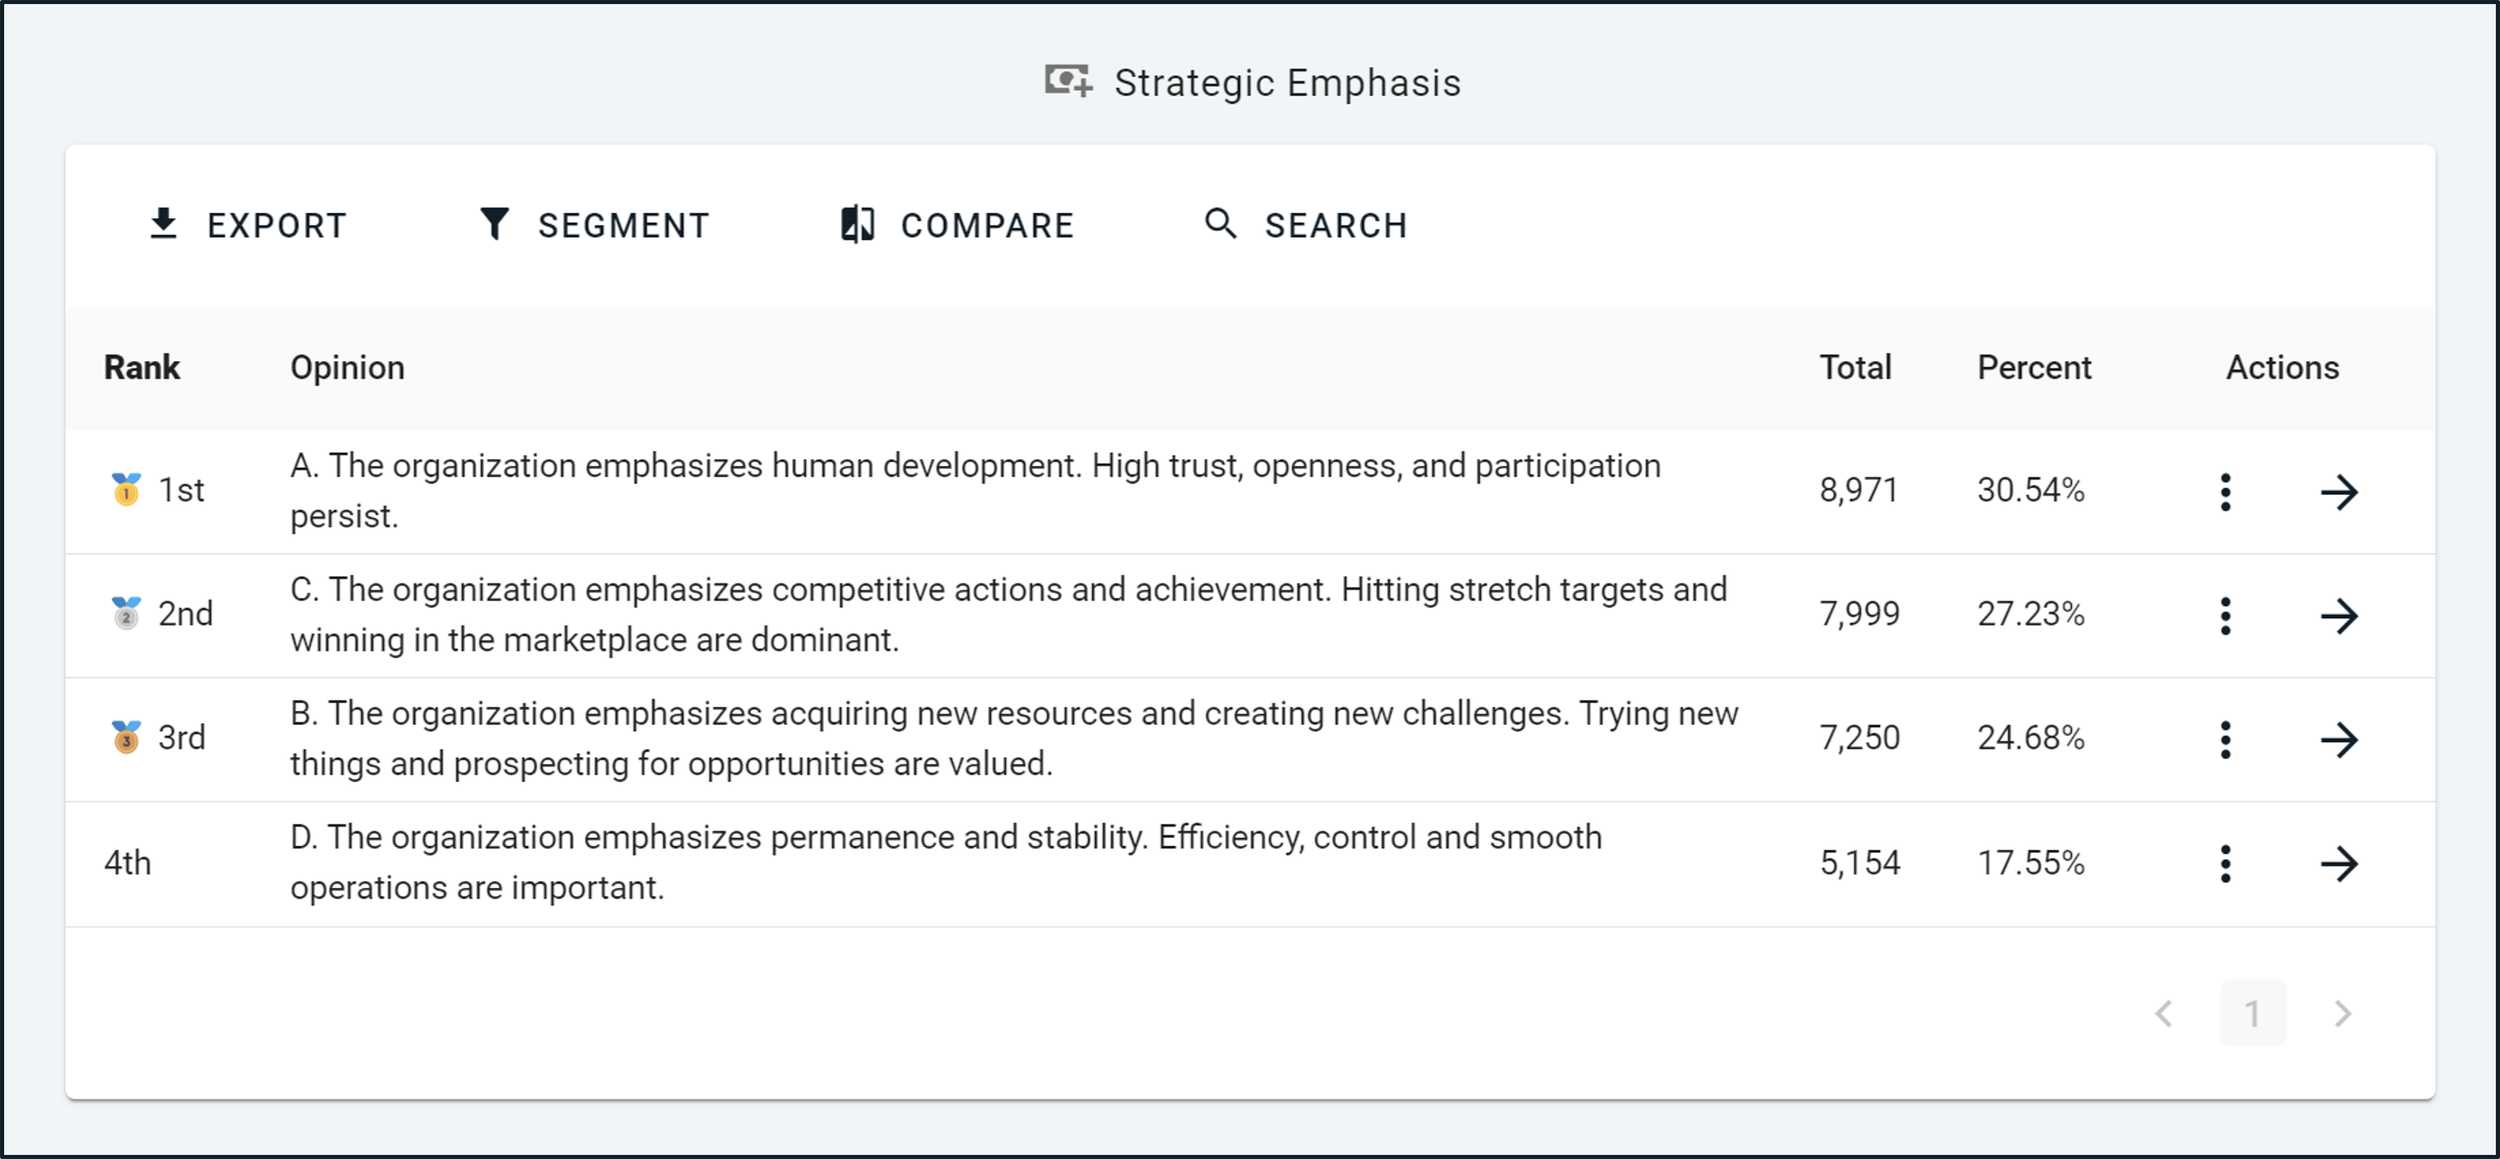
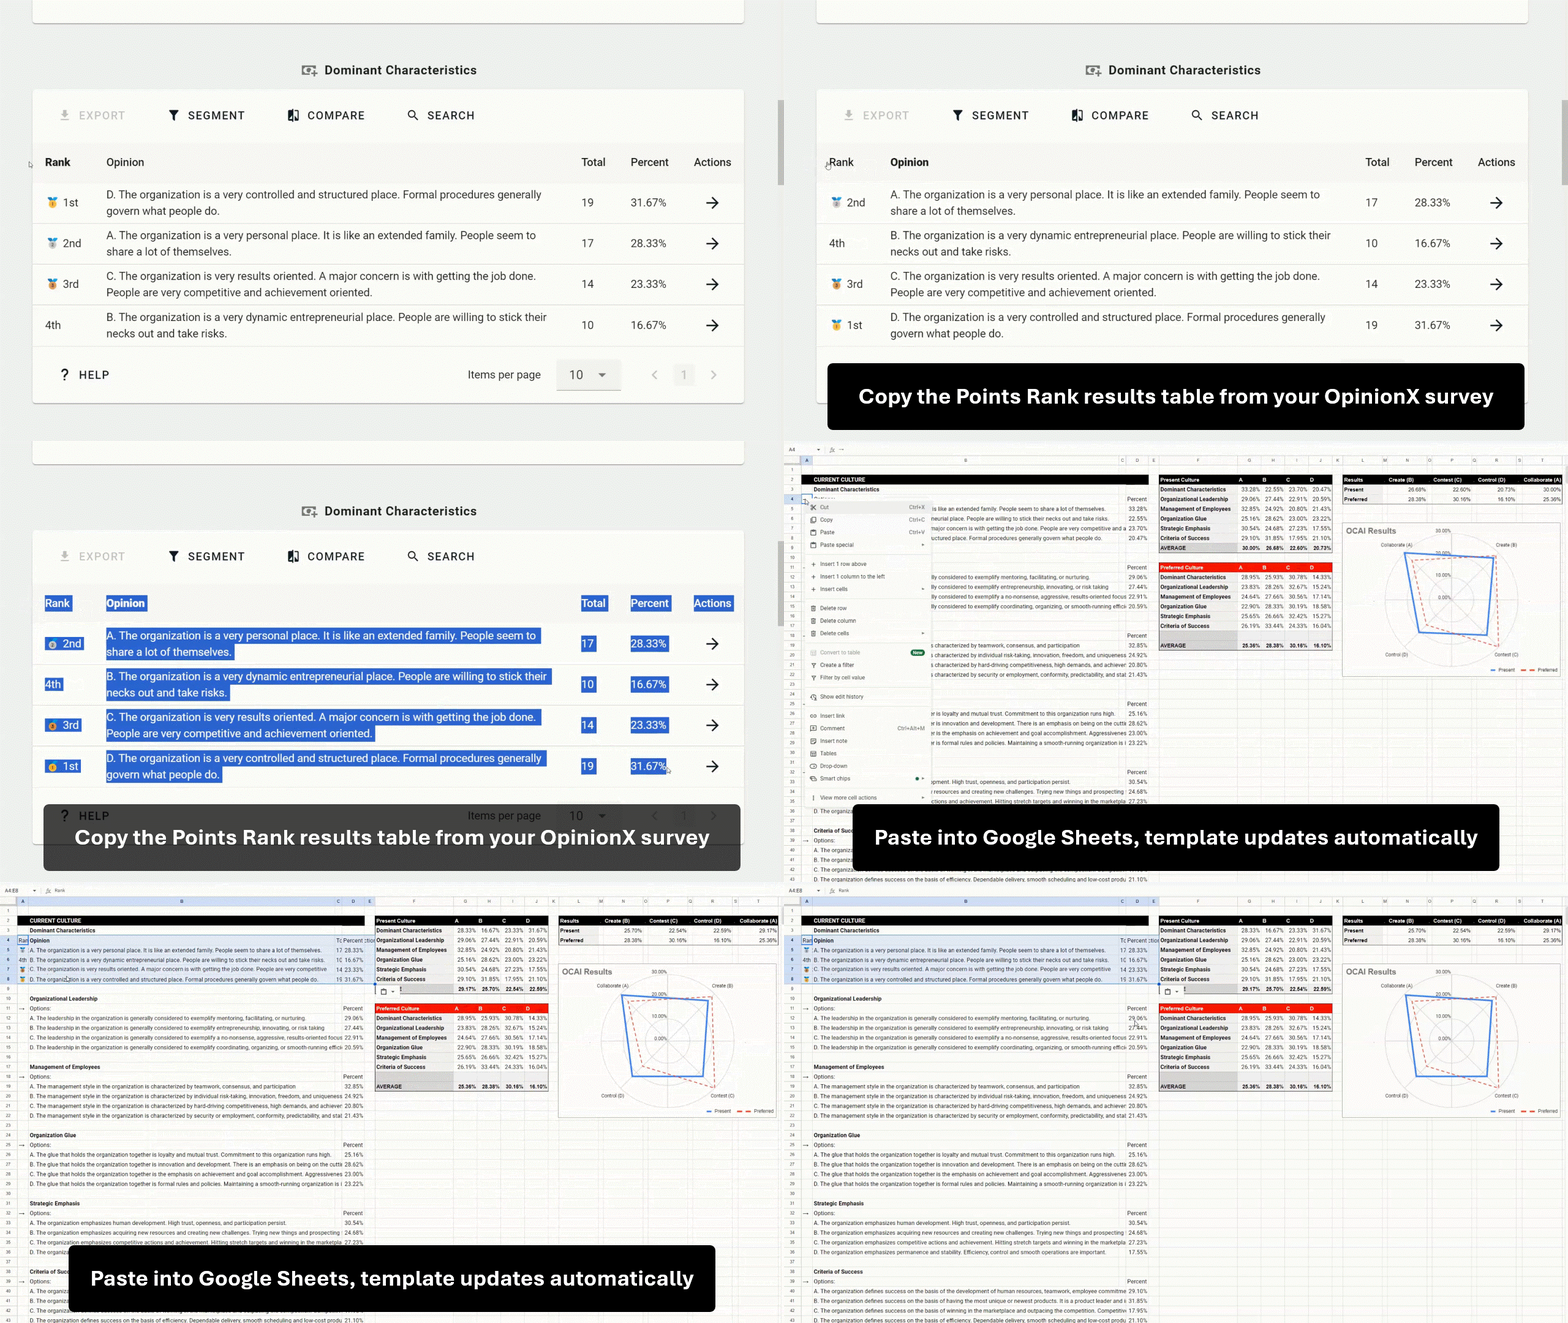
Take the percentages from each of the six dimensions and build an aggregated spreadsheet. Keeping the A, B, C, D tags on the statements makes analysis much faster. You can also remove those tags and set your Points Rank questions to randomise the order for each section, which produces less biased data.

Both Excel and Google Sheets need some fine-tuning to produce the radar graph in the standard OCAI style.
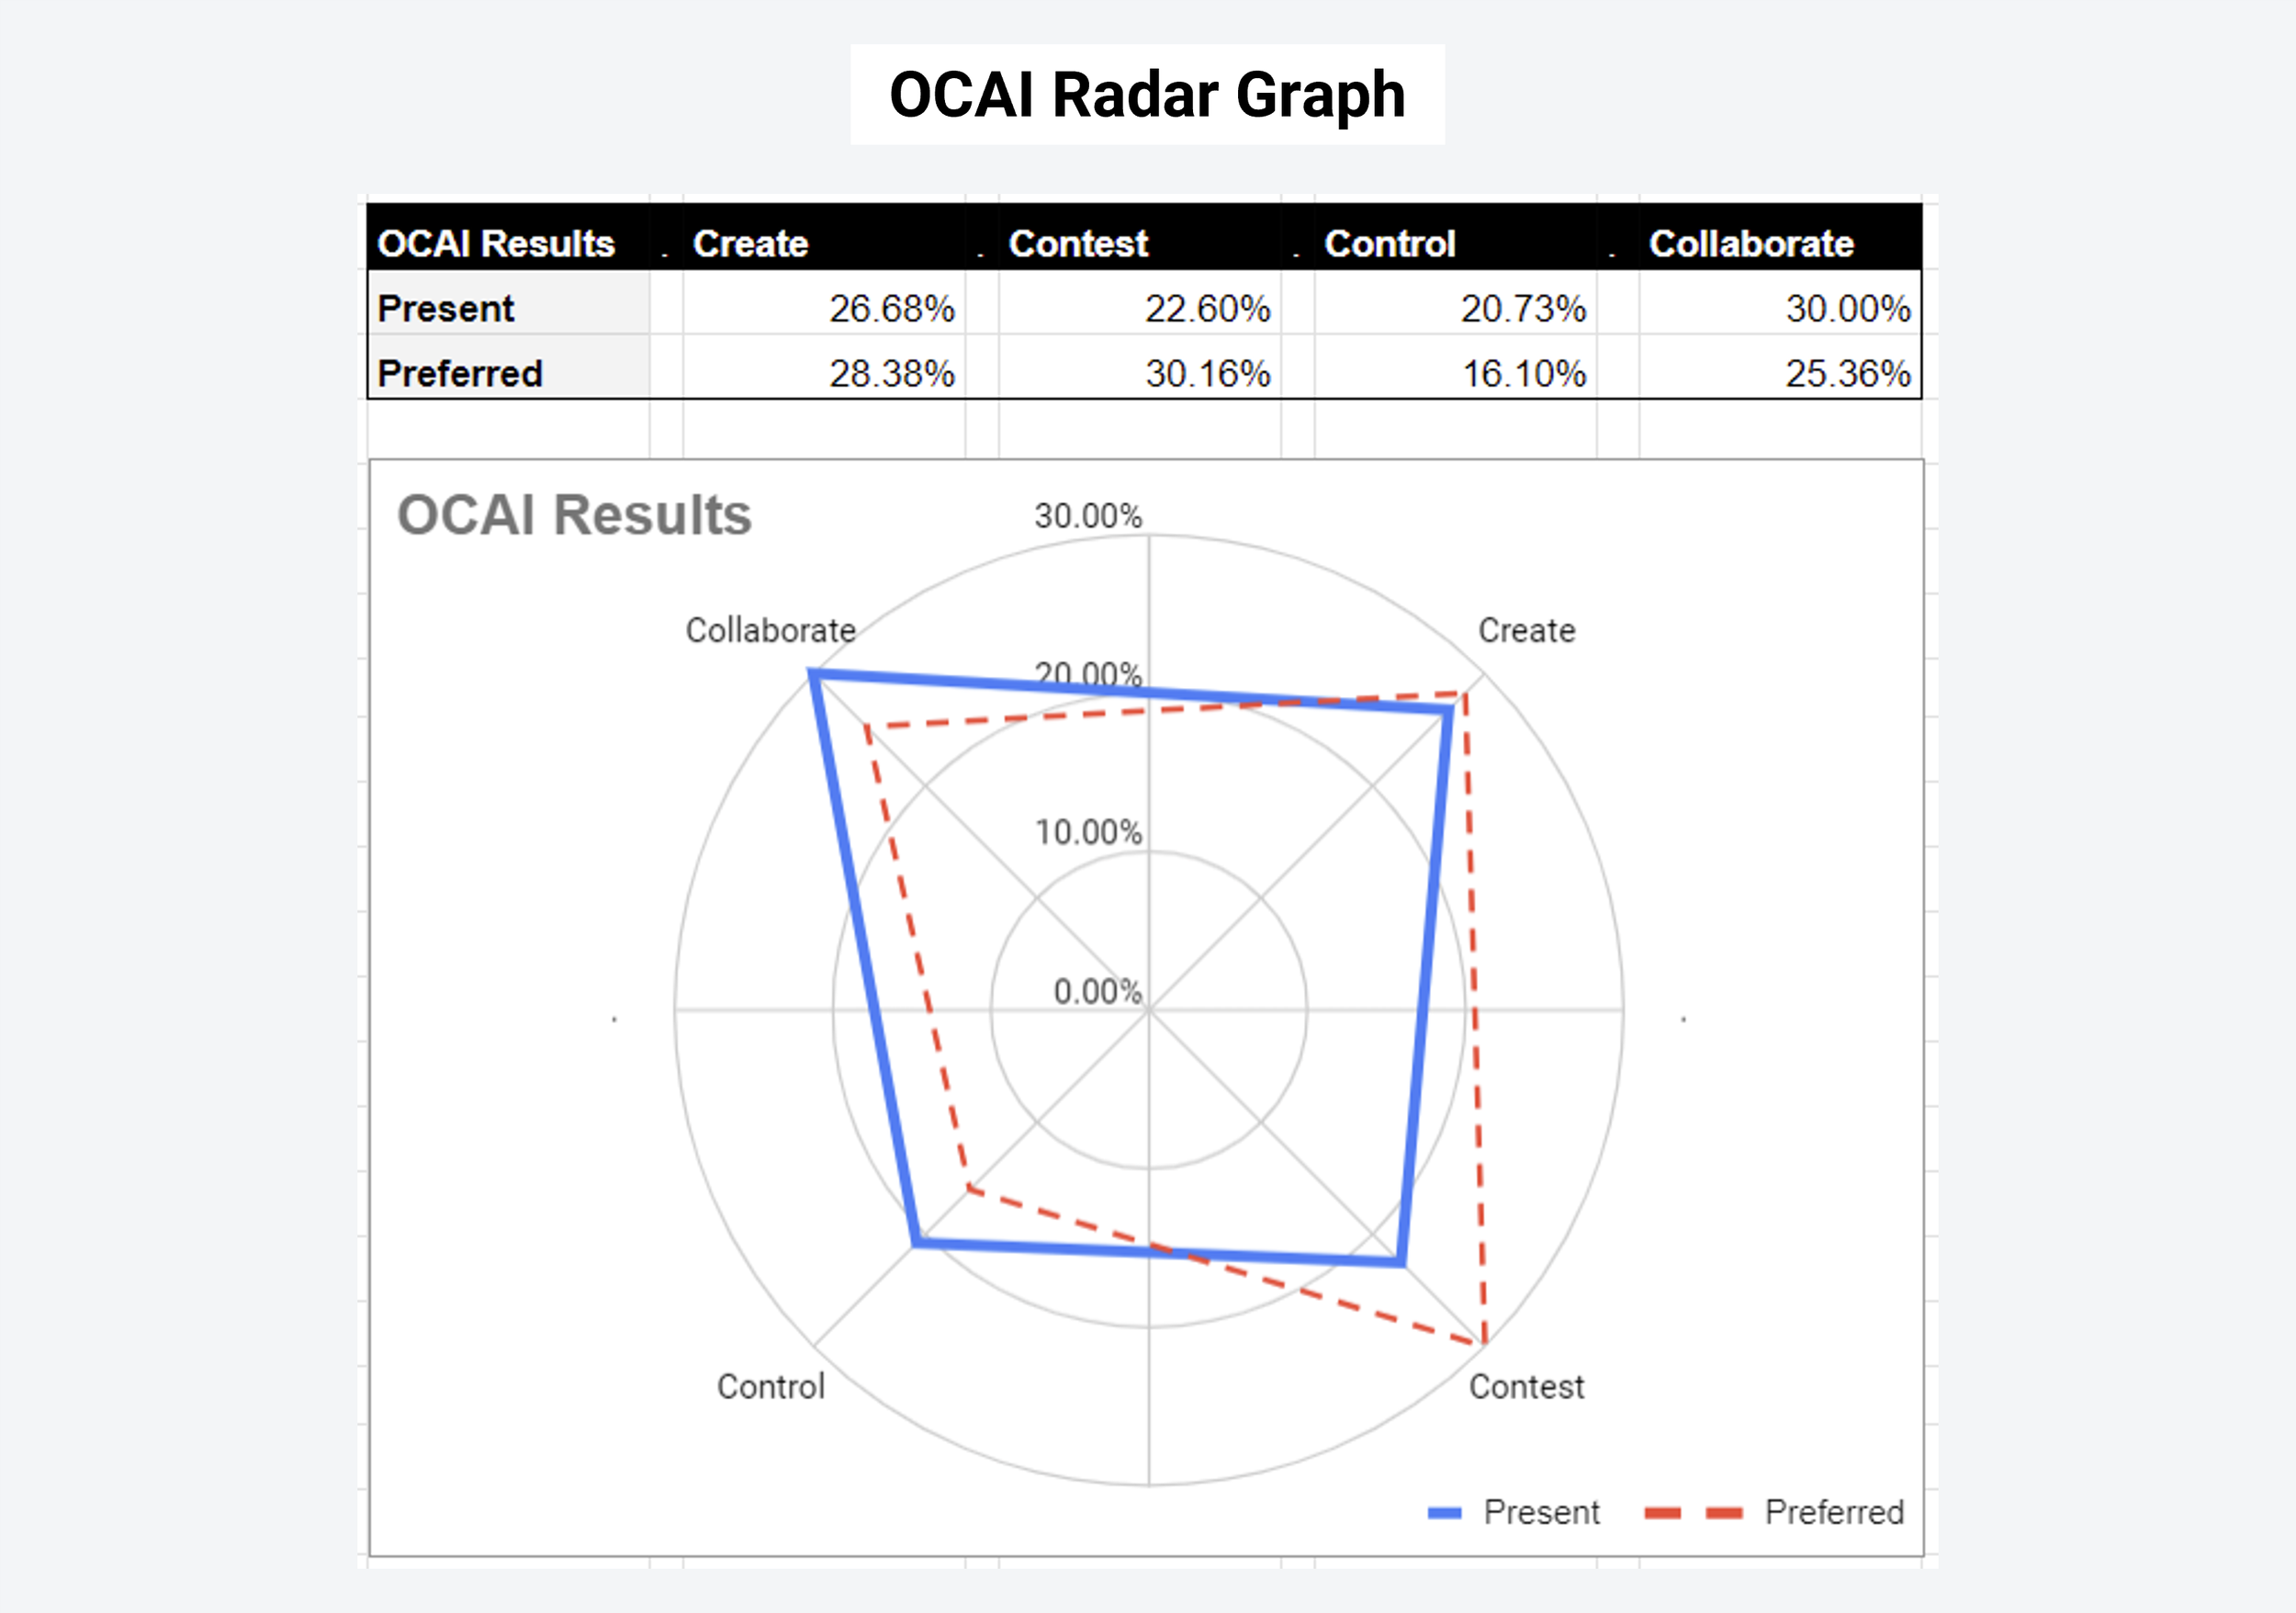
Formatting your OCAI radar graph
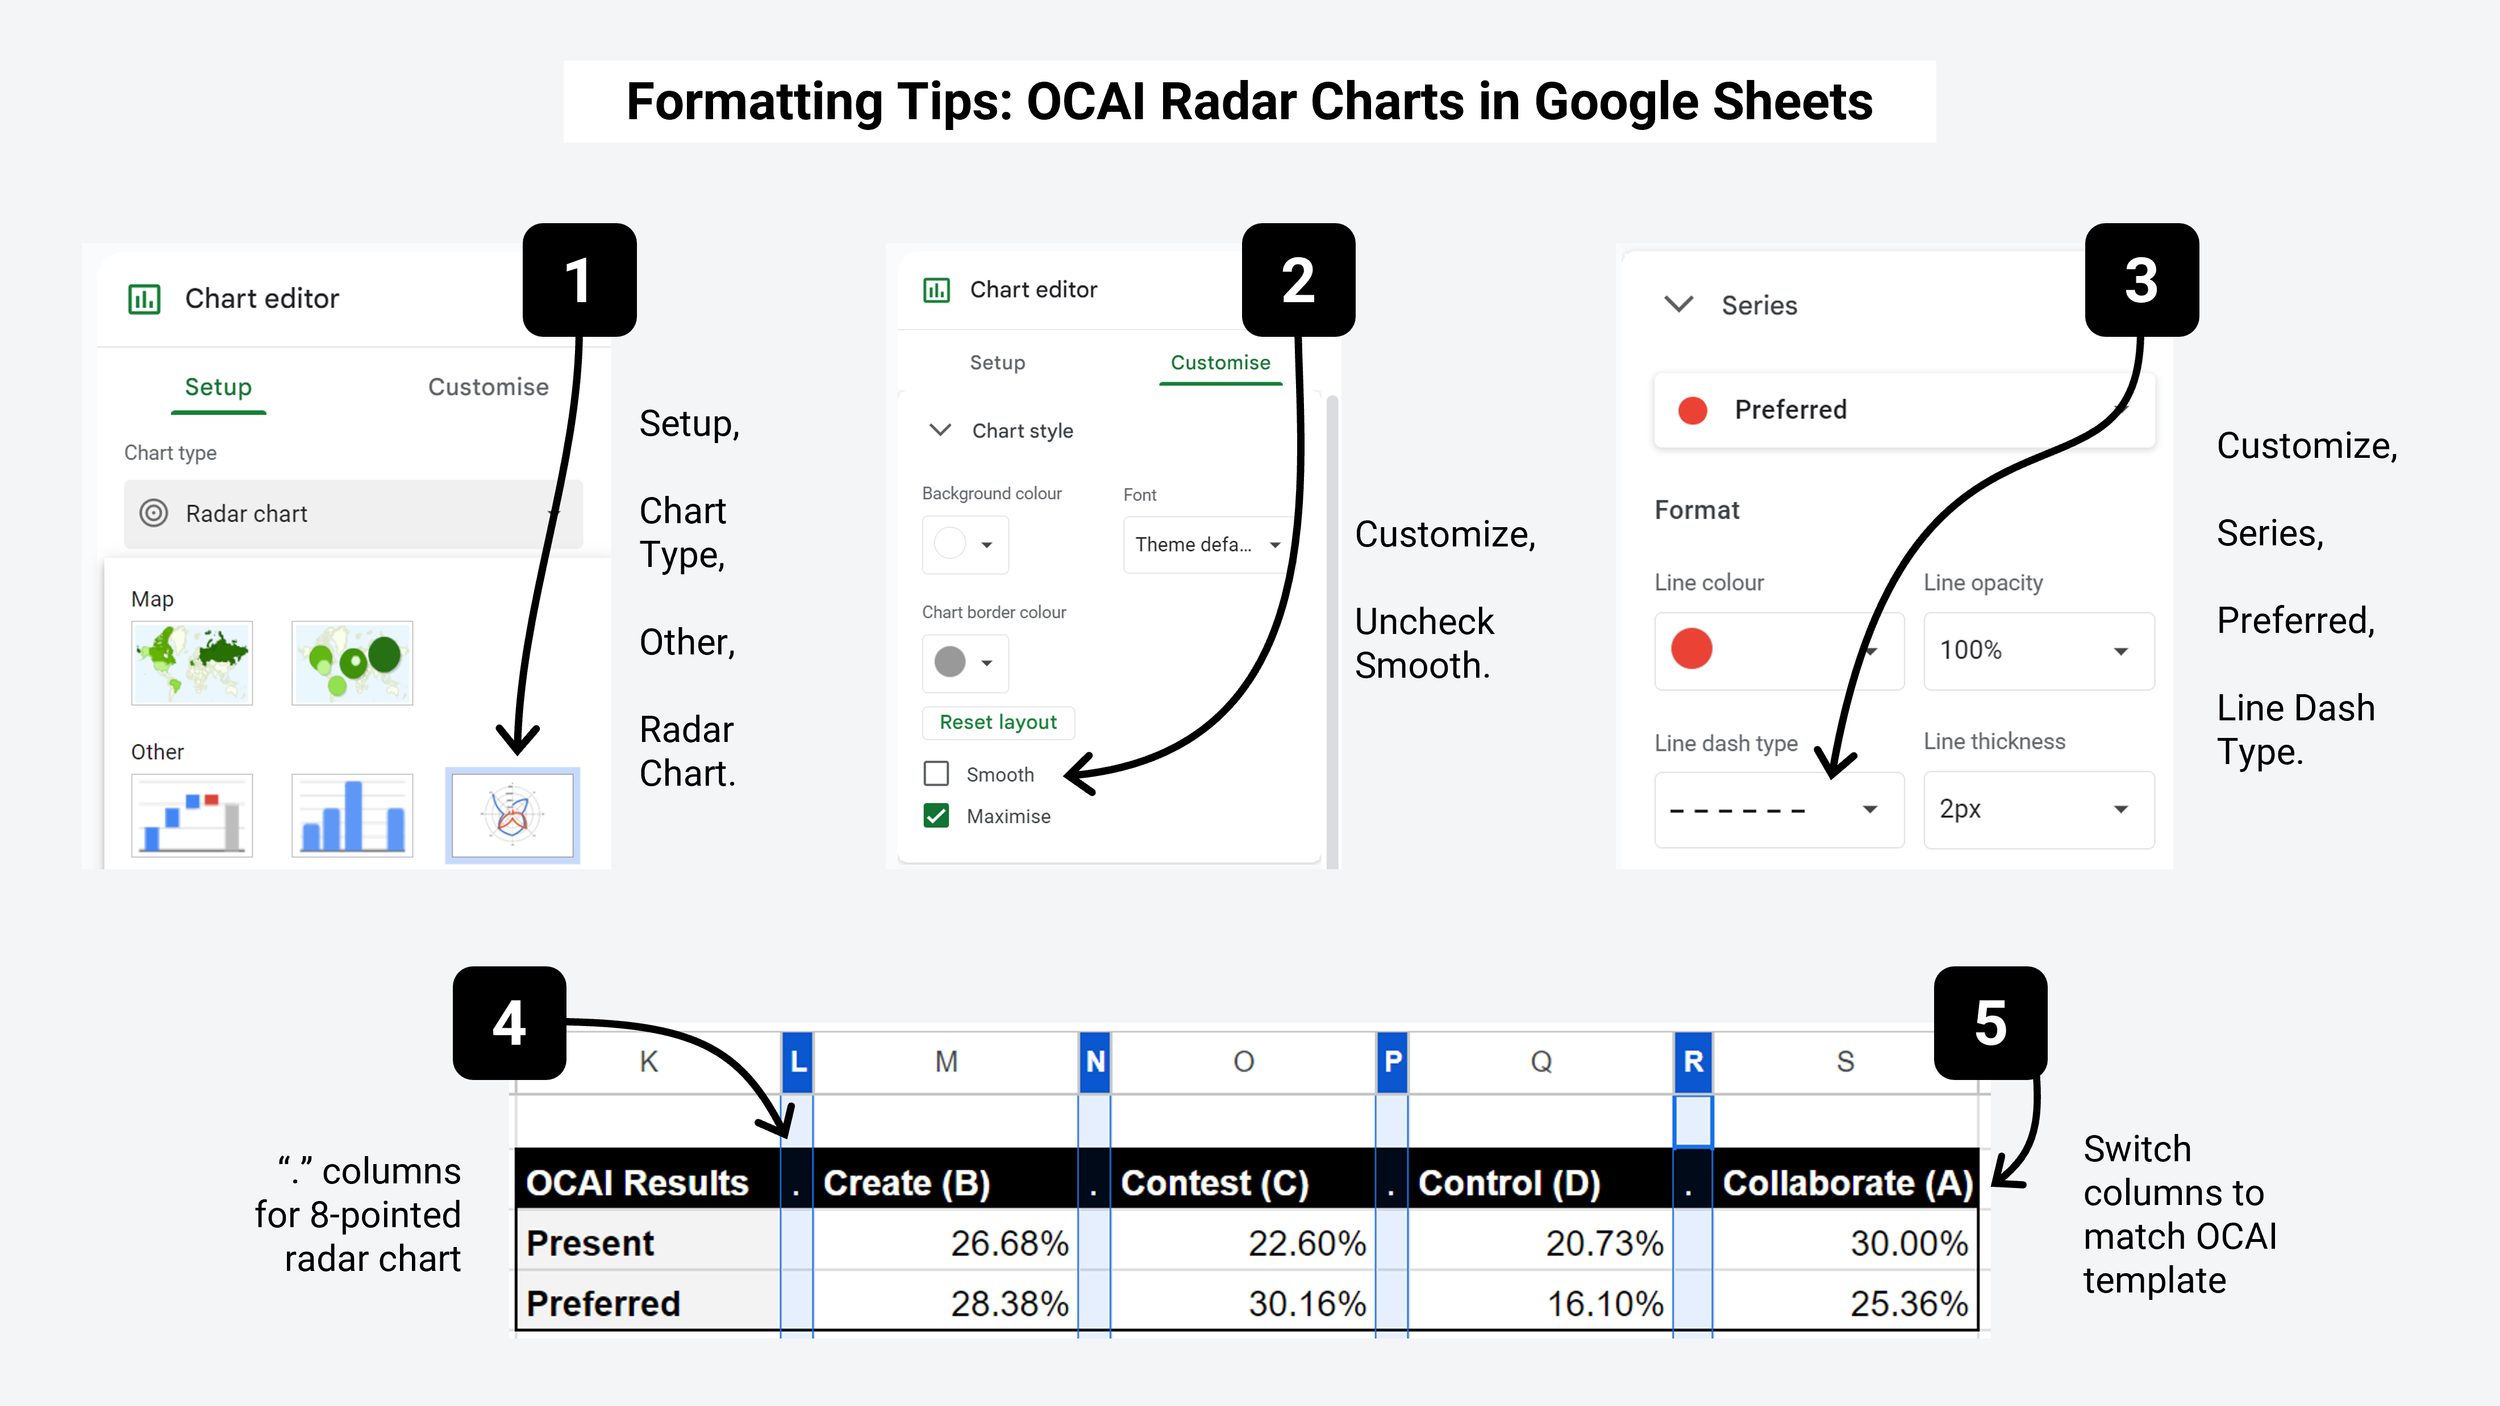
1. Find the chart type. In Google Sheets, open Chart Types and scroll to the bottom, where Radar Chart sits under Other.
2. Turn off smoothing. In the Chart Editor, open the Customise tab, open the Chart Style dropdown and disable the Smooth checkbox. That makes the lines straight.
3. Use line styles rather than colour. The original OCAI paper used a solid line for Present and a dashed line for Preferred, which is what I used. Some newer versions use a fuchsia and blue colour scheme. Google Sheets does not let you fill radar graphs with colour, and fuchsia against blue is not an accessible palette for colourblind readers.
4. Push the data onto the diagonals. I included four columns containing only a full stop between each column of data, which moves the OCAI data onto the diagonal points rather than the x and y axes.
5. Reorder for the starting position. The radar chart begins at the top-centre data point and moves to the top-right next, so I moved Collaborate, which was A in my dataset, to the end of the table so it lands in the right part of the chart.
Comparing culture by team
Combining points from everyone across the organisation gives you a high-level view, and it hides the most interesting thing an OCAI survey can produce: the differences between departments, seniority levels and geographies.
Call each of those groupings a segment. The three most common are departments (sales against marketing), seniority (management against individual contributors) and geography (North America against EMEA). Segmenting shows you where perceived culture diverges most.
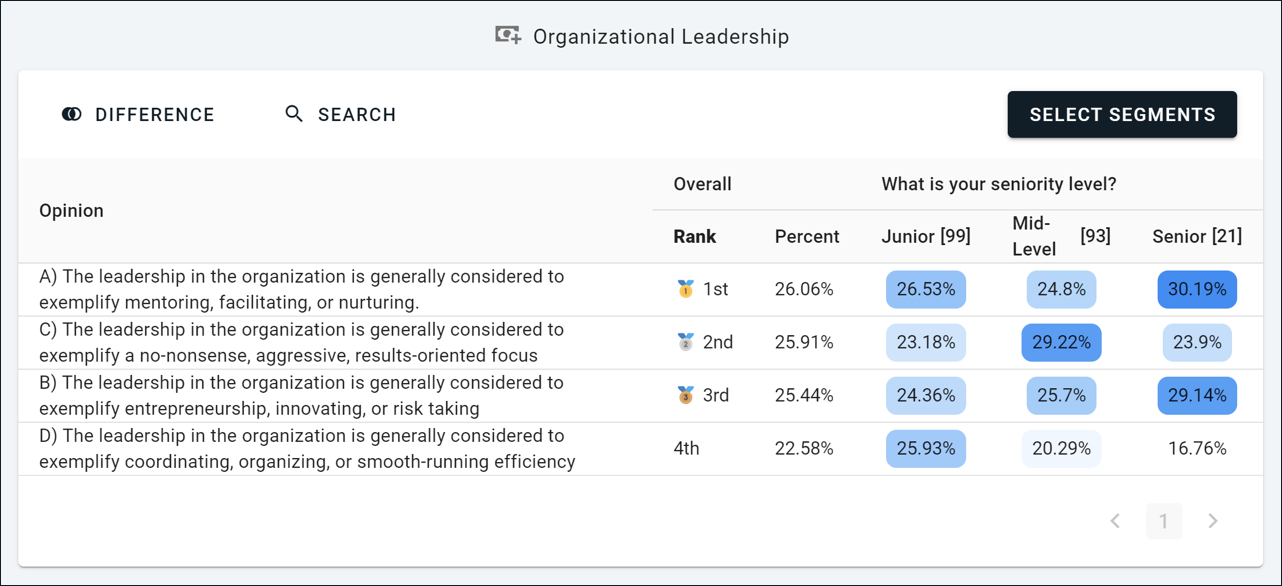
OpinionX includes segmentation analysis that lets you filter results to a single segment, compare two segments head to head, or view a heatmap matrix of all segments in one table. Those heatmaps handle up to 20 segments at once.
Take one question from my own OCAI survey, where the three segments scored it completely differently. Junior employees lean heavily towards option D, Control culture. Senior leaders rate D as the least influential aspect of Organizational Leadership. Mid-level managers associate strongly with statement C, Compete culture, which may be a sign that senior leaders are putting bottom-line pressure on their direct reports.
Skip segmentation and all four cultures look similar on this question, with a range of 3.48 percentage points between first and last place. Segmenting reveals how differently stakeholders perceive the same organisation, and it identifies the teams whose view of current culture sits furthest from the organisation's preferred culture. Those are the teams your transformation work should start with. The same logic drives needs-based segmentation in customer research, and Glofox used it to find that company size determined which problem ranked highest.
Three ways to set up segmentation
1. Multiple-choice questions. The easiest route. Include a multiple-choice question and let people self-select their segment. They arrive already grouped at analysis time.
2. Data import. Upload a list of participants, then send each a unique link. The data you uploaded is automatically associated with their participant profile once they complete the survey. Unique links can also be set to single use, which stops anyone completing the survey twice.
3. Manual tags. On the Participants tab you can add data to each profile directly, such as an email address or a department. That avoids asking for information you already hold.
An OCAI survey is incomplete without segmentation analysis.
Implementing your Competing Values Framework results
Suggestions for planning the research, designing the survey, collecting data and tracking cultural change over time.
1. Leadership commitment
Cultural transformation cannot succeed without leadership aligned and committed to the process. Leaders have to be the visible examples of the culture the organisation says it wants to become.
2. Engage the whole organisation
The OCAI works because it needs employee input to measure both existing and preferred culture. Being transparent about people's role in the process, and about how their answers will shape real change, is what creates buy-in across every level. Sharing access to the results does the same, because it lets people see their input had influence. On OpinionX you can share interactive results via a guest link, without exposing personal data or requiring anyone to create an account.
3. Reinforce and sustain the change
Cultural change is a long journey rather than an event. Reinforcing new values consistently means recognising the effort people make, rewarding those leading the way, and gathering continuous feedback.
Running the OCAI one to four times a year lets you track progress against the goals you set, catch changes in the preferred culture over time, and keep reminding people that the process is participatory and depends on their input.
Start your own culture assessment
The importance of company culture is long past needing an argument. Research from the University of Warwick found that happier employees are around 12% more productive than average, published as "Happiness and Productivity" by Oswald, Proto and Sgroi in the Journal of Labor Economics.
Leaders looking to retain their best people can use the OCAI as a detailed, quantitative way to analyse culture, regardless of company size, industry or country. It also gives employees a genuine voice in shaping that culture through the preferred-culture section in the second half of the survey.
Frequently asked questions
What is the Competing Values Framework?
A model that maps organisational culture across two tensions: internal against external focus, and stability against flexibility. Those axes produce four culture types: Collaborate, Create, Compete and Control. Robert E. Quinn and John Rohrbaugh published it in 1981.
What is the difference between CVF and OCAI?
CVF is the theory and OCAI is the survey instrument built on it. The Organizational Culture Assessment Instrument turns the framework into six questions that measure how strongly an organisation matches each of the four types. Commercially the two terms get used interchangeably.
How does the OCAI survey work?
Six dimensions, each with four statements representing one culture type. Participants distribute 100 points across the four statements per dimension. The whole set is completed twice, once for the culture as it is now and once for the culture employees would prefer.
Why does the OCAI use points allocation instead of a rating scale?
Because a rating scale lets people score every statement the same, which produces no separation and no usable ranking. A fixed pool of 100 points forces a trade-off, so participants have to decide which culture type genuinely describes their organisation most.
How often should you run a culture assessment?
One to four times a year. That is frequent enough to track progress against transformation goals and to catch shifts in what employees say they want, without creating survey fatigue.
Over 42,000 researchers and product people get one method breakdown like this each week in The Full-Stack Researcher.
OpinionX includes a Points Rank question type suited to CVF work, plus the segmentation analysis needed to find the groups that see the culture differently from everyone else. Every question type is unlocked on the free tier, capped at 25 participants per survey.