8 Alternatives To Conjoint Analysis For User Research
Conjoint analysis is a popular research method for understanding which attributes most influence customers when they are considering purchasing your product. It’s a popular research method that is loved by pricing specialists, product marketers, and market researchers around the world.
However, conjoint analysis is considered an “advanced” research method. It can be a confusing and overwhelming format for people who are not specialist quantitative researchers — in fact, many products offering conjoint analysis use this complexity for their own benefit by making the majority of their revenue from their internal experts and consultants you end up hiring to help you figure out how to design and analyze your conjoint survey!
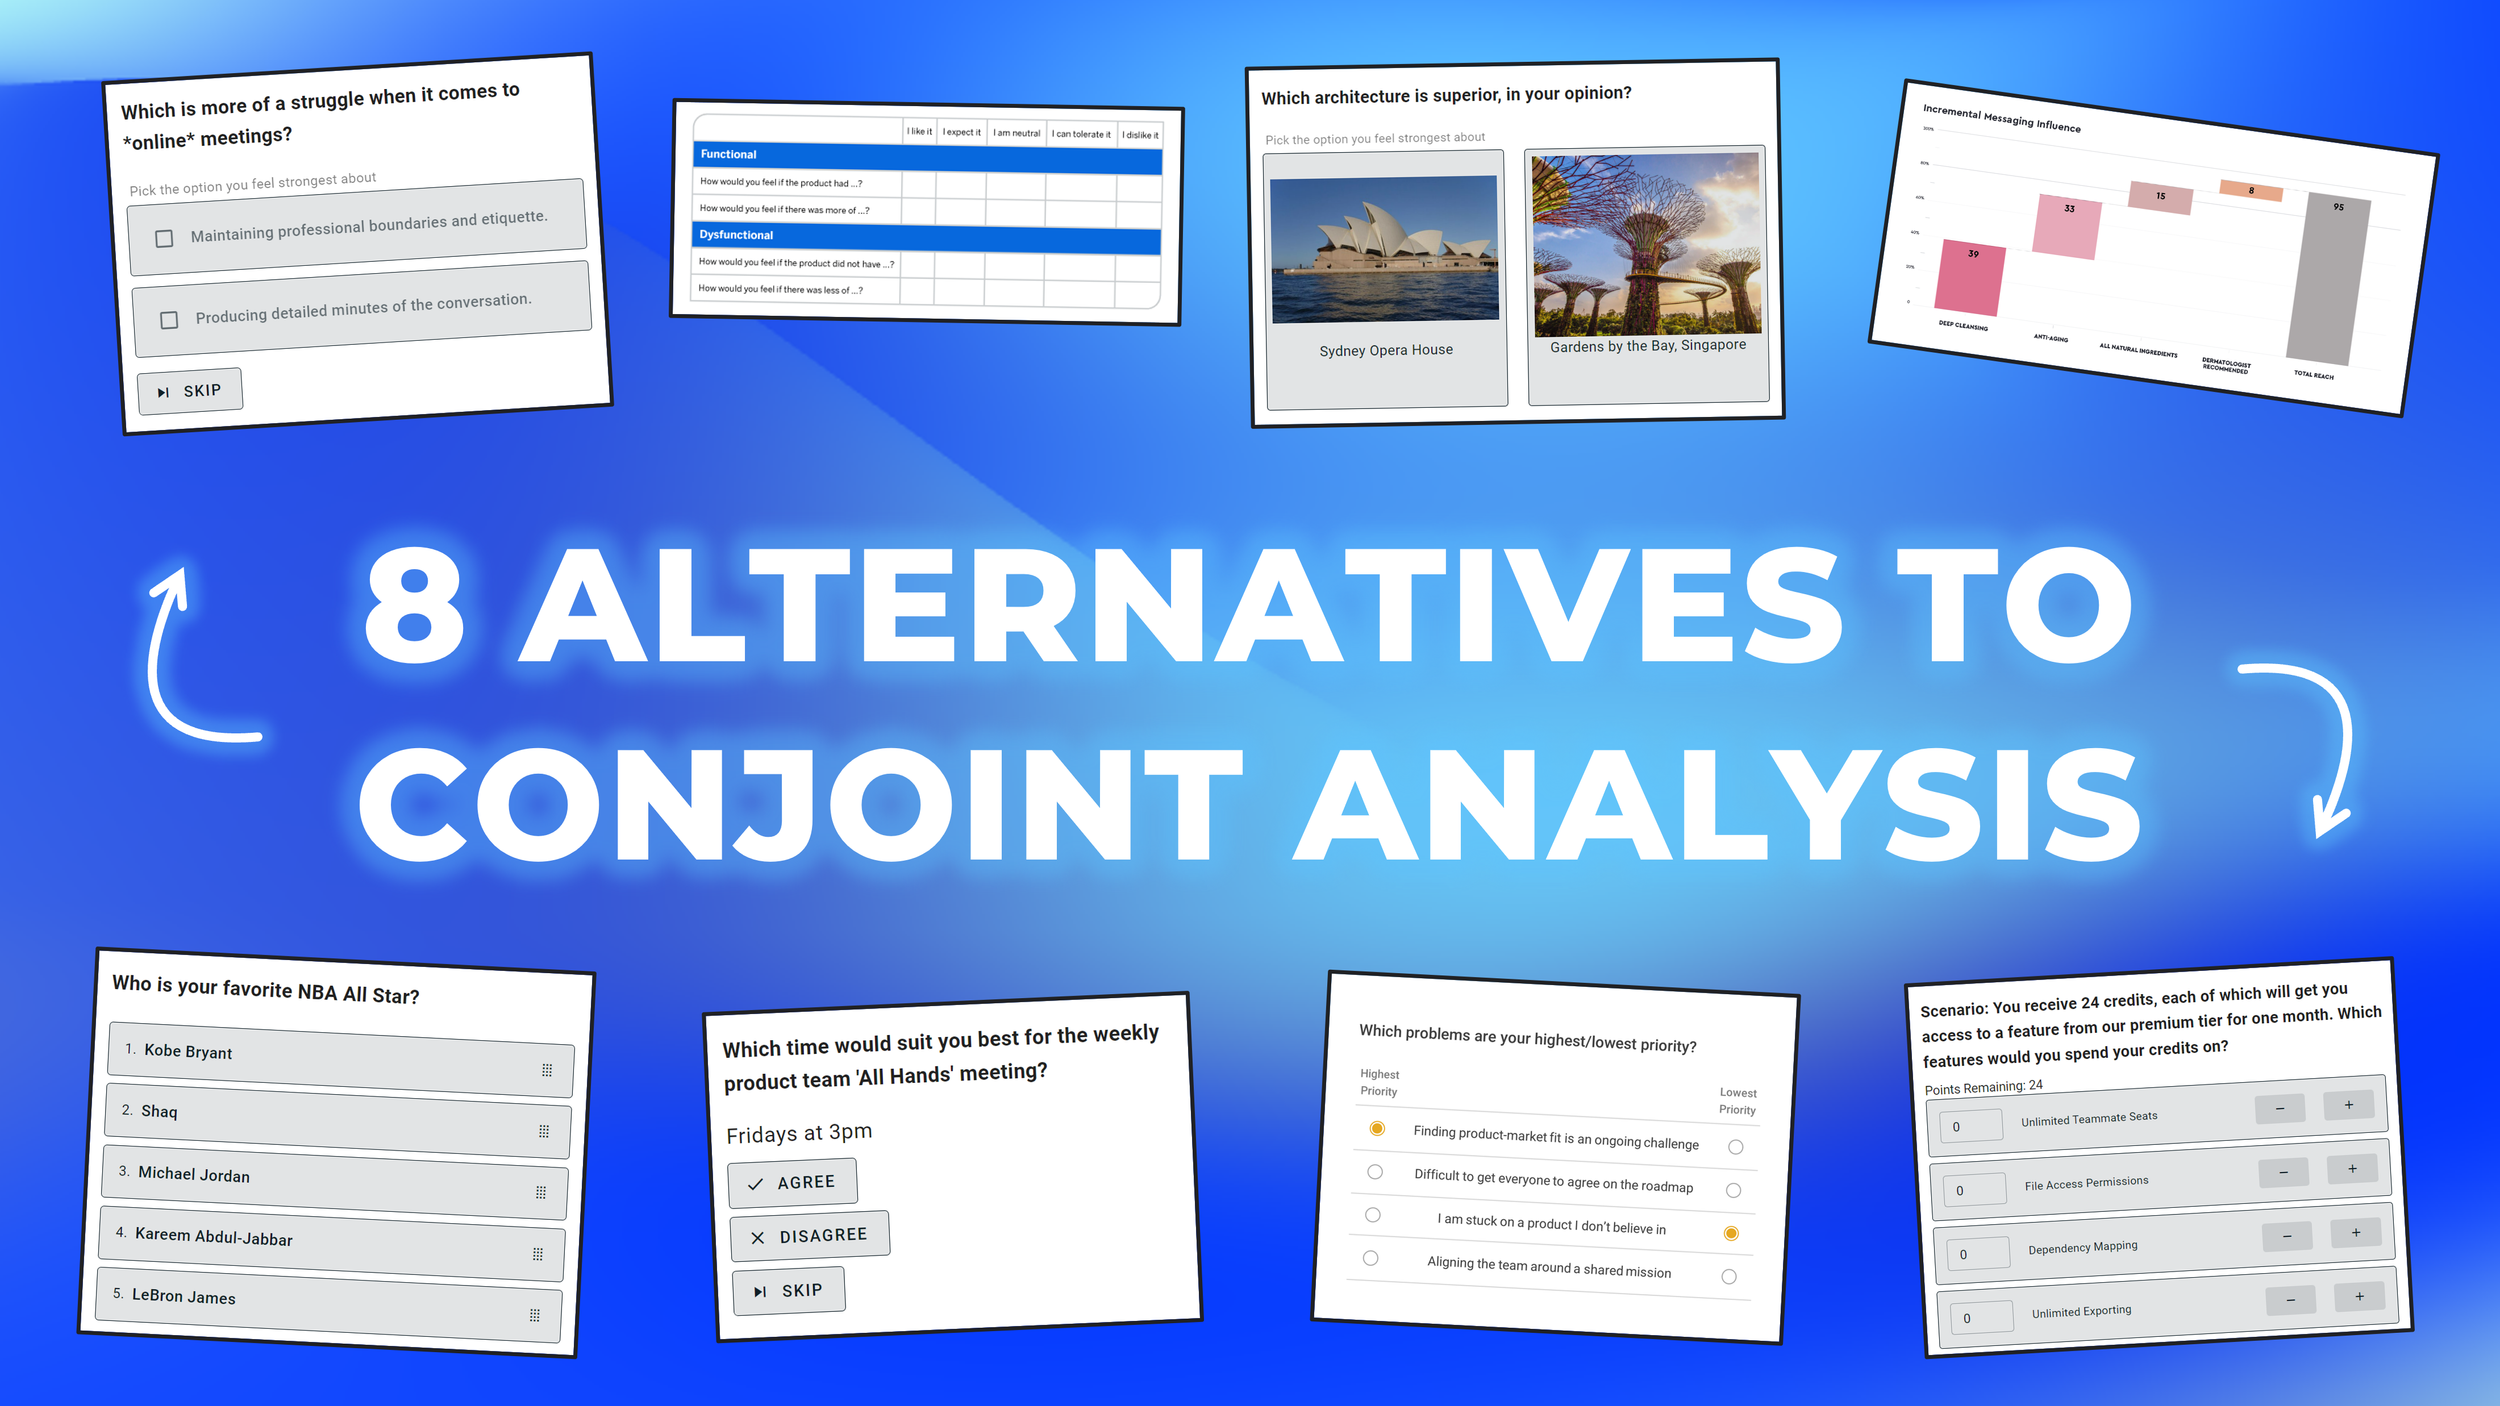
And while there are free conjoint tools (without the paid-consultant trick) that you can try for yourself, many teams end up picking an alternative survey method that better suits their research needs or is easier to manage on their own. In this blog post, I cover 8 survey methods that are often more suitable for the research occasions people initially assumed they should use conjoint analysis for.
This blog post is just one part of my series about conjoint analysis, which includes:
When NOT to use Conjoint Analysis
Before jumping into alternatives, let’s quickly cover when not to use conjoint analysis for your research. Conjoint analysis is one of the most misused and misunderstood research methods. I wrote an entire blog post covering 10 scenarios where you should NOT use conjoint analysis — TL;DR: you can only use conjoint analysis when your research meets all of these criteria:
You’re simulating a purchase scenario between similar products.
Where only one person is involved in making the purchase decision.
Where that customer already knew what kind of product they needed.
Where you already know which attributes they use to compare products.
Where those attributes have no overlap in meaning or possible options.
Conjoint analysis is best suited for research like modeling market share scenarios, calculating willingness-to-pay for existing product attributes, or informing product bundling strategy. You’re better off using a different choice-based research method to map customer needs, prioritize product feature ideas, or research complex business purchases.
↑ interactive example of a conjoint analysis survey (hosted on OpinionX)
What Is Choice-Based Research?
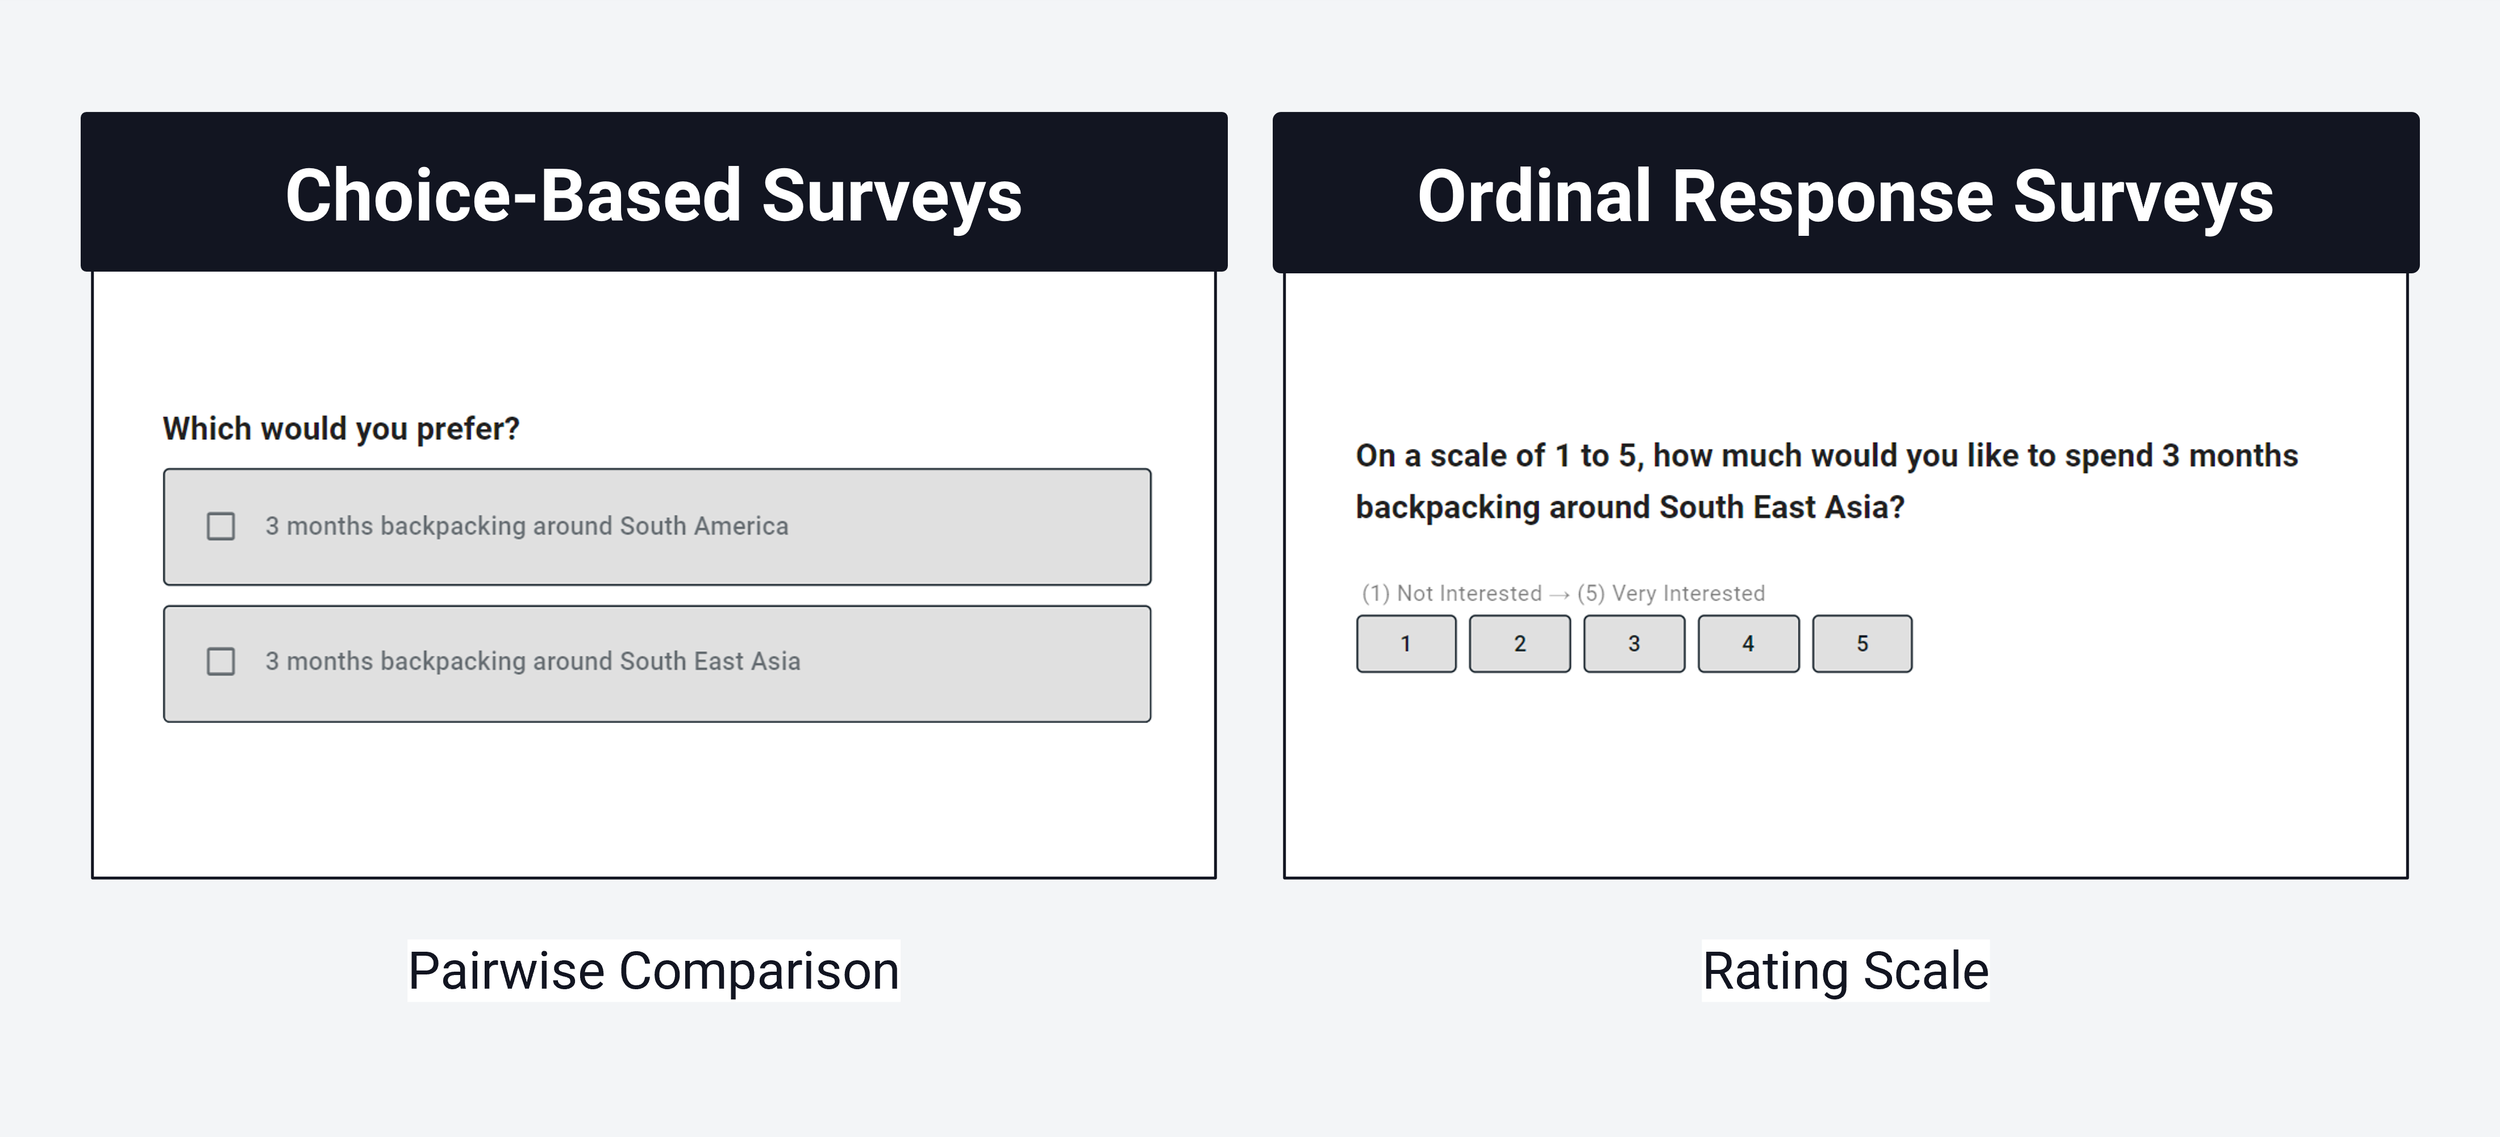
Conjoint analysis is a choice-based research method — it gives people a series of options and figures out what they care about by tracking which options they choose. There are a range of different survey methods that follow this same principle of giving people options are seeing which choices they make.
Choice-based survey methods are valuable for researchers because they imitate real-life scenarios where people have limited options, forcing them to consider the trade-offs between choices and pick the one that best meets their needs.
Of the eight alternatives to conjoint covered in this blog post, the first four are choice-based research methods while the last four are non-comparative survey methods (ie. question types that don’t force people to choose between options).
— — —
8 Alternative Survey Formats to Conjoint Analysis
5. Agreement Voting *
6. Kano Model *
7. Van Westendorp PSM *
8. TURF Analysis *
* indicates that the survey method is not a choice-based format
1. Pairwise Comparison
Explanation: Pairwise Comparison is like a simple, flexible version of conjoint analysis. Instead of showing people “profiles” made up of many different attributes, pairwise comparison shows two options at a time and calculates which options get picked most often.
Advantages: Simple to set up on your own, low cognitive load for participants, can rank short or long lists, easy to understand how results are calculated, 10x cheaper than conjoint analysis tools.
Disadvantages: Lacks some of the sophistication of conjoint analysis (eg. separate attributes and levels). Can require a lot of voting if you’ve got a lot of options but only a few respondents.
Suggested Tool: OpinionX (unlimited free Pairwise Comparison surveys)
Interactive Example:
— — —
2. Points Allocation
Explanation: Points Allocation surveys give respondents a pool of credits to spend amongst a set of options. The way they allocate those credits tells you not only which options are most important to them, but also how much more important the top options are.
Advantages: Great at measuring the magnitude of people’s preferences by allowing them to “spend” their credits on what matters most to them (ie. not just that they like apples more than pears, but they would give 9 of their 10 points to apples). Points Allocation is more flexible than conjoint analysis for testing willingness to pay for specific functionality or benefits.
Disadvantages: As a method of choice-based modeling, respondents may feel so strongly about a few options that they choose not to allocate any points to many of the options available. While this is a solid indicator that it is not important, it can create gaps in data (particularly with smaller respondent sample sizes).
Suggested Tool: OpinionX offers unlimited free Points Allocation surveys with unlimited participants too.
Interactive Example:
— — —
3. Ranked Choice Voting
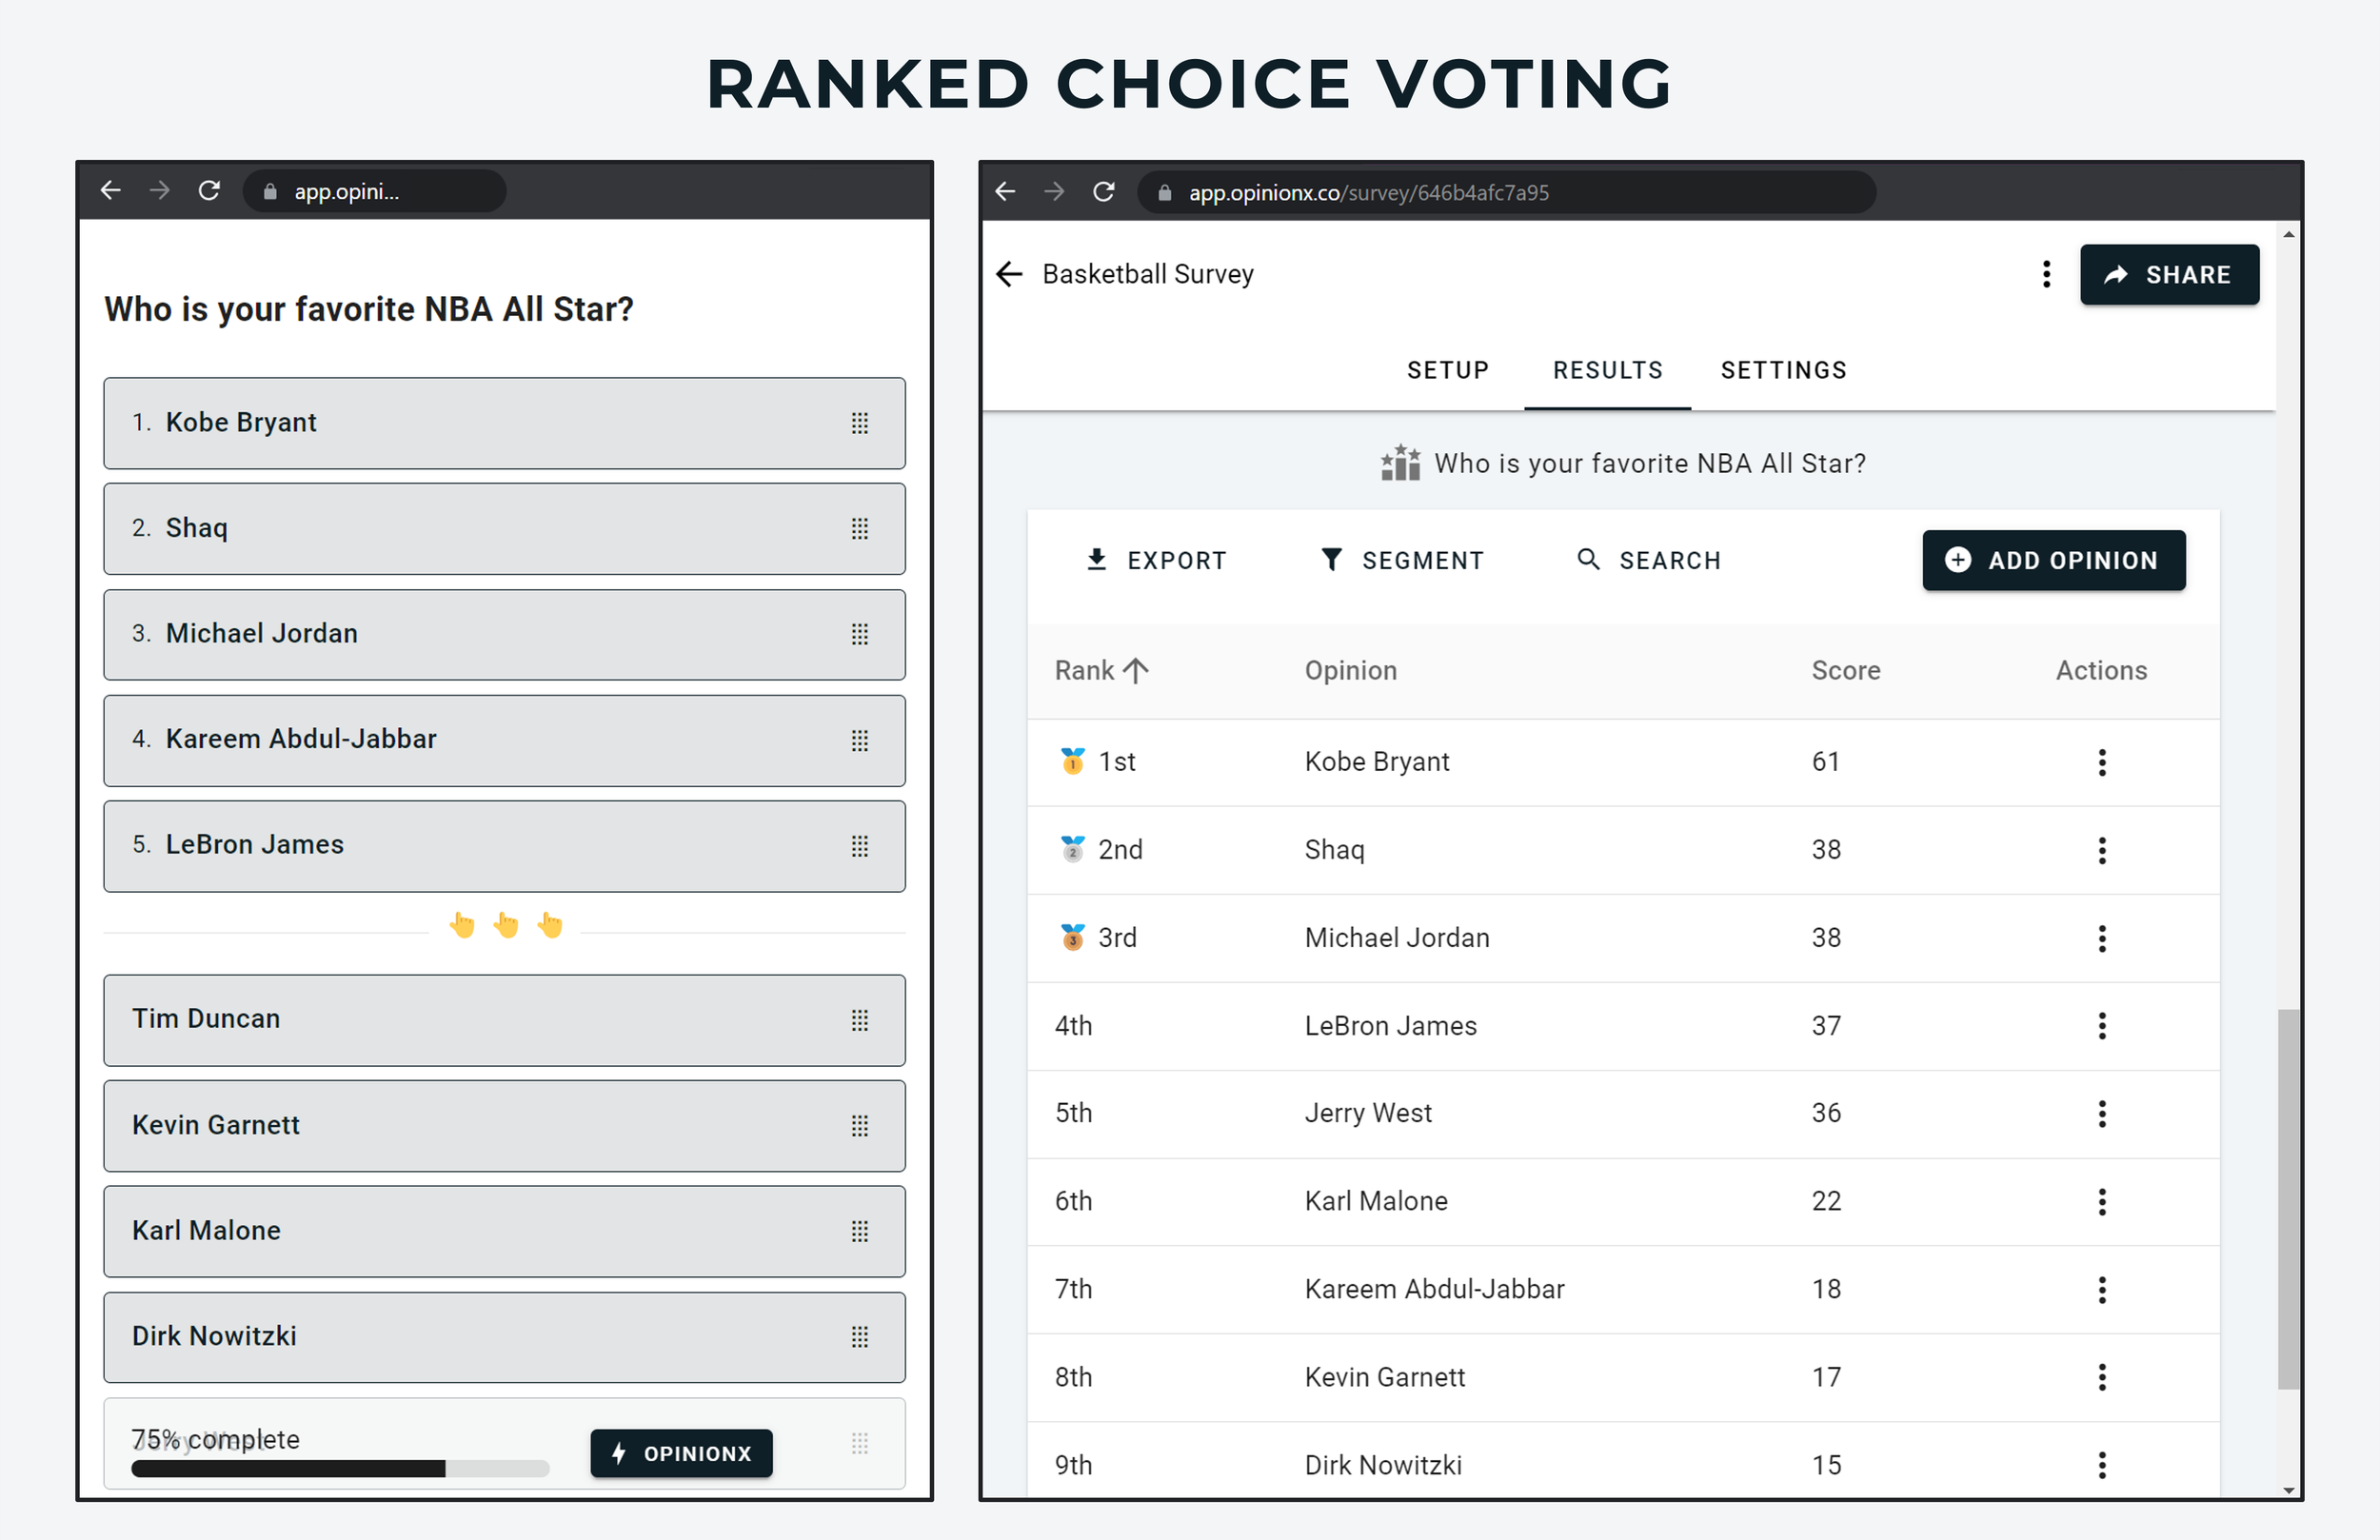
Explanation: Ranked Choice Voting shows respondents the full list of options and asks them to rank them according to their personal preferences.
Advantages: It’s a well-known ranking method that’s easy to set up and very simple for participants to use.
Disadvantages: You should only use 6-10 options max in a ranked-choice question, any more and your quality of data collection starts to decline sharply. For ranking 10+ options, consider using Pairwise Comparison or MaxDiff Analysis questions instead. Ranked choice voting is not particularly easy to do on touchscreens / mobile phones, however, many tools have adapted the design to make this easier (eg. OpinionX allows users to rank by tapping options, drag-and-dropping, or using small arrows to reorder their choices).
Suggested Tool: OpinionX offers unlimited free Ranked Choice Voting surveys (optimized for all screen sizes!)
Interactive Example:
— — —
4. MaxDiff Analysis
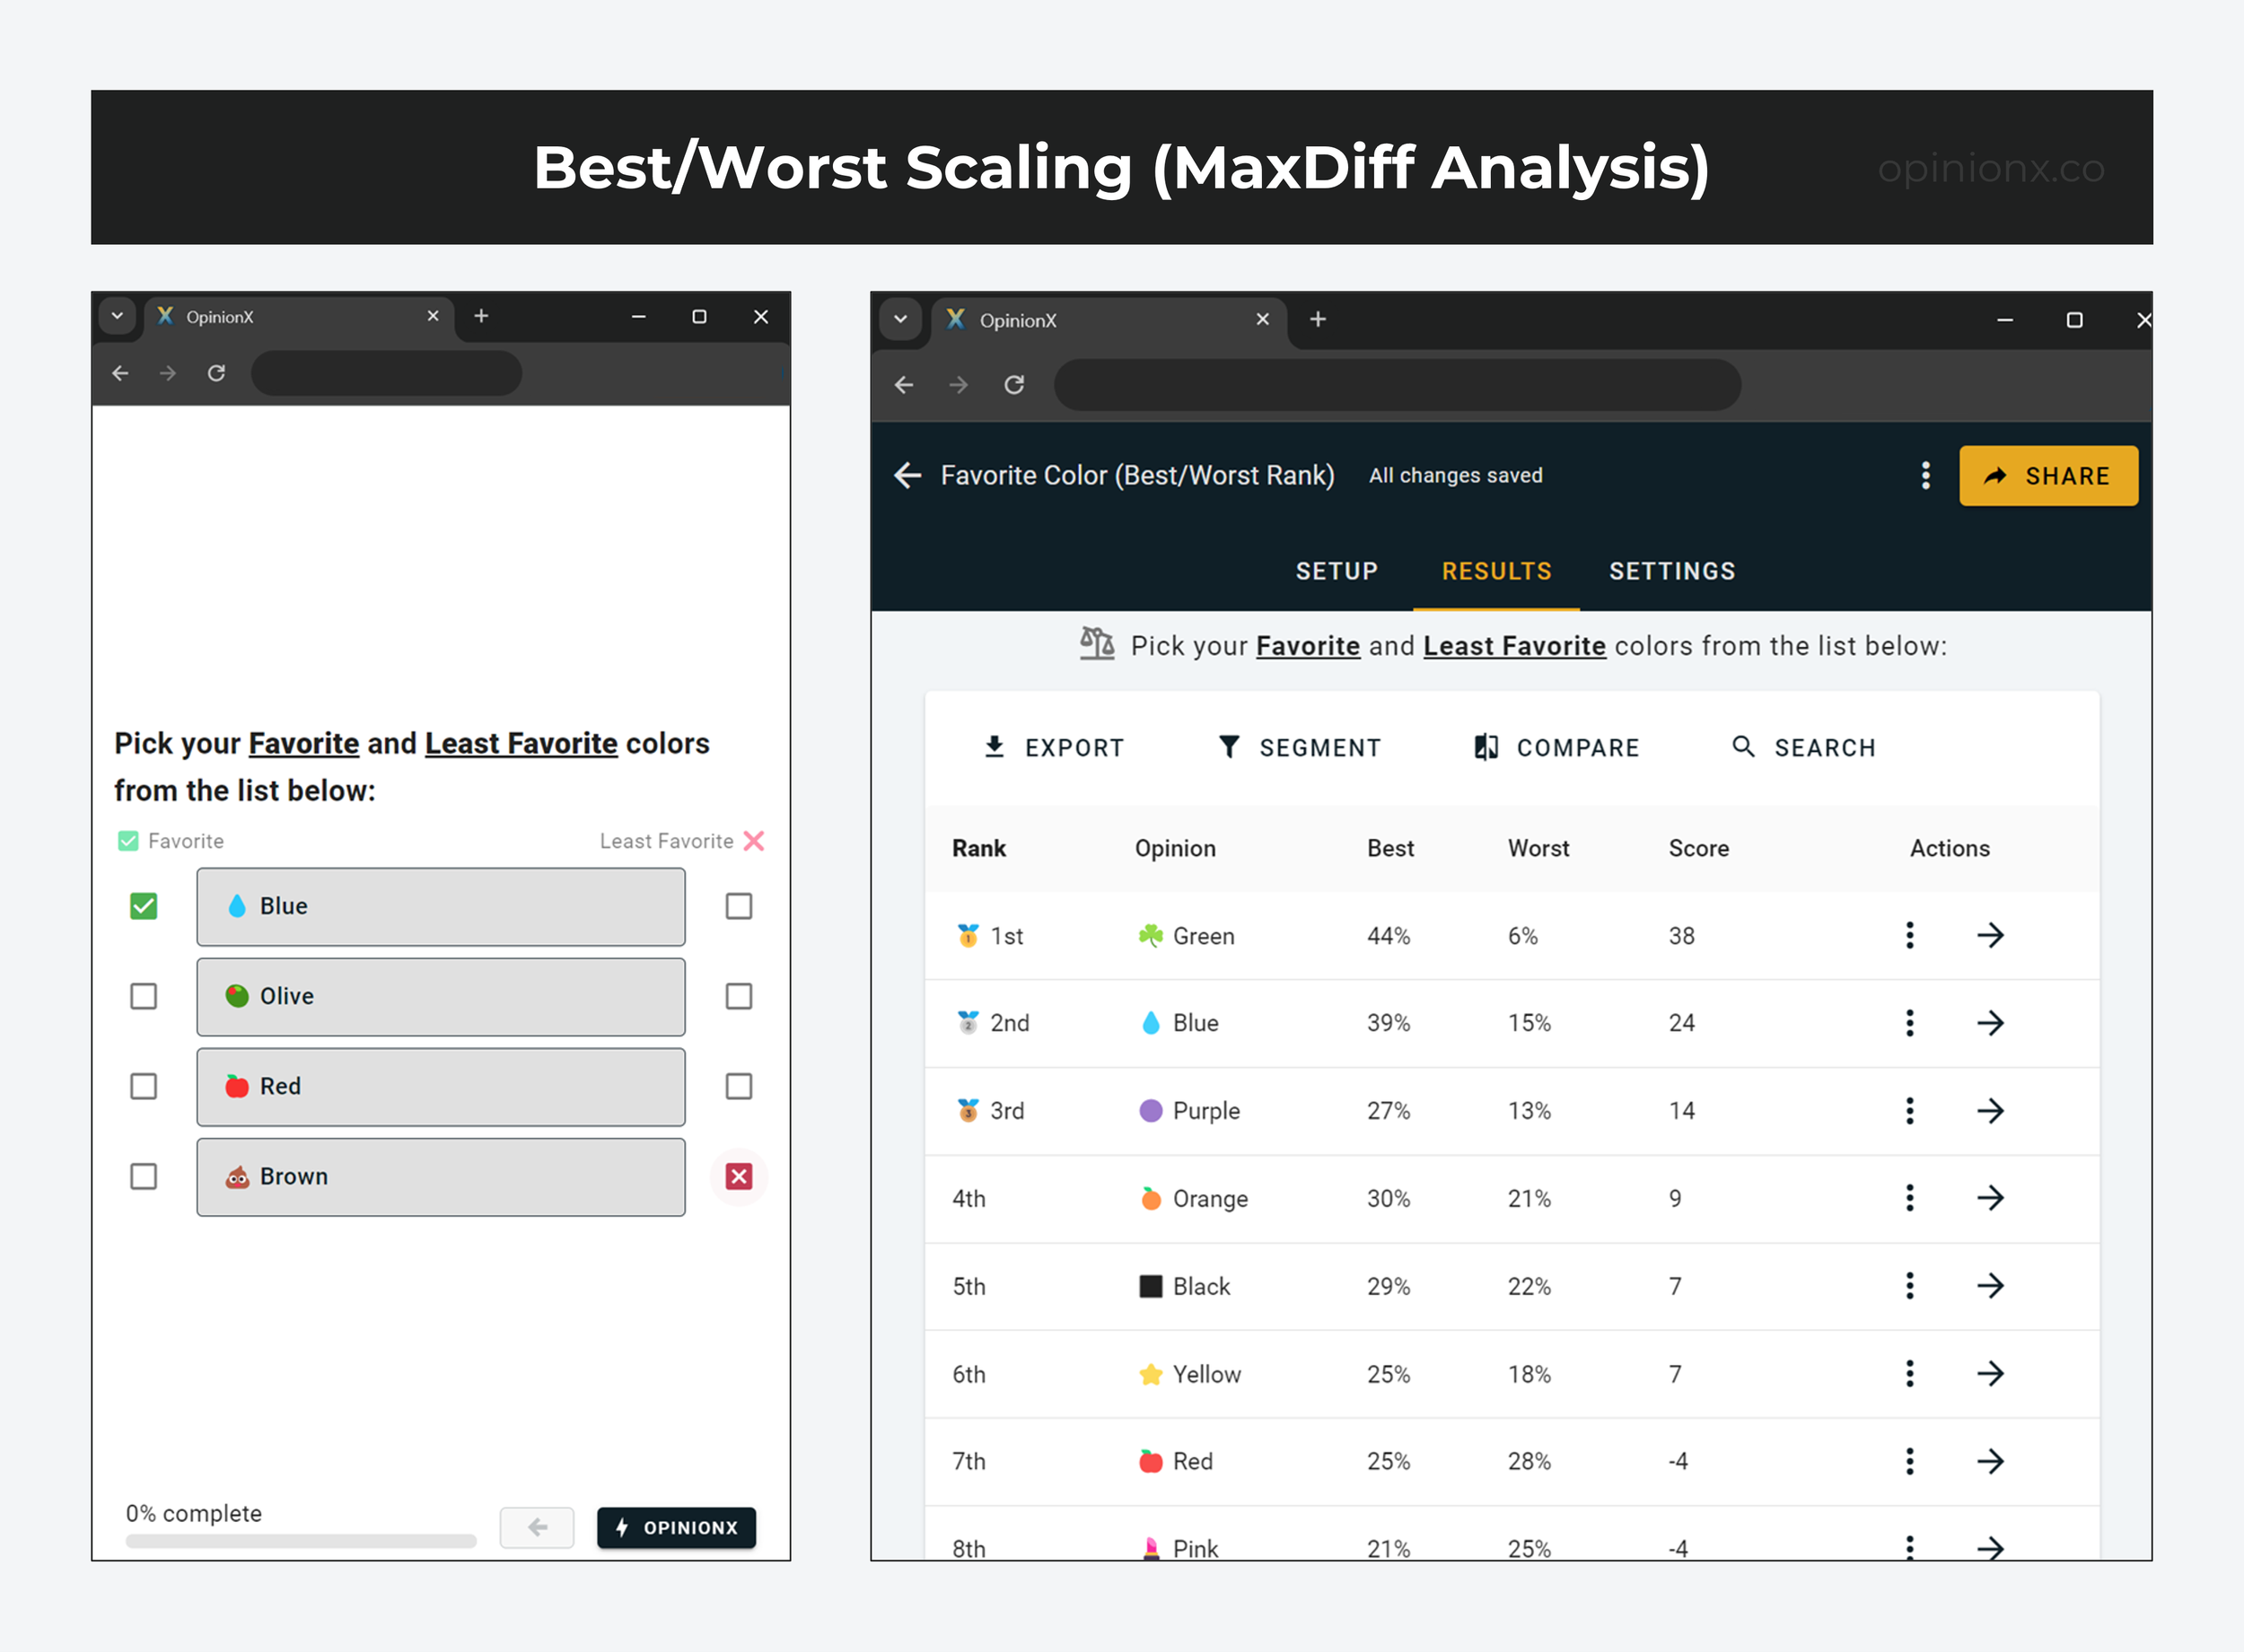
Explanation: MaxDiff Analysis shows respondents a list of options (usually 4-7 at a time) and asks them to identify the “best” and “worst” options from the list. Each time the respondent has finished, the list resets and a new set of options are shown.
Advantages: By showing 4-7 options at a time, MaxDiff collects more data per vote than pairwise comparison. It is also much less rigid and complex to set up than a Conjoint Analysis survey.
Disadvantages: MaxDiff has multiple times higher cognitive load than pairwise comparison by showing 4-7 options at a time instead of just 2. While this speeds data collection up, it slows the participant down considerably and requires more “considered” judgment for each vote to be reliable. Additionally, MaxDiff tends to be pretty expensive with a similar price tag to conjoint analysis tools.
Suggested Tools: OpinionX offers the only free MaxDiff survey tool on the internet
Interactive Example:
— — —
5. Agreement Voting
Explanation: Measures which option has the highest level of consensus agreement amongst a population of voters.
Advantages: In many scenarios (collaborative planning, educational settings, conflict resolution), it’s more important to identify consensus options that will move progress forward than to find a divisive option just because it has the highest number of votes. Agreement voting is extremely simple, quick, and easy to understand for both researchers and respondents.
Disadvantages: Agreement voting has no forced comparison or trade-off, so it doesn’t do a good job of simulating how people act in real life. Simple aggregate voting like this should not be used in most research scenarios.
Suggested Tools: OpinionX lets you create unlimited free Agreement Voting surveys with unlimited participants.
Interactive Example:
— — —
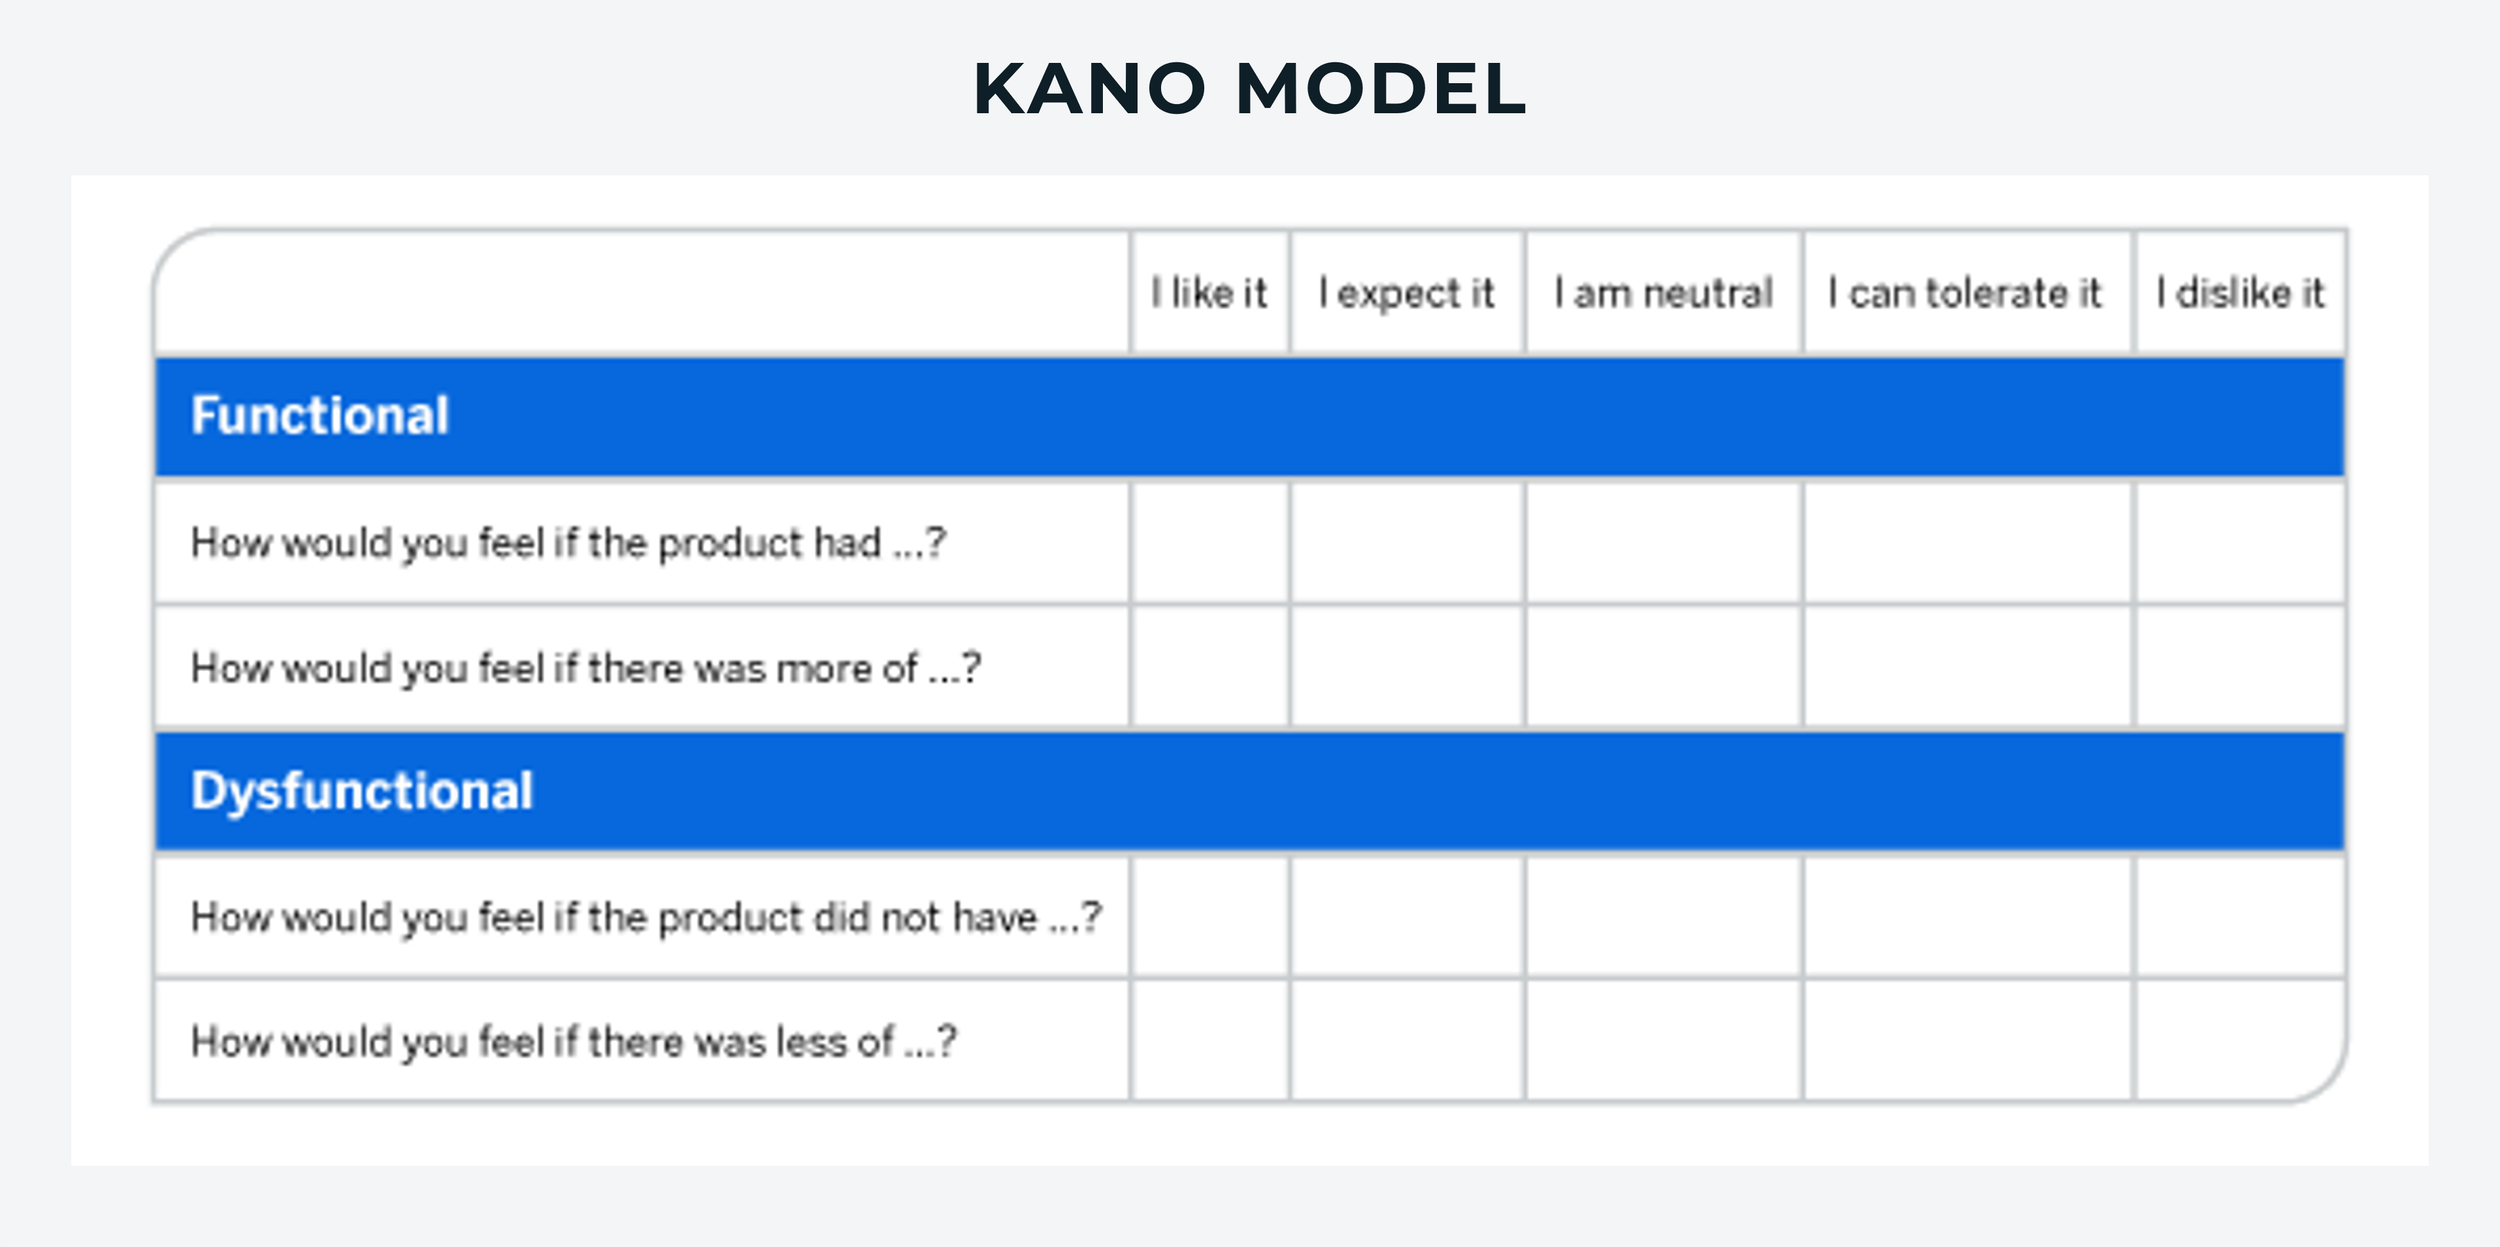
6. Kano Model
Explanation: The Kano Model shows a respondent a statement (usually about a specific feature or product functionality) and asks them to select one of five options: (1) I like it, (2) I expect it, (3) I am neutral, (4) I can tolerate it, (5) I dislike it.
Advantages: The main advantage of the Kano Model is that it helps you distinguish which features are expected (basic), which contribute to satisfaction (performance), and which can lead to delight (excitement).
Disadvantages: In my opinion, the Kano Model is not a good approach to trade-off analysis or understanding what matters most to people. It requires respondents to have a very clear understanding of the value that each individual feature translates into for them, which is rarely the case. It’s also a glorified 1-5 star rating scale, which has many proven issues in research, particularly for allowing respondents to pick the same score for every option and for not forcing any comparison between options, which is a fundamental aspect of trade-off analysis.
Suggested Tools: Any survey tool with a multiple-choice question or matrix grid question type (such as OpinionX).
— — —
7. Van Westendorp PSM
Explanation: Conjoint analysis is famous for pricing research, however, it can only be used if you already have a range of 2-7 potential price points you’re willing to consider for your offering. For many new products, particularly in emerging categories or based on technical innovations, you won’t have any benchmark price to even start at! That’s where the Van Westendorp Price-Sensitivity Meter comes in. It uses four open-response questions to help you find a reference point for what your initial pricing should be.
Advantages: Great for identifying a rough range of price points to consider for a new product or service. Simple setup and analysis that anyone can do. No advanced survey tool required.
Disadvantages: Only suitable for finding pricing estimates, not any other form of research, so it’s very narrow in usage.
Suggested Tools: Honestly, no need for any fancy tools here — just use a Google Forms questionnaire or a free OpinionX survey to collect people’s text response answers and manually create your Van Westendorp PSM graph in a spreadsheet.
— — —
Image Source: Quantilope
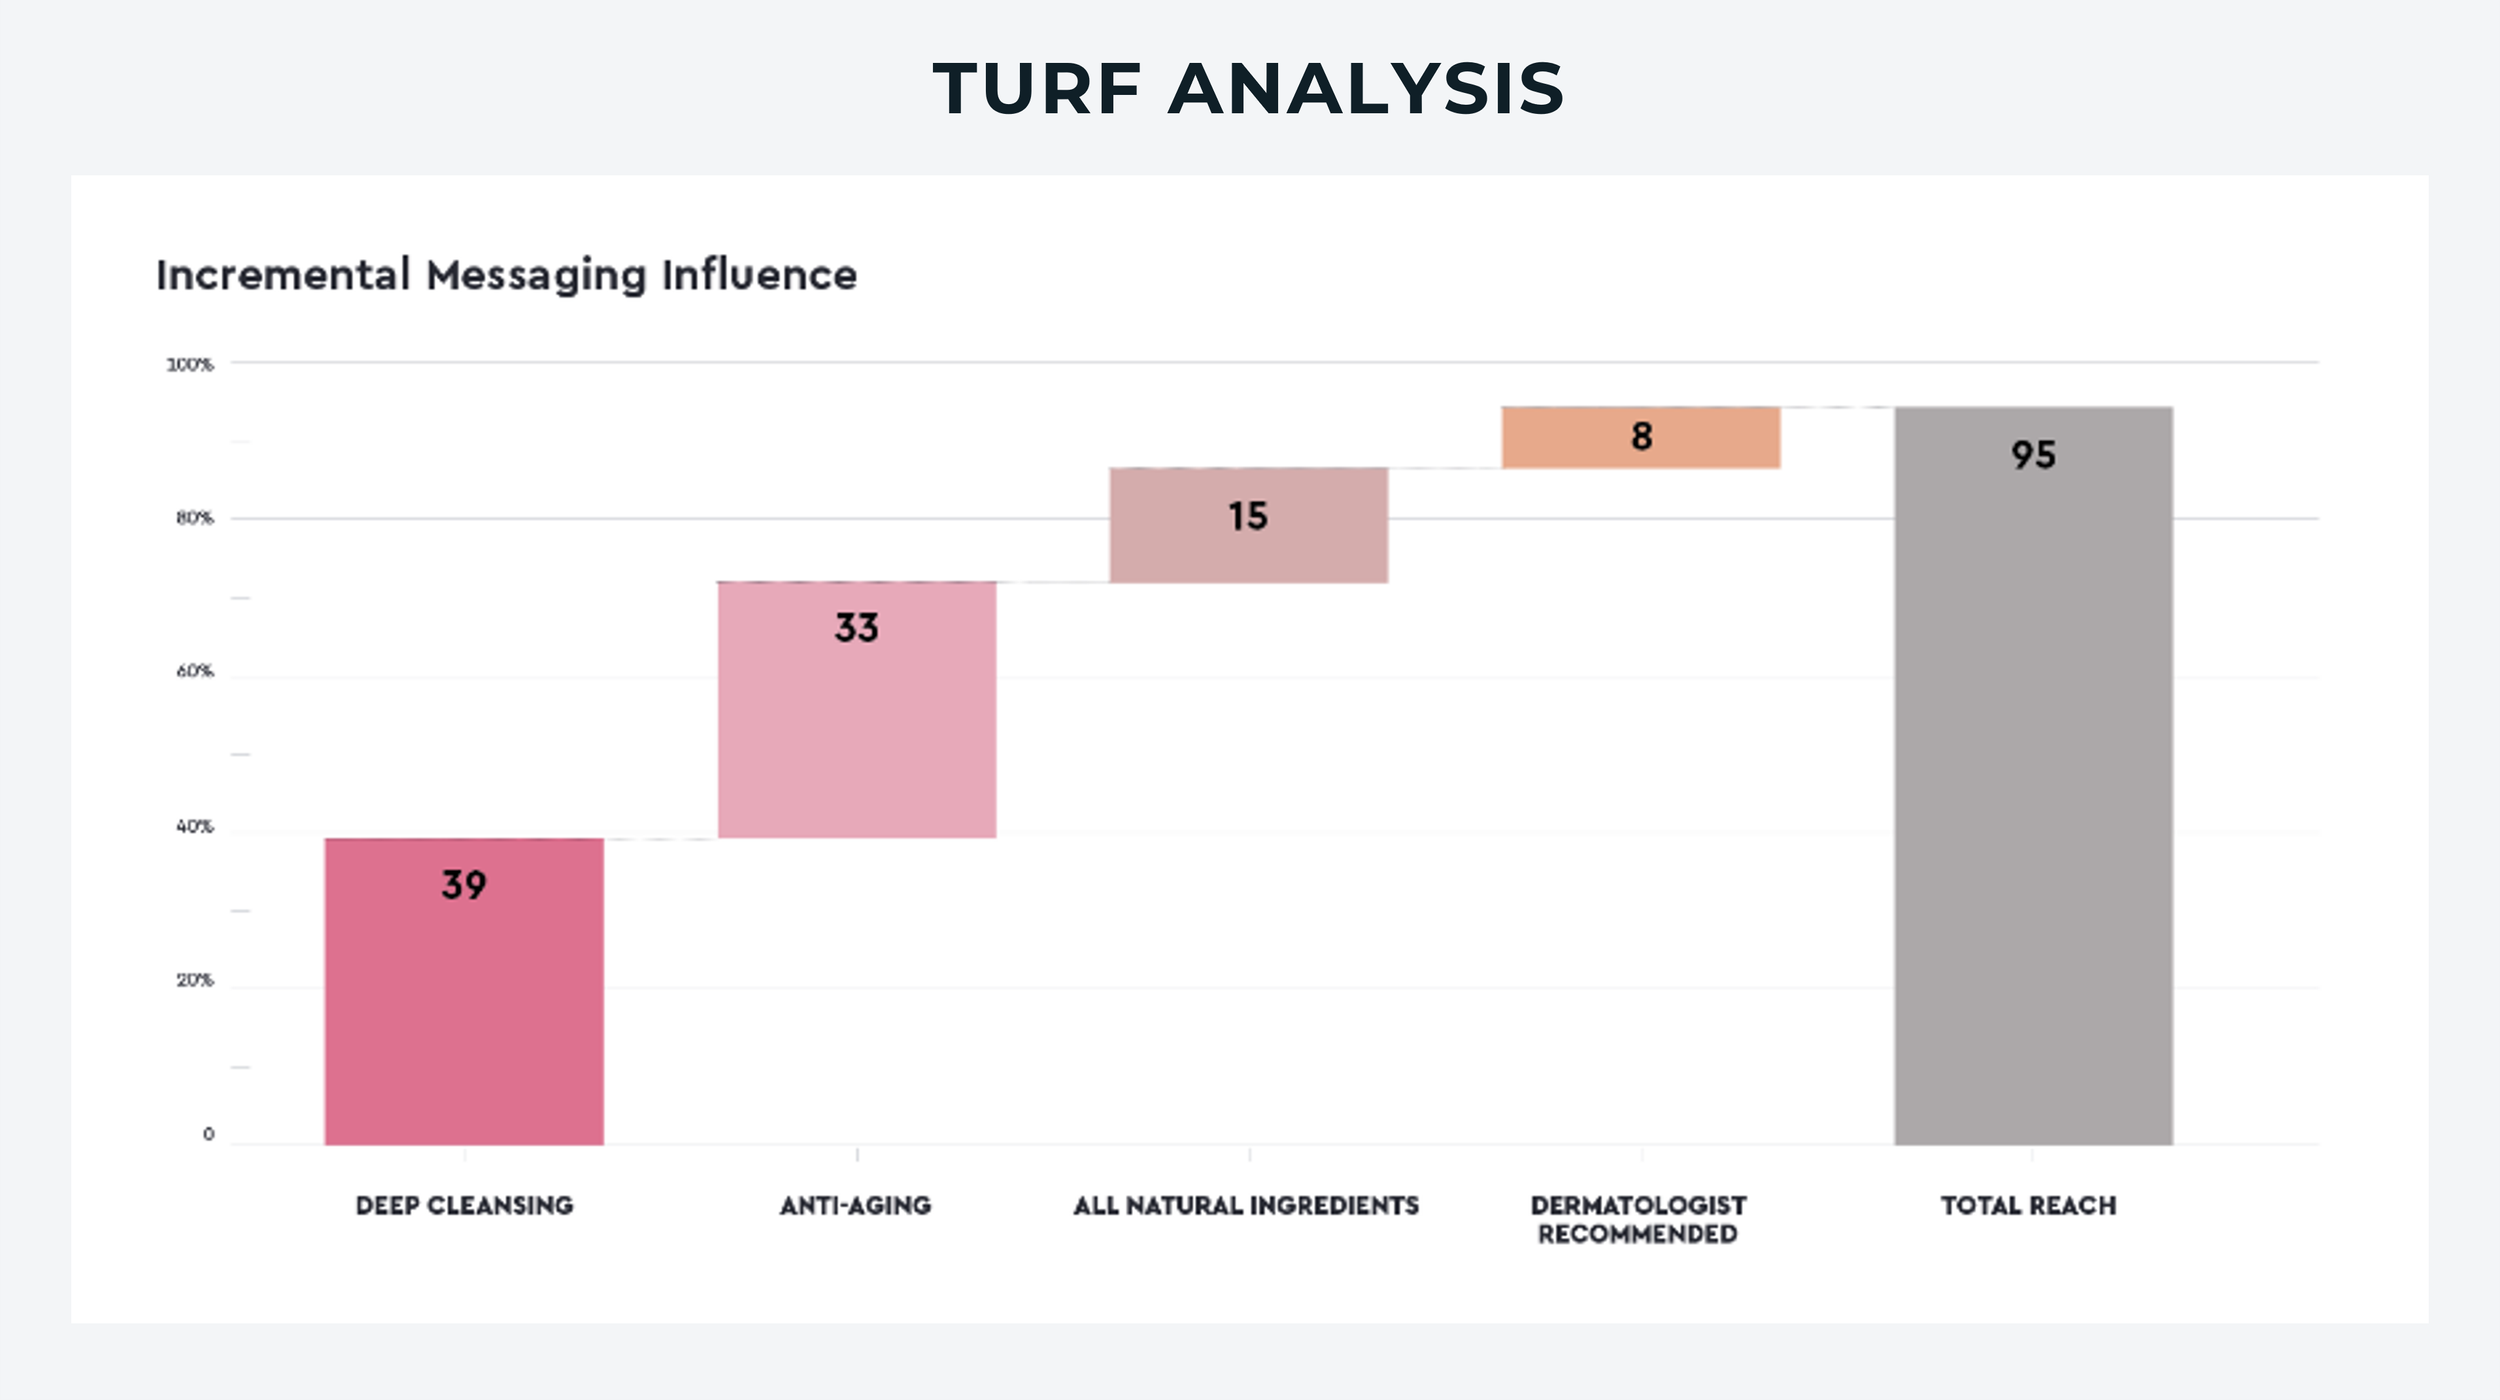
8. TURF Analysis
Explanation: TURF Analysis isn’t actually for data collection like the other methods shown. It’s a data analysis method that takes ranked data and finds the combination of options that have the highest combined preference that appeals to the most people possible (basically which two options are highly ranked but with very little overlap in who cares a lot about them).
Advantages: TURF Analysis is predominantly used for informing product bundling strategy, where it’s very useful in product or attribute mix selection.
Disadvantages: As it’s not a data collection method like the other alternatives, TURF Analysis relies on using an approach like Pairwise Comparison, MaxDiff or Conjoint Analysis to calculate the relative importance of each option first. It’s also only really useful when looking for the lowest input approach to maximizing output effect, which is not a common research requirement.
Suggested Tools: Sawtooth Software ($4,500/year for TURF Analysis) or QuestionPro’s “Research Suite” Package ($5,000/year).
— — —
How To Pick The Right Choice-Based Research Method
If you’re trying to model market share scenarios, calculate willingness-to-pay for existing product features, or simulate competitor comparisons in mock buying decisions, then it’s hard to beat conjoint analysis. But the vast majority of research projects people consider conjoint for are not made for conjoint, so pick a more flexible, easier-to-use method that’s available for a much cheaper price (or even for free) instead.
Further Resources About Conjoint Analysis
• Ultimate Guide to Conjoint Analysis (Explanation, Tools, Examples)
• 10 Scenarios where you should NOT use Conjoint Analysis
• 13 Types of Conjoint Analysis (Explained with Image Examples)
• Comparing the Top 10 Tools for Conjoint Analysis Surveys
• How your Conjoint Analysis results are calculated (advanced guide)
— — —
About The Author:
Daniel Kyne is the Co-Founder of OpinionX, a free research tool for stack ranking people’s priorities — used by thousands of product teams to better understand what matters most to their customers. OpinionX has a bunch of free research methods for ranking people’s preferences — including free Conjoint Analysis surveys alongside other ranking methods like Pairwise Comparison and Points-Based Voting.
→ Create a FREE Conjoint Analysis Survey now
Subscribe to The Full-Stack Researcher newsletter for actionable user research strategies made specifically for founders and product teams:

