
What is Best-Worst Scaling? (Examples, Methods, Free Tools)
What is Best-Worst Scaling?
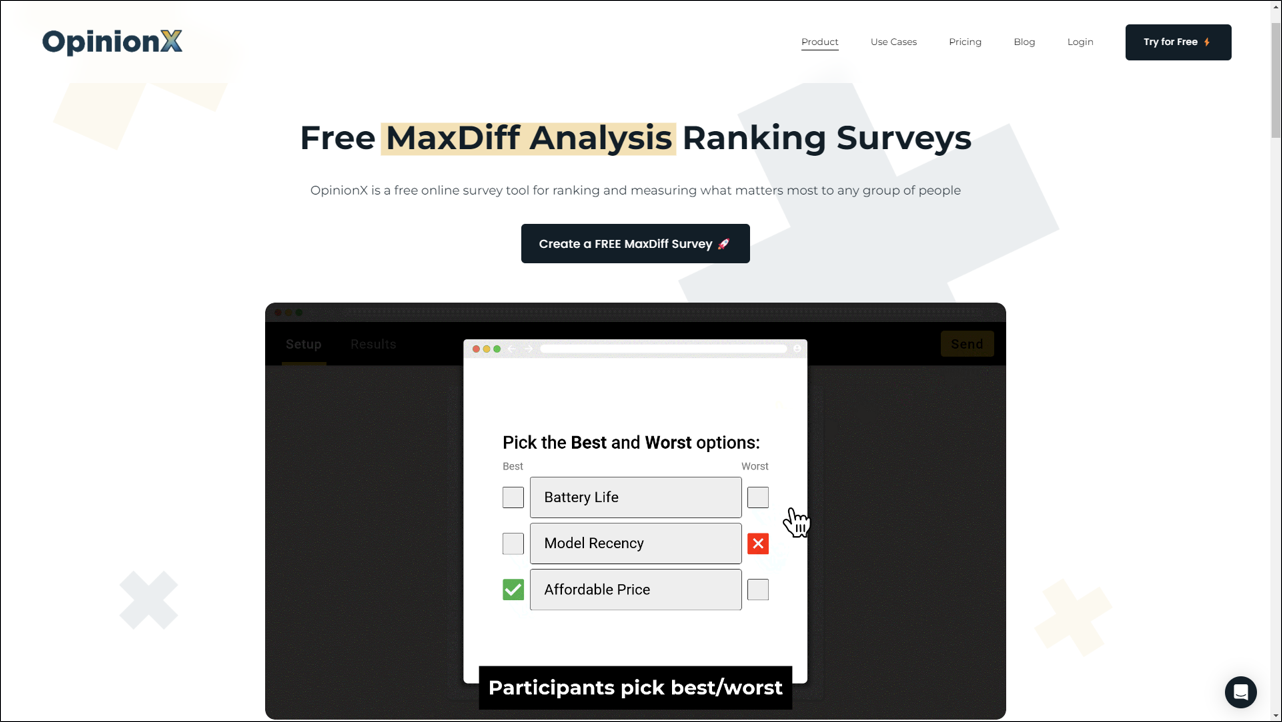
Best-Worst Scaling is a survey method for ranking people’s preferences by asking them multiple times to choose the best and worst option from a group of statements. Typically only 3-6 options are shown at a time, although you can show more than 6 if required. Each time the respondent votes, a new set of statements from the overall list of ranking options is shown. The “best” and “worst” labels can be changed to suit your research occasion, such as Favorite / Least Favorite, Top / Bottom, or Most Preferred / Least Preferred.
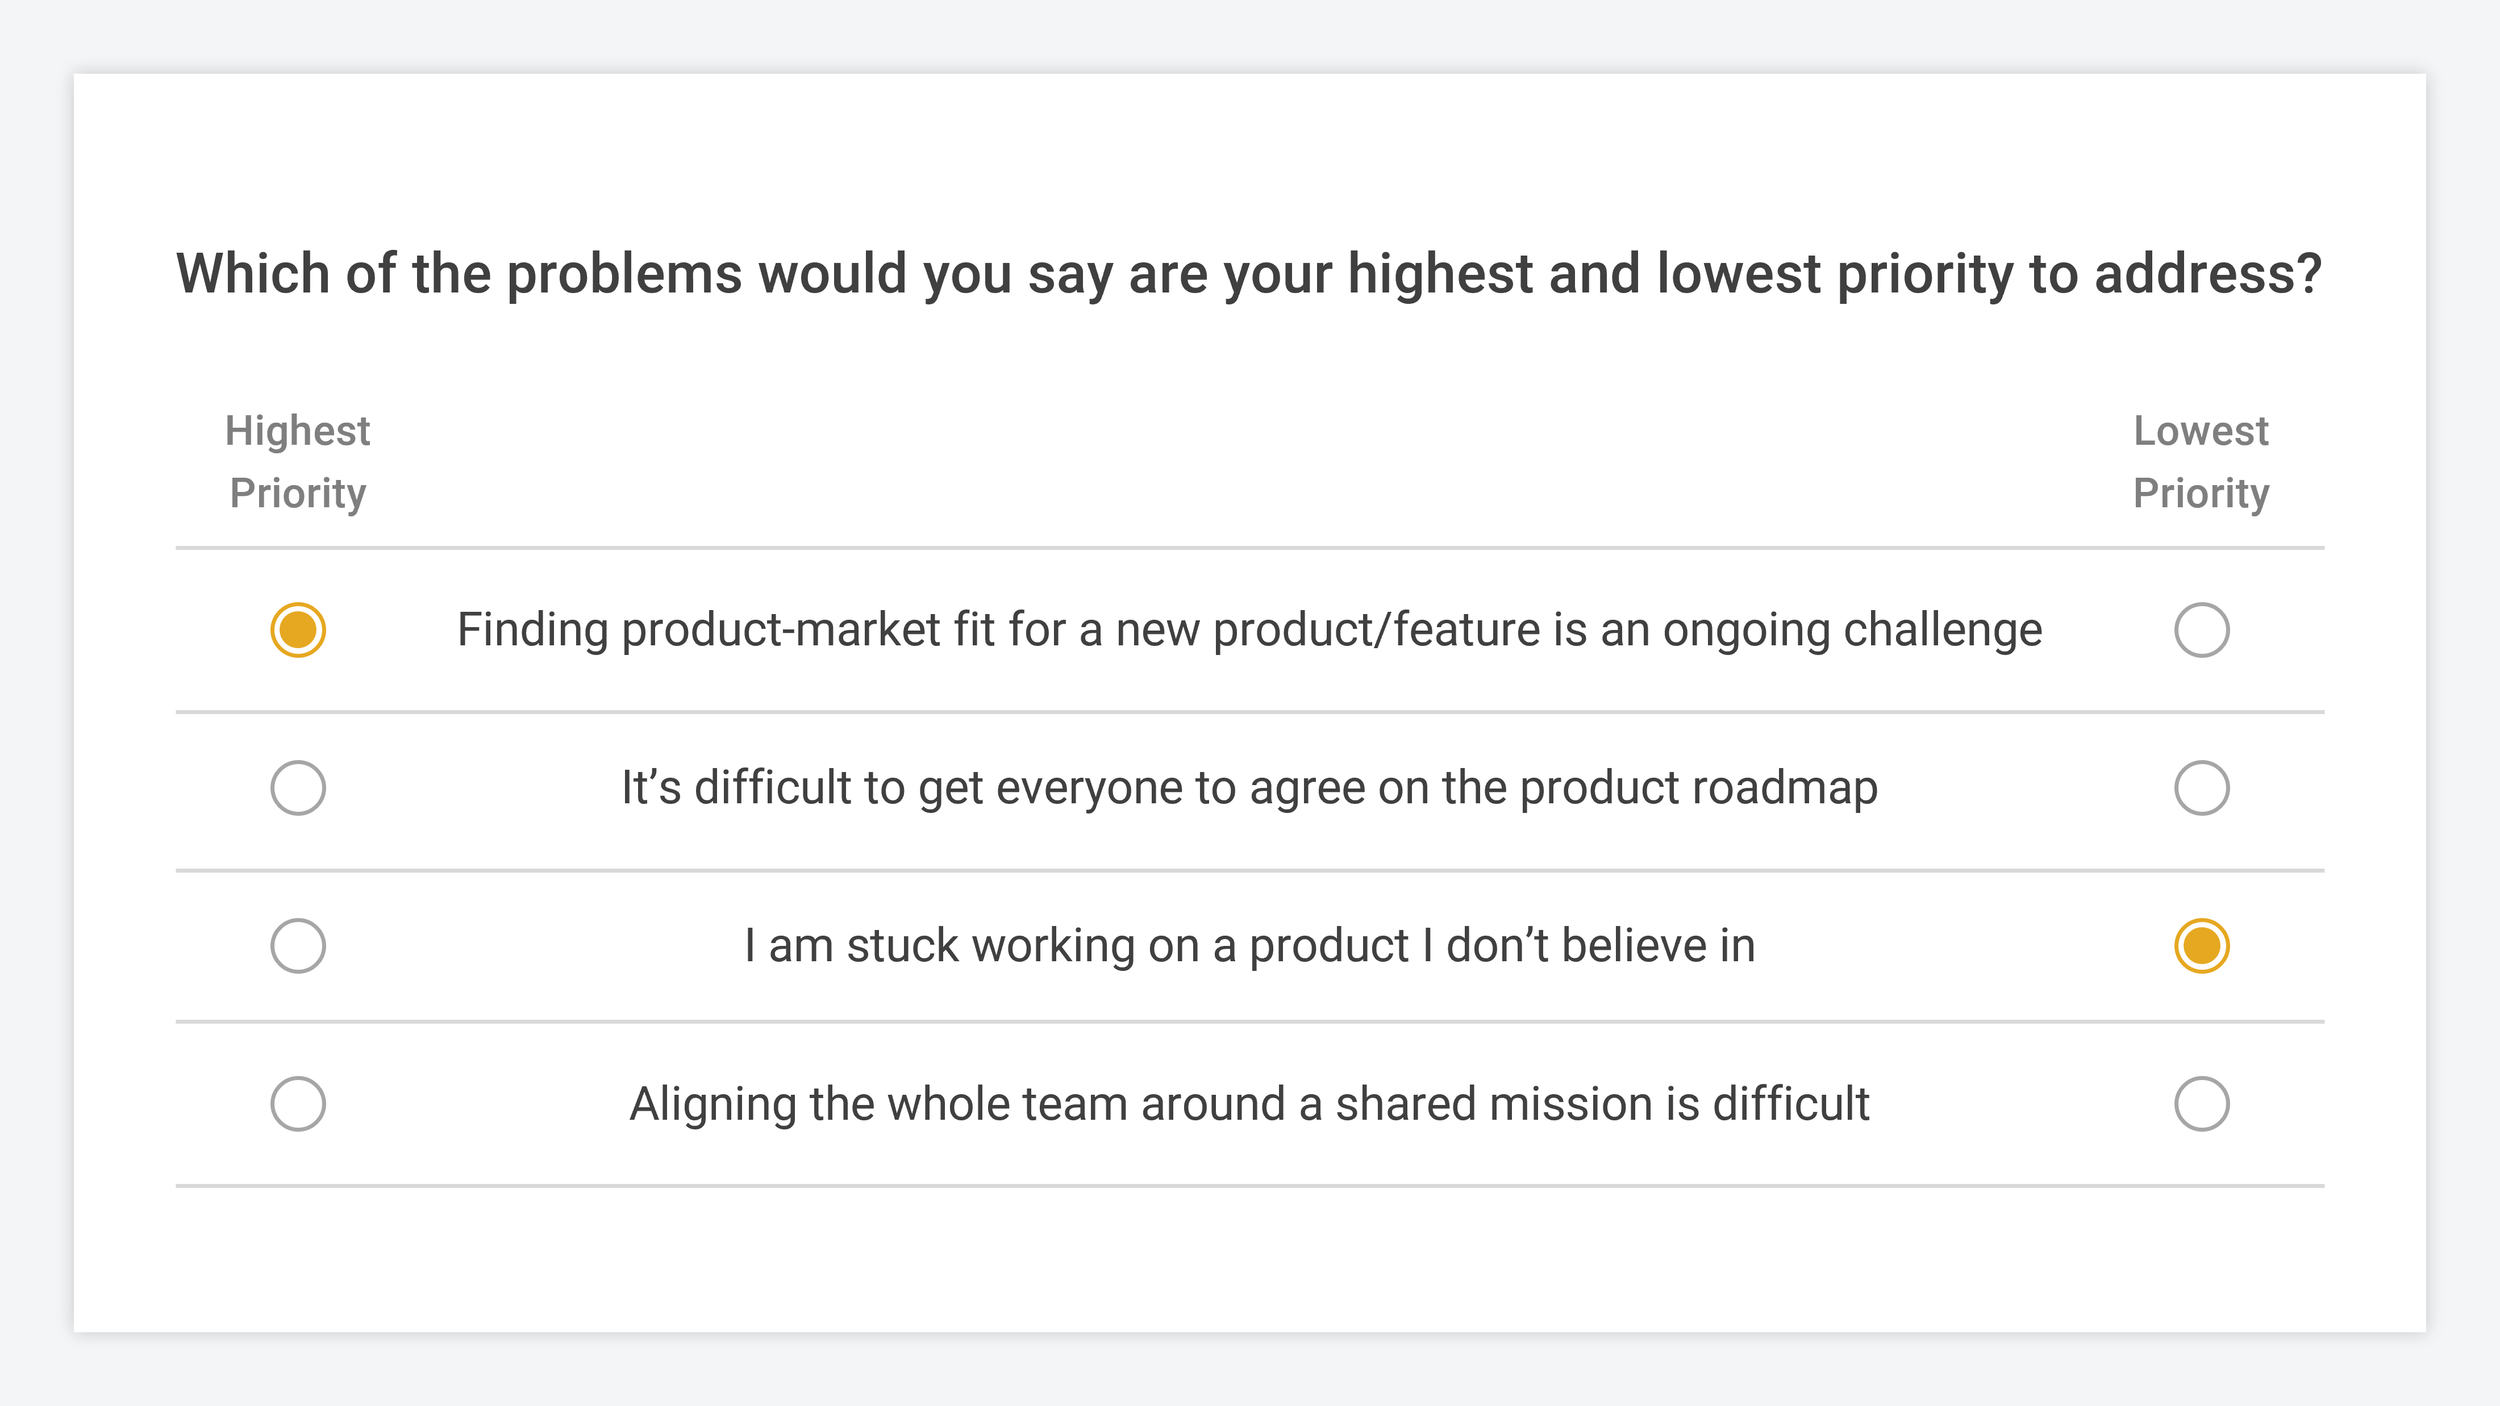
A typical Best-Worst survey question with a set of written options and radio buttons / checkboxes representing “Best” and “Worst” on each side.
Interactive Best-Worst Scale Example Survey
The best way to understand how Best-Worst Scaling surveys work is to try one for yourself! Here’s an example of a Best Worst Scale questionnaire being used to rank a list of colors from most to least preferred. You’ll be shown 7 voting sets, after which you can see the overall results:
How is Best-Worst Scale different from other types of survey questions?
Best-Worst is a comparative ranking method — it forces respondents to compare and choose between options according to their personal preferences. This means that Best-Worst Scales create “continuous” data where answers are all plotted from highest to lowest on a full range of scores.
On the other hand, rating questions (eg. a scale with 5 stars) produce “discrete” data, which means that responses are pooled around fixed numbers like 3/5 stars, 4/5 stars, etc. This makes rating scale questions bad for researchers who are trying to compare and rank things because participants can answer rating scale questions like this:

^ This is exactly why researchers go for forced comparison methods like Best-Worst Scaling instead of rating-based questions like Likert Scales — it’s much better at mapping the minor differences in people’s preferences even when they like all the options.
The gaps between people’s preferences are the most important output of ranked results. If we use rating questions, we lose all this rich insight — people’s top priorities all get lumped together under the “5/5 star” response. To avoid this, we want to make sure we’re using research formats that force participants to compare options against each other, such as Best-Worst Scaling.
When is Best/Worst Scaling used?
Best/Worst surveys measure people’s priorities, which means they is well suited for a bunch of different research scenarios such as…
1. Prioritization: Ranking problem statements to figure out which pain point has the largest negative impact on your key customers or which feature they would most like to see built.
2. Sales / Marketing Research: Comparing messaging ideas or product claims to see which resonates best with your target audience.
3. Pricing Research: Identifying which features deliver the most value to customers on a specific pricing tier so that you can improve feature discovery or upgrade messaging (real-life example of this).
4. Group Voting: Quickly measuring the preferences or priorities in a room helps make group situations like workshops or team meetings more participatory. Best/Worst is particularly useful when you’re trying to rank subjective opinions or a long list of options.
5. Customer Segmentation: Because Best/Worst scales measure each person’s preferences, they produce a great data set that you can use to compare the differences in what people from different segments care about (ie. needs-based segmentation).
What’s the difference between Best-Worst Scaling and MaxDiff Analysis?
MaxDiff Analysis and Best-Worst Scaling are not the same thing (this is a common misconception that people have been spreading online for decades). MaxDiff Analysis describes the data collection method itself, which requires respondents to pick the two options with the greatest difference in preference or importance. Best-Worst Scaling describes output data that is sorted on a scale from best to worst, which can be done using a range of choice-based comparison methods, only one of which is MaxDiff Analysis. Best-Worst Scaling can also be achieved using Pairwise Comparison, Ranked Choice Voting, or Conjoint Analysis, for example.
While many sources disagree on this distinction (even ChatGPT says they’re the same thing), within academia the definitions for both terms have been correctly differentiated in this manner since 2005 onwards. However, outside of academia, the two terms tend to be used interchangeably (even on OpinionX surveys, we use the name “Best/Worst Rank (MaxDiff)” for the question type to cover both terms), so don’t sweat the difference too much :)
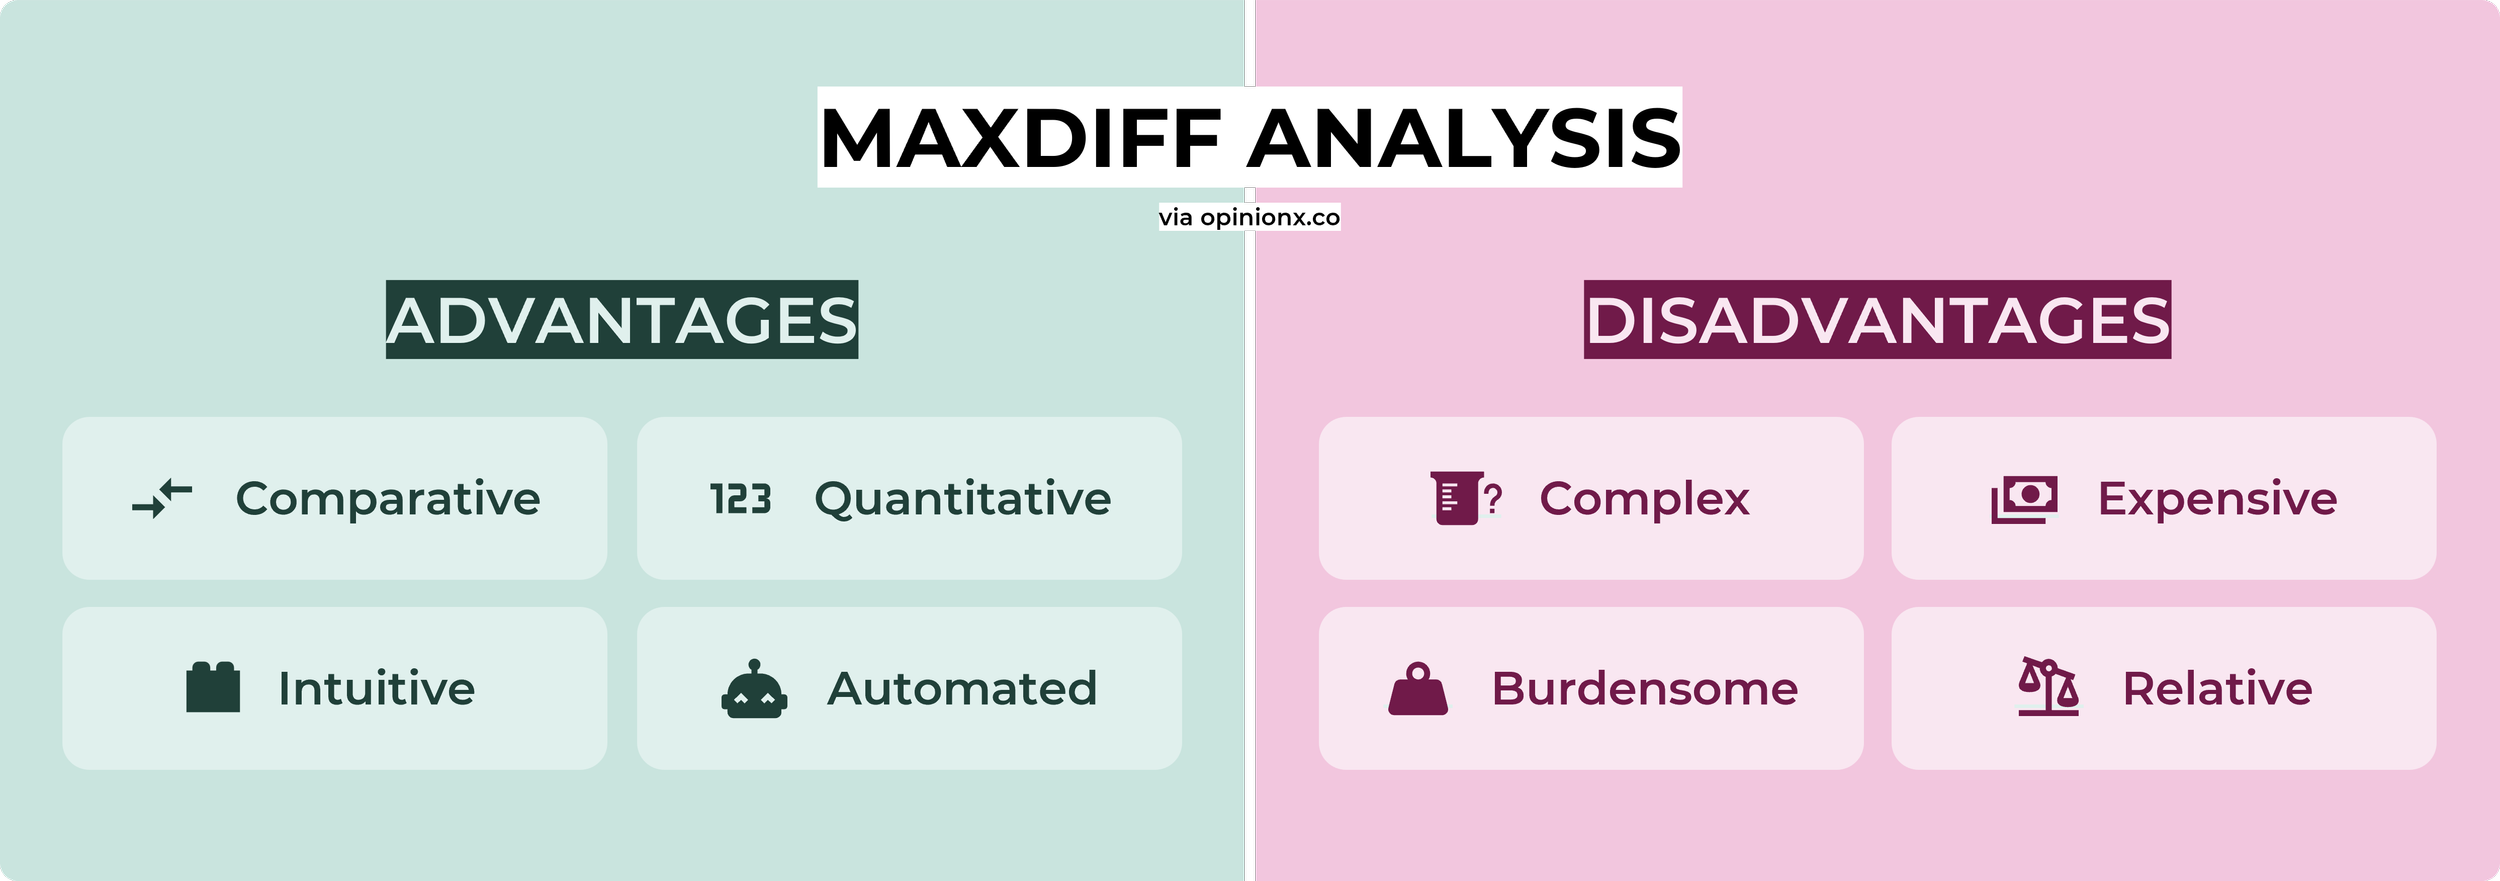
What are the advantages of Best-Worst Scaling?
1. Comparative: By forcing people to compare options, Best-Worst Scaling helps you translate your preferences or opinions into a ranked list without having to put everything manually in order.
2. Quantitative: Best-Worst Scaling is a great way to turn text and images into numerical statistics. Most companies tend to value quantitative data over opinions and quotes, so Best-Worst Scaling is ideal when planning and informing big decisions.
3. Intuitive: Best-Worst surveys are so simple that a 6-year-old could complete them — just pick the best and worst options from a set of 3-6 choices multiple times. It also works just as easy on mobile and tablet as it does on desktop. Manually ranking or ratings a long list places a much higher cognitive load on respondents.
4. Automated: The structured nature of voting means that collecting and analyzing Best-Worst Scaling data is just as easy with 10 respondents as it is with 10,000, allowing you to run Best-Worst surveys at scale and get better data for advanced analysis like customer segmentation.
What are the disadvantages of Best-Worst Scaling?
1. Complex: Some products use advanced scoring methods such as linear regression or Bayesian rating systems to translate Best-Worst votes into statistics that can be difficult to decipher for most people. I prefer a simple formula like (best-worst)/appearances that gives each option a score from -100 to +100, which is a lot easier to explain (and defend if someone challenges your results!). This simple formula is how the Best-Worst Scaling question type “Best/Worst Rank” calculates the final scores on OpinionX surveys.
2. Expensive: Most research tools consider Best-Worst Scaling to be an advanced research method — for example, SurveyMonkey charges $2700 to access their Best-Worst Scaling question (8x higher than their entry-level price). OpinionX offers a free Best-Worst Scaling survey tool where you can have unlimited participants and unlimited ranking options, plus some optional premium features for stuff like segmentation analysis.
3. Burdensome: While Best-Worst Scaling may be intuitive, it can become cognitively burdensome if you show too many options at a time. The general rule of thumb is 3-6 options at most. If in doubt, you can switch to Pairwise Comparison which only shows two ranking options at a time.
4. Relative: Like all discrete-choice analysis methods, Best-Worst Scaling scores the preferences of items relative to each other. This may tell us that one option is better than the others in your list, but it won’t tell us if our overall list of options is a good or bad batch from an absolute perspective. You should always do qualitative research beforehand to ensure your voting list includes a sufficient range of options.
How are Best-Worst Scaling results calculated? How does Best-Worst ranking methodology work?
While some tools offering Best-Worst Scaling surveys use advanced algorithms like Bayesian statistics models or linear regression, I’ll stick to the more common aggregate-scoring method for this explanation.
The Aggregate-Scoring Method for Best-Worst Scaling takes the total number of “best” votes, subtracts from it the total number of “worst” votes, and divides the result by the total number of times the option appeared to participants — ie (best-worst)/appearances. For example, if the option appeared in 100 voting sets where it was picked as the best 50 times and the worst 15 times, it would be (50-15)/100 = 35%. Here’s an example of what results look like on an OpinionX “Best/Worst Rank” survey:
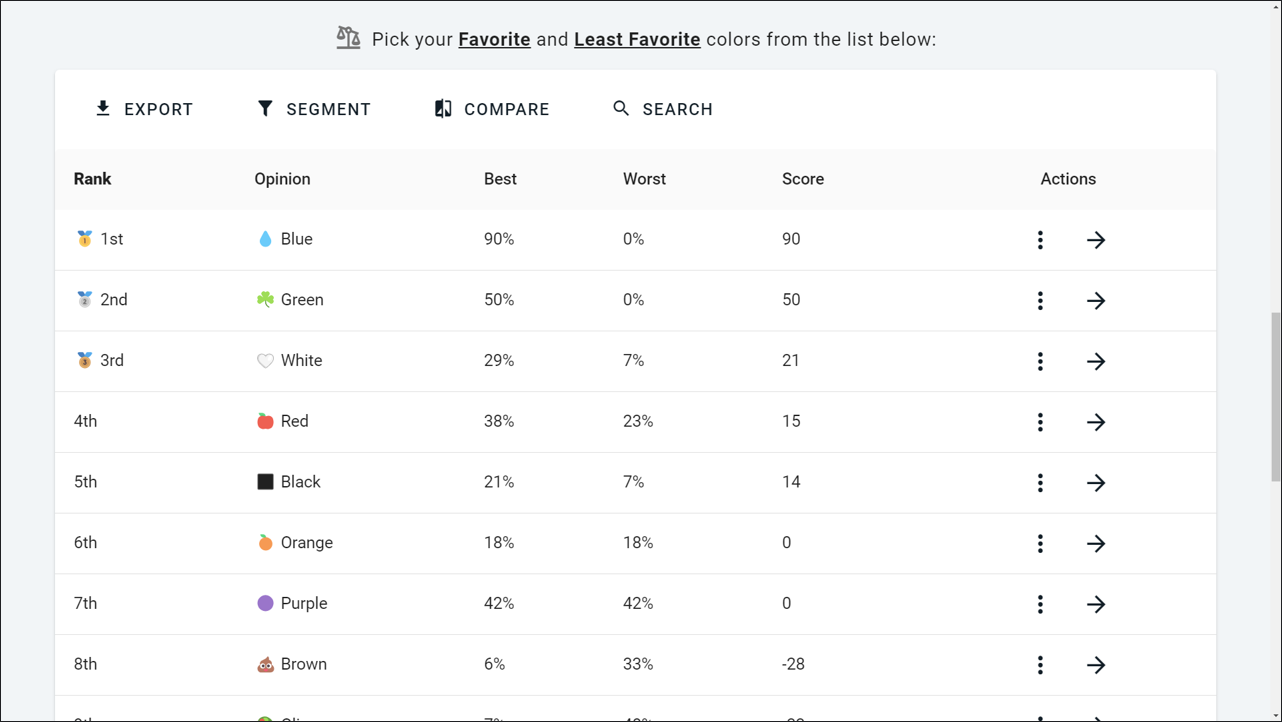
Screenshot of the results table on a Best/Worst Rank survey hosted (via OpinionX)
How do you calculate a target sample size for your Best-Worst Scaling project?
Most guides to Best-Worst Scaling will give you an arbitrary minimum of 100 participants to generate a robust sample size, but this is complete nonsense. The only way to determine the right target sample size is based on the configuration of your Best-Worst Scaling survey. Thankfully OpinionX comes with a built-in calculator to help you find the perfect configuration so that your survey produces a robust result — here’s how that calculator works:
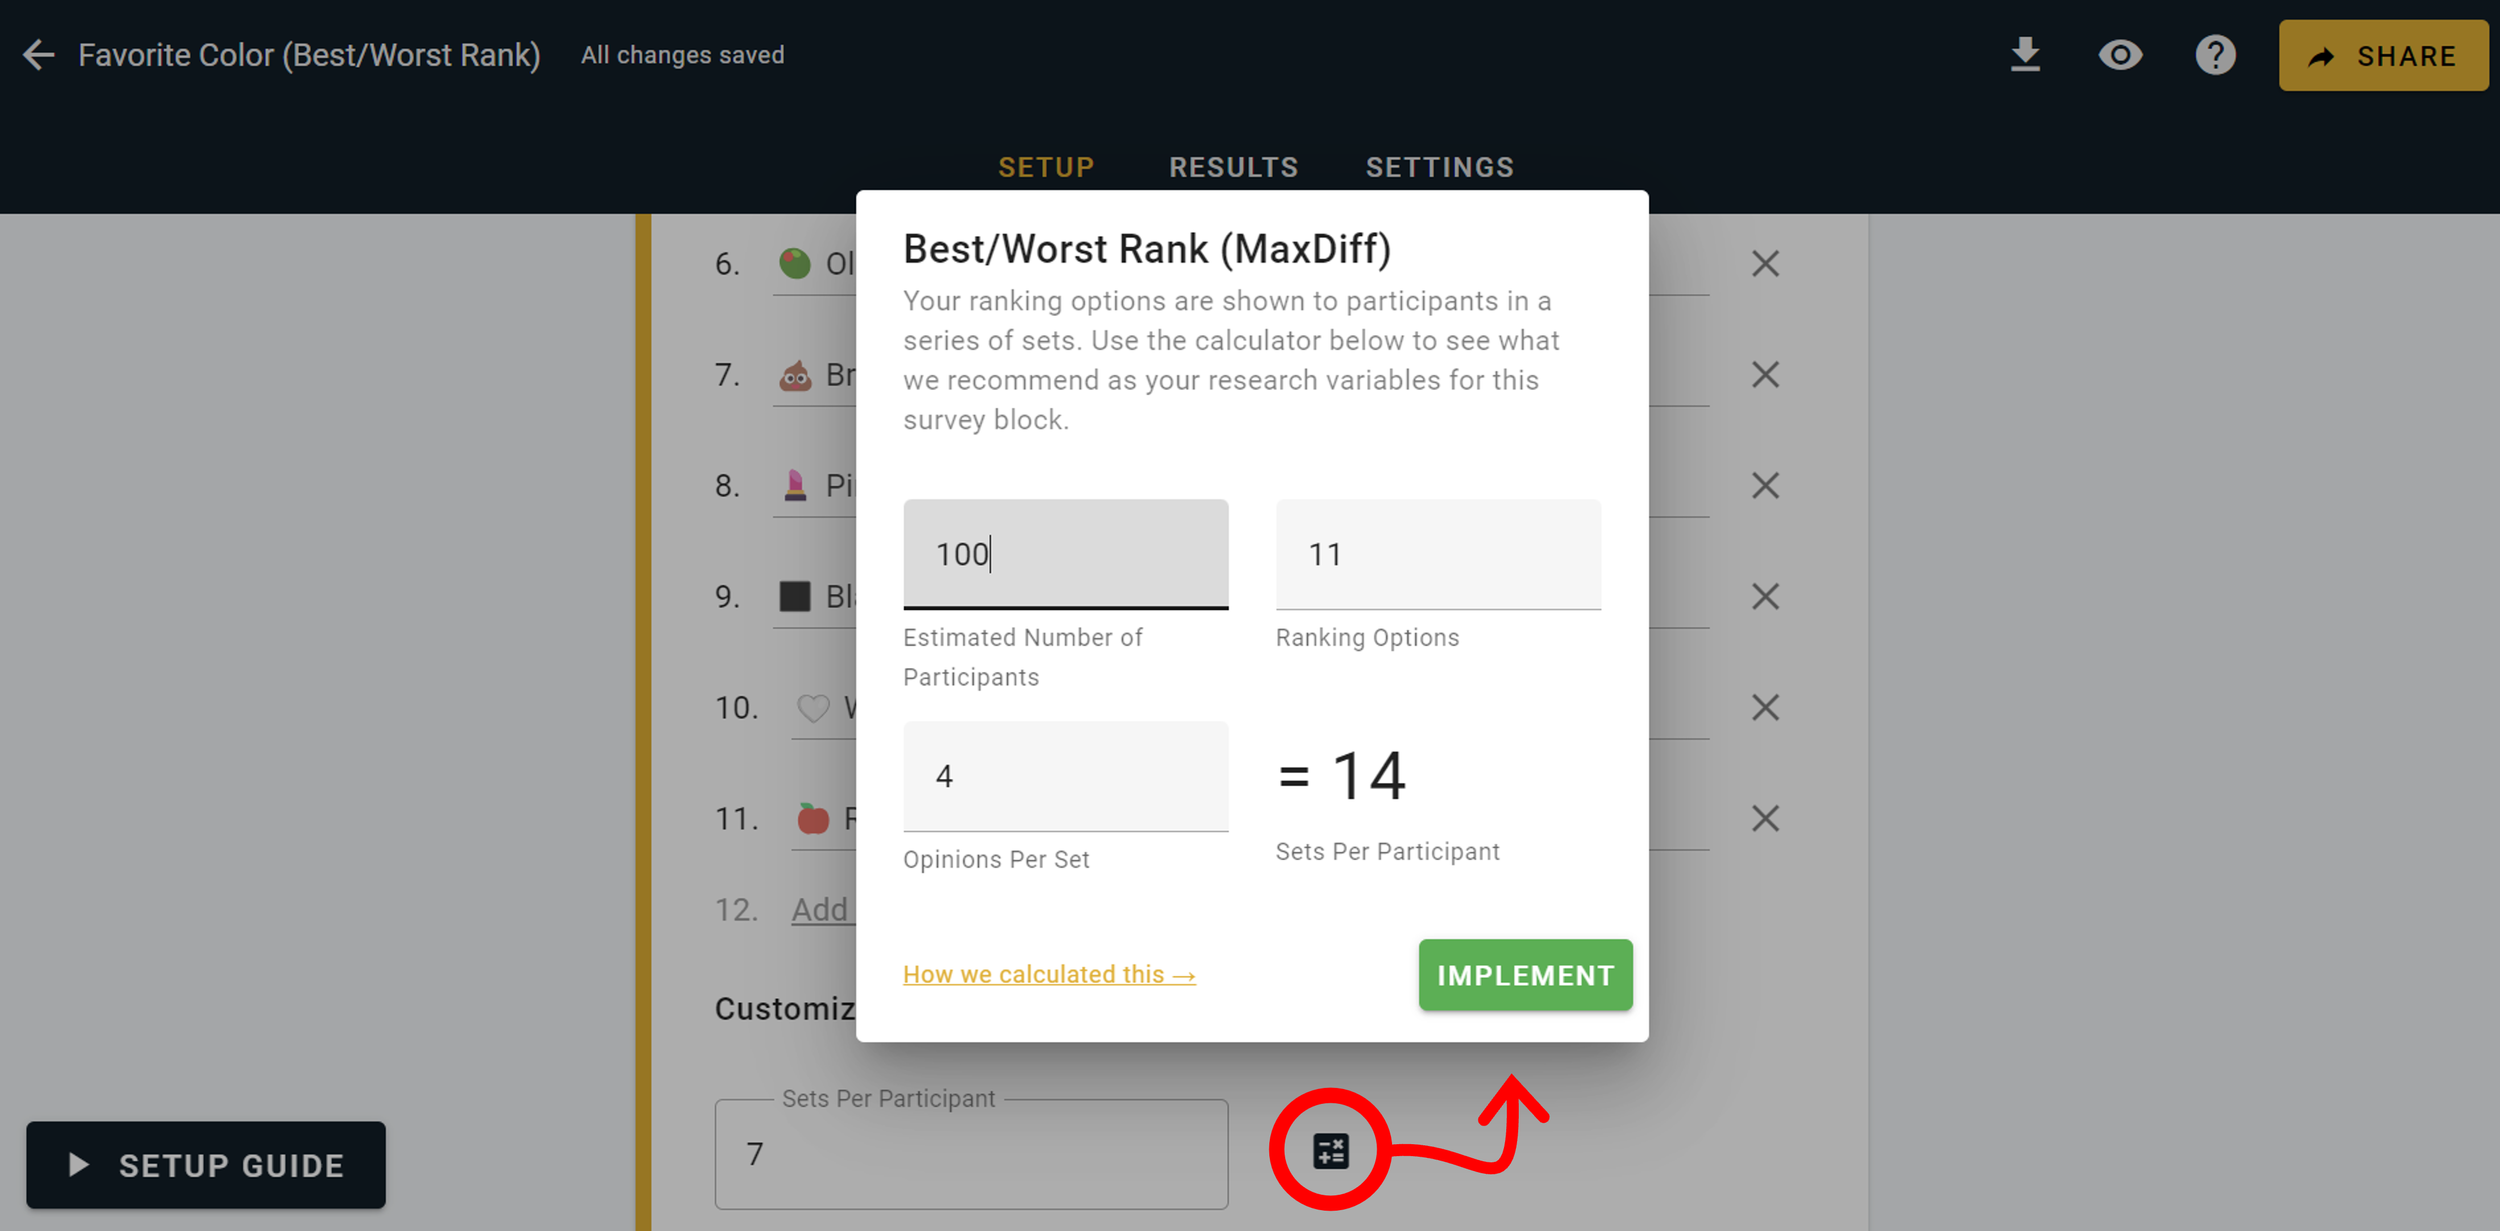
Every Best-Worst Scaling survey is made up of the same set of variables:
x= total number of ranking options in your survey (x = 11 in the screenshot above)n= number of options per set (ie. how many options are shown in each comparison vote)p= number of participants that will complete your survey (your minimum estimate)s= number of sets per participant (ie. how many times they'll have to pick Best/Worst)r= robustness variable that ensures each option will appear in at least r comparisons total
Together, these variables combine as the following formula → rx/np=sr variable to at least 200 — ie. every option should appear for voting at least 200 times during your survey. Otherwise, the other variables are all dependent on how you choose to build your own survey. The formula output, s (sets per participant), is the easiest variable you can alter to control the robustness of your results.
So if we have a survey with 30 ranking options (x), where 4 options are shown in each set (n) and I expect to be able to get at least 80 people to complete my survey (p), then I can use the formula to calculate how many sets to show to each participant → 200(30)/4(80) = 18.75. For these robustness calculations, if you ever get a decimal output, it’s a good principle to always round up! In this case, the number of sets per participant (s) is 19.
Some Best-Worst Scaling Calculation Caveats:
1. Generally, if the formula results in s < 10, I would still show 10 sets to each participant — Best/Worst voting takes just a few seconds for each set, so gathering extra data can only be a good thing (as long as the rest of your survey is not too long; see point 3).
2. You can also use this robustness formula to calculate other variables as the key output, not just the number of sets per participant. For example, I could use the formula to figure out the number of participants to recruit by moving the variables around like this → p=sn/rx3. If your survey has multiple ranking questions, you should consider the total number of votes a participant will have to cast across your entire survey when deciding on the number of sets per participant (s) for your Best/Worst block. The higher your total number of sets across the whole survey, the lower your completion rate will be — generally, anything above 40 sets within a survey is a lot to expect of any participant (unless you provide a strong incentive like a financial reward).
4. If segmentation is going to be an important part of your analysis, you should substitute the "participants" variable for your estimate of the total number of people you expect to reach from your smallest key segment.
Comparing The 10 Most Popular Tools For Best-Worst Scaling Surveys
For each of the tools in this list, I considered the following criteria:
1. Is there a free version available?
2. Can I try it myself without having to talk to a sales team?
3. Is the survey well designed / usable and are there sufficient analysis features?
As you’ll see, all but one of the tools turned out to be paid-only and for some I couldn’t even find proof that they really have a Best-Worst Scaling format at all…
1. OpinionX ✅
OpinionX is a free survey tool for ranking people’s priorities. It comes with a question type called “Best/Worst Rank” which you can use on the free version of the tool. There are no usage-based limits on the free version of OpinionX, which means you can create unlimited surveys with unlimited questions, engage unlimited participants, and invite unlimited teammates to view your interactive results — all without paying a single dollar.
Sounds too good to be true? Here’s a full breakdown of OpinionX’s free and paid plans:
OpinionX Free: The free version allows you to choose how many sets each participant must vote on (it comes with a built-in robustness calculator to help you figure out the right number for this depending on your expected amount of participants). And, as previously mentioned, the free tier allows for unlimited surveys, questions, participants, and teammate seats. The only limitations on Best/Worst Scaling surveys on OpinionX’s free tier are that (a) you can only show 3 options per voting set and (b) the labels are fixed as “Best” and “Worst” (these two limitations are editable on the Ask tier).
OpinionX Ask: The Ask tier unlocks OpinionX’s survey setup customizations. For Best/Worst Ranking specifically, this includes customizing the number of options shown in each voting set, customizing the voting labels to be something other than “Best” and “Worst” (eg. “Most Important” and “Least Important”), removing the “Skip” button, adding conditional branching logic, exporting your results to .csv, viewing participants’ personal rankings, and more. Price: $10/month when paid annually or $40/month for a rolling subscription.
OpinionX Analyze: The Analyze tier unlocks the various analysis tabs on OpinionX and the segmentation filters, allowing you to compare how certain groups of participants voted differently in your Best/Worst survey (eg. compare your paying customers’ preferences versus your free-tier users). Price: $20/month when paid annually or $60/month for a rolling subscription.
The free version is designed to suffice 90% of projects and be fully usable without any subscription. For the 10% of projects that need advanced features (typically teams conducting customer research), OpinionX’s paid subscriptions are cheaper than any other tool on this list.
OpinionX is used by tens of thousands of teams around the world, including researchers at companies like Google, Amazon and Microsoft, as well as national governments and Ivy League academics. OpinionX is the only research tool that offers free Best-Worst Scaling surveys.
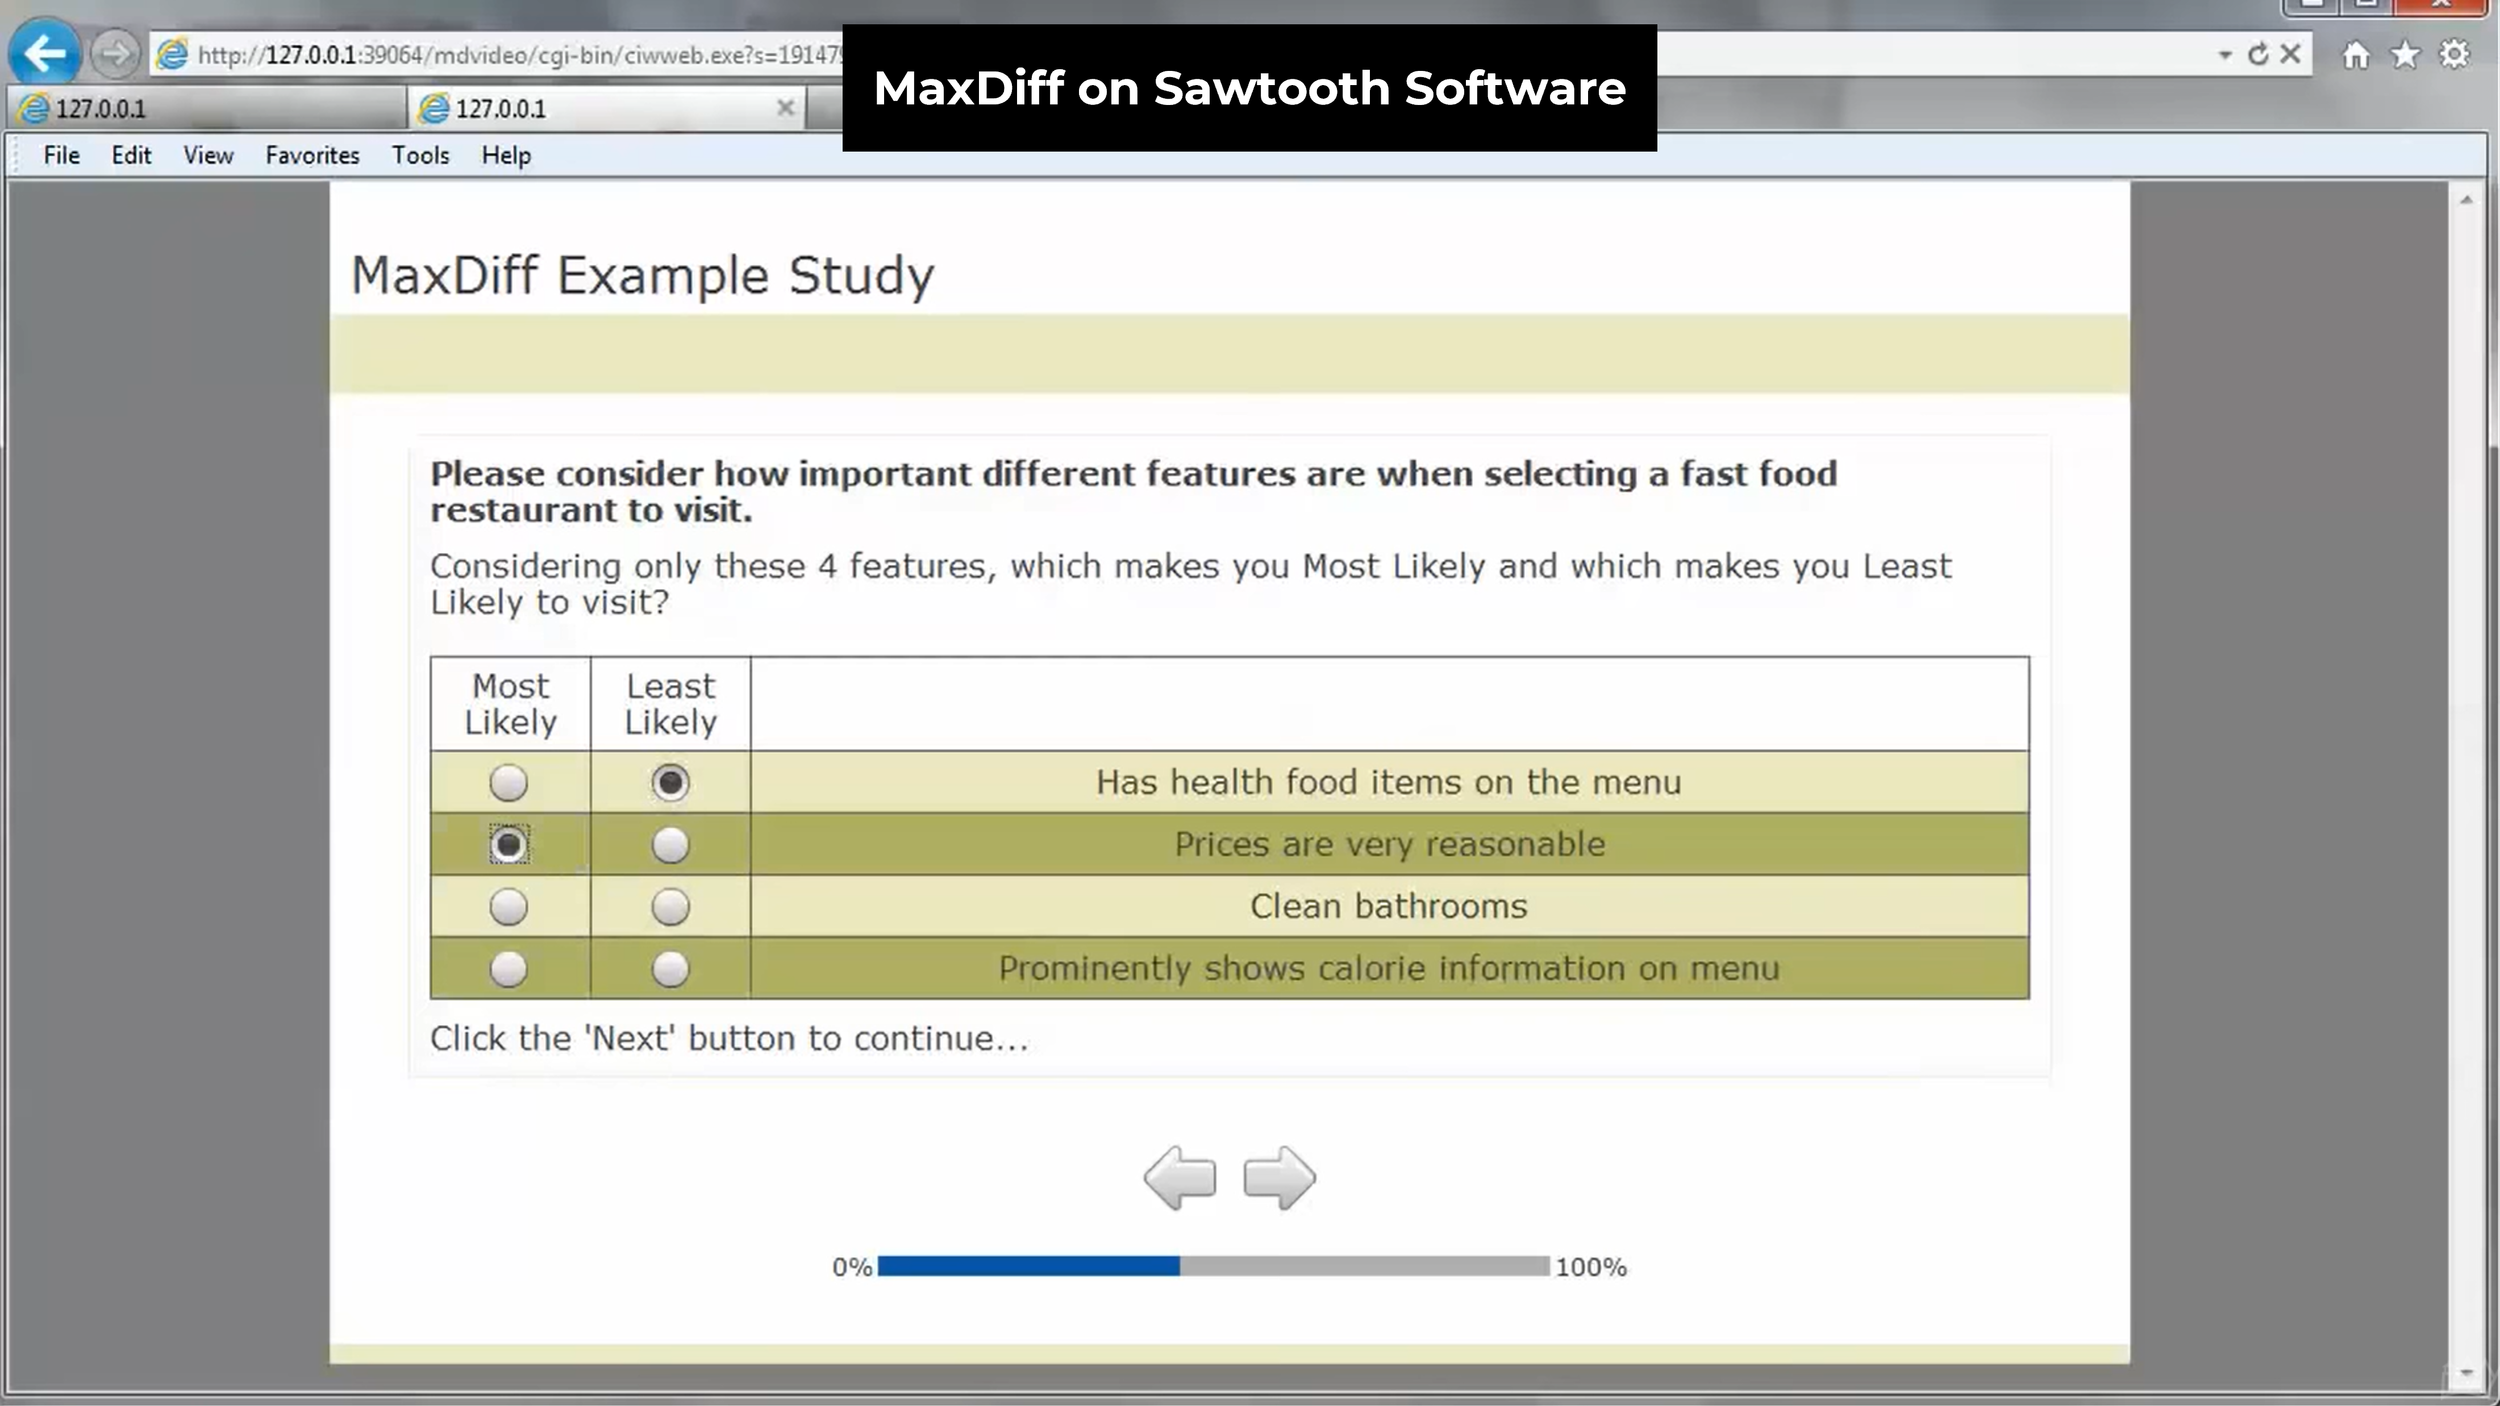
2. Sawtooth Software ❌
Sawtooth Software is a provider of digital market research solutions, with a specific focus on conjoint analysis solutions. Founded in 1983, the company focuses on academics and market research organizations and offers research expertise as an additional available service.
Sawtooth created a proprietary version of Best-Worst Scaling which they call “Bandit MaxDiffs”. This novel approach leverages Thompson Sampling to algorithmically adapt its selection of the most informative choice sets for each subsequent participant comparison.
Sawtooth Software starts at $4,500/year for their “Basic” package and $15,000/year for the full package. There is no free or demo version of their Best-Worst Scaling surveys. You can request a demo of their Lighthouse Studio product (a Windows-only desktop application) from their sales team if you want to learn more.
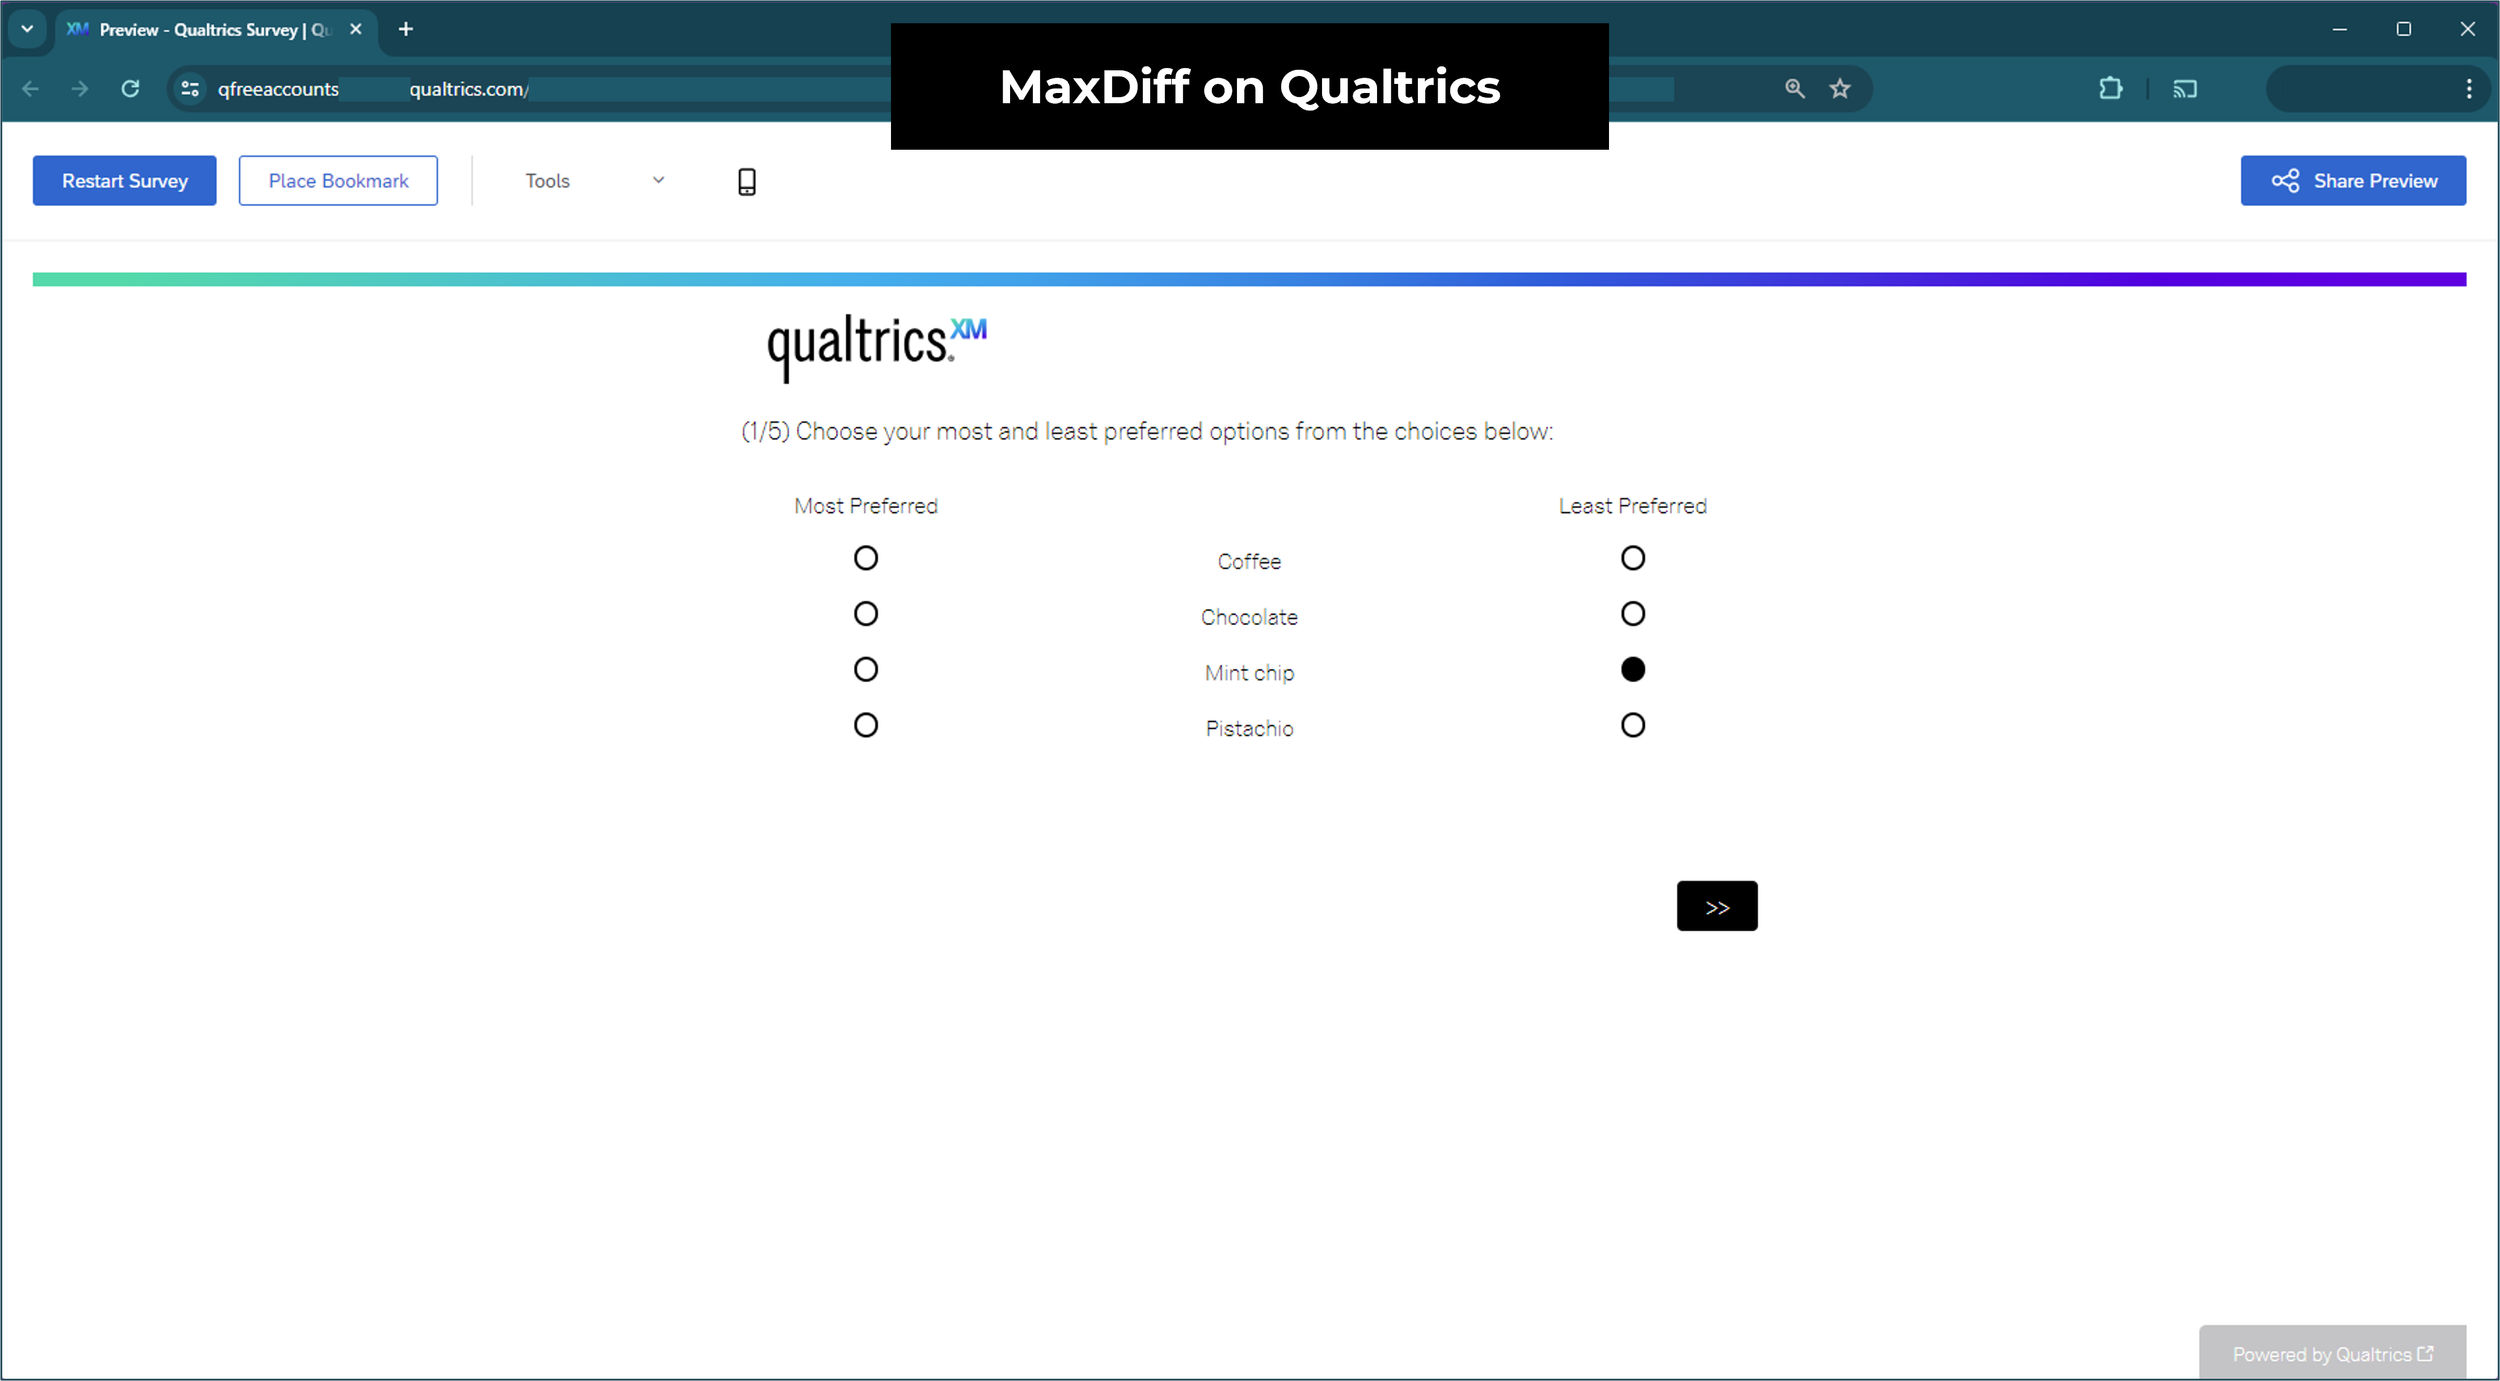
3. Qualtrics ❌
Qualtrics has a Best-Worst Scaling question format but it is not available for use without an existing PX or EX premium subscription or if you have a CX license that includes the journey optimizer. Even with that, you’ll still need to make an additional purchase via your Account Executive to unlock Best-Worst Scaling on Qualtrics.
Considering a base-level CX license costs $5,000/year for one CoreXM user, plus $1 per respondent, and Conjoint starts at an additional $8,000/year add-on, it would appear that Best-Worst Scaling on Qualtrics would be a $10,000 entry price plus respondent fees for a new customer.
I managed to get access to a test version of Best-Worst Scaling on Qualtrics, which shows a dummy survey that is already filled in with sample data (screenshot above). The dummy survey seems to show that the Best/Worst voting sets are fixed and consistent for every participant, which is weird and not so useful for almost any Best-Worst Scaling research project.
4. SurveyMonkey ❌
SurveyMonkey added a Best-Worst Scaling question type in October 2023. Their pricing page shows that it is available on all paid plans, but via a friend’s premium account I was shown that it is only available if I upgrade to Team Premier (the most expensive plan) starting from $2700/year ($75/month x 3-seats minimum x 12-month upfront only). Hard to know which is true, as the information about this feature from SurveyMonkey is contradictory and inconsistent.
Unfortunately, after searching high and low (pun intended) for literally a single example of someone even mentioning it online, I could not find a single screenshot of what their “Best-Worst Scale” actually looks like. Based on an obscure Reddit comment I found, it seems like maybe one person used it in December 2023, but that survey has since been closed so I couldn’t take a look for myself.

Honestly it seems suspicious that not a single person has mentioned this on the internet other than the press release announcing its launch — based on SurveyMonkey’s usage stats 4.2 billion questions have been answered since then and somehow nobody has screenshot or posted anything about this??? SurveyMonkey doesn’t even have any screenshots on their own help center article about this question type, they decided to use text tables instead (screenshot above).
So very weird… My guess, based on the original press release, is that this is a feature of their Market Research Enterprise Solutions range, which would definitely cost a lot more than the stated $2700/year price tag. Hopefully someone can confirm to me whether this actually exists on the self-service product and isn’t just some sort of fake-door test from the PM team there?
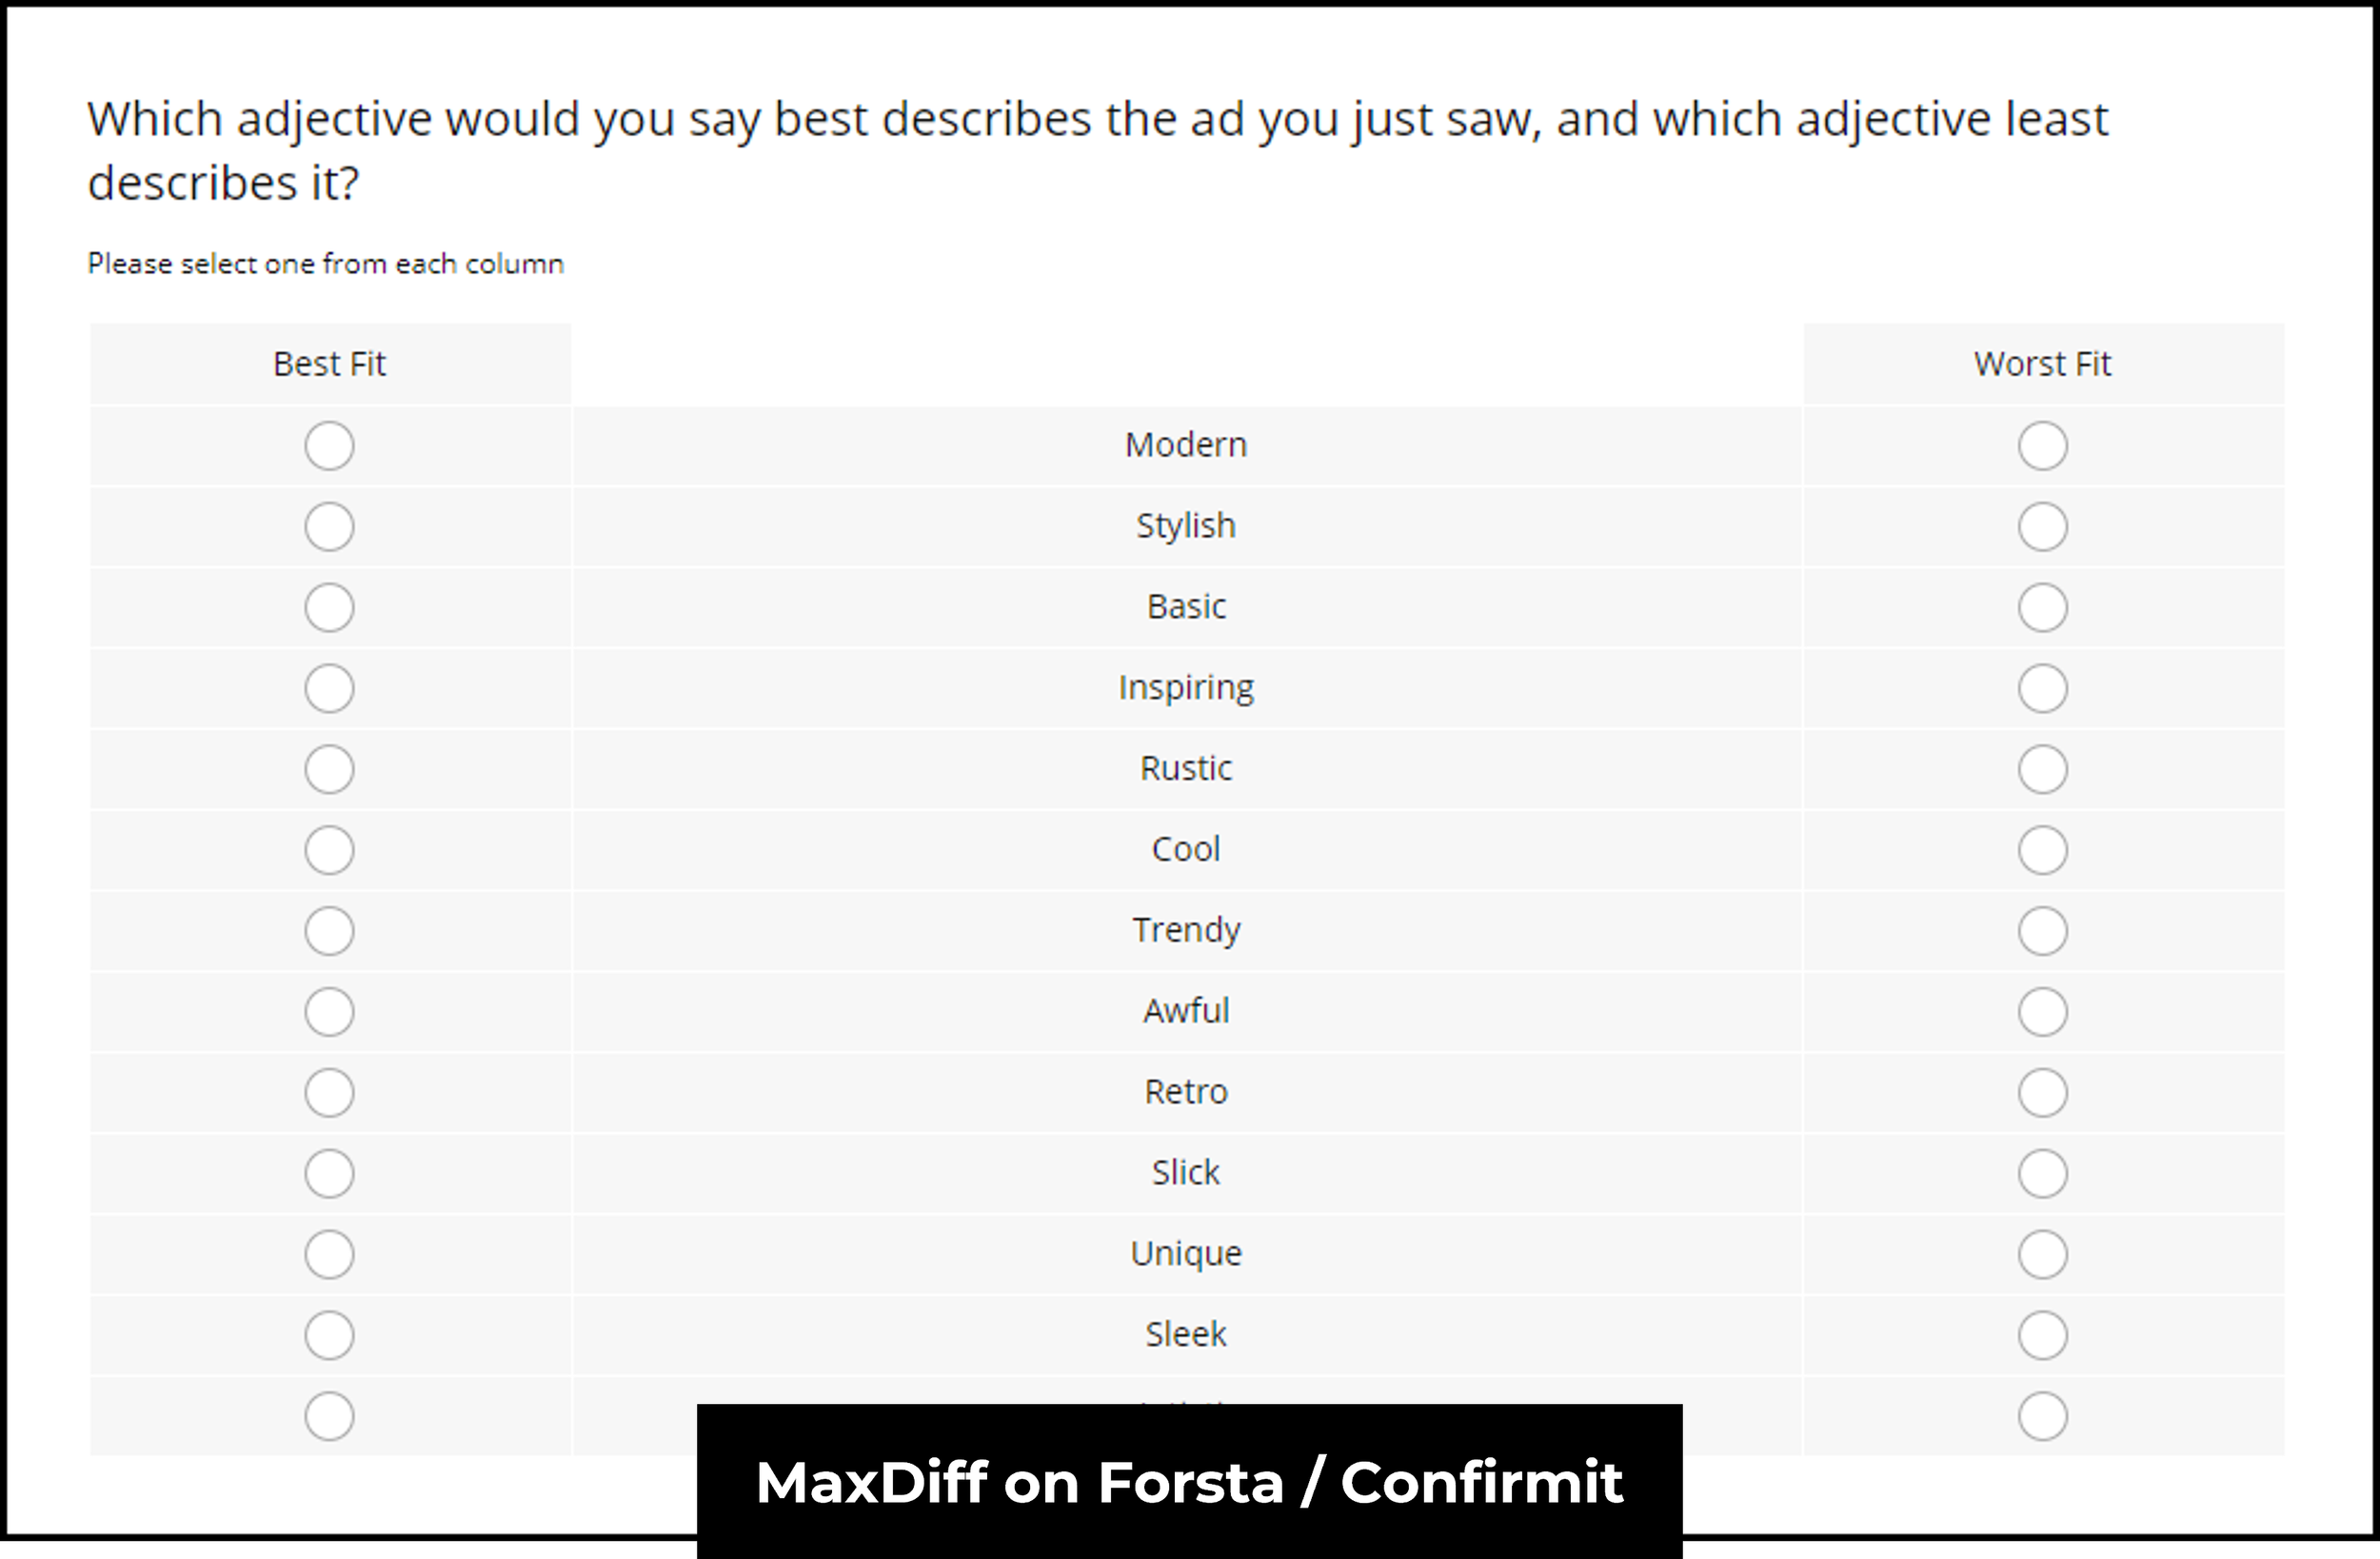
5. Forsta ❌
Forsta (the brand that emerged from the mega-merger between Confirmit, FocusVision Decipher, and Dapresy) offers a Best-Worst Scaling survey format as part of their “dynamic questions” range. I turned over every rock on the internet to find (1) a live demo or (b) a rough price range for Forsta but I couldn’t find anything in the end. Seems like you’ll have to go through a full sales qualification conversation if you want to find this out for yourselves (🚩), good luck to the brave souls willing to go through that 🫡
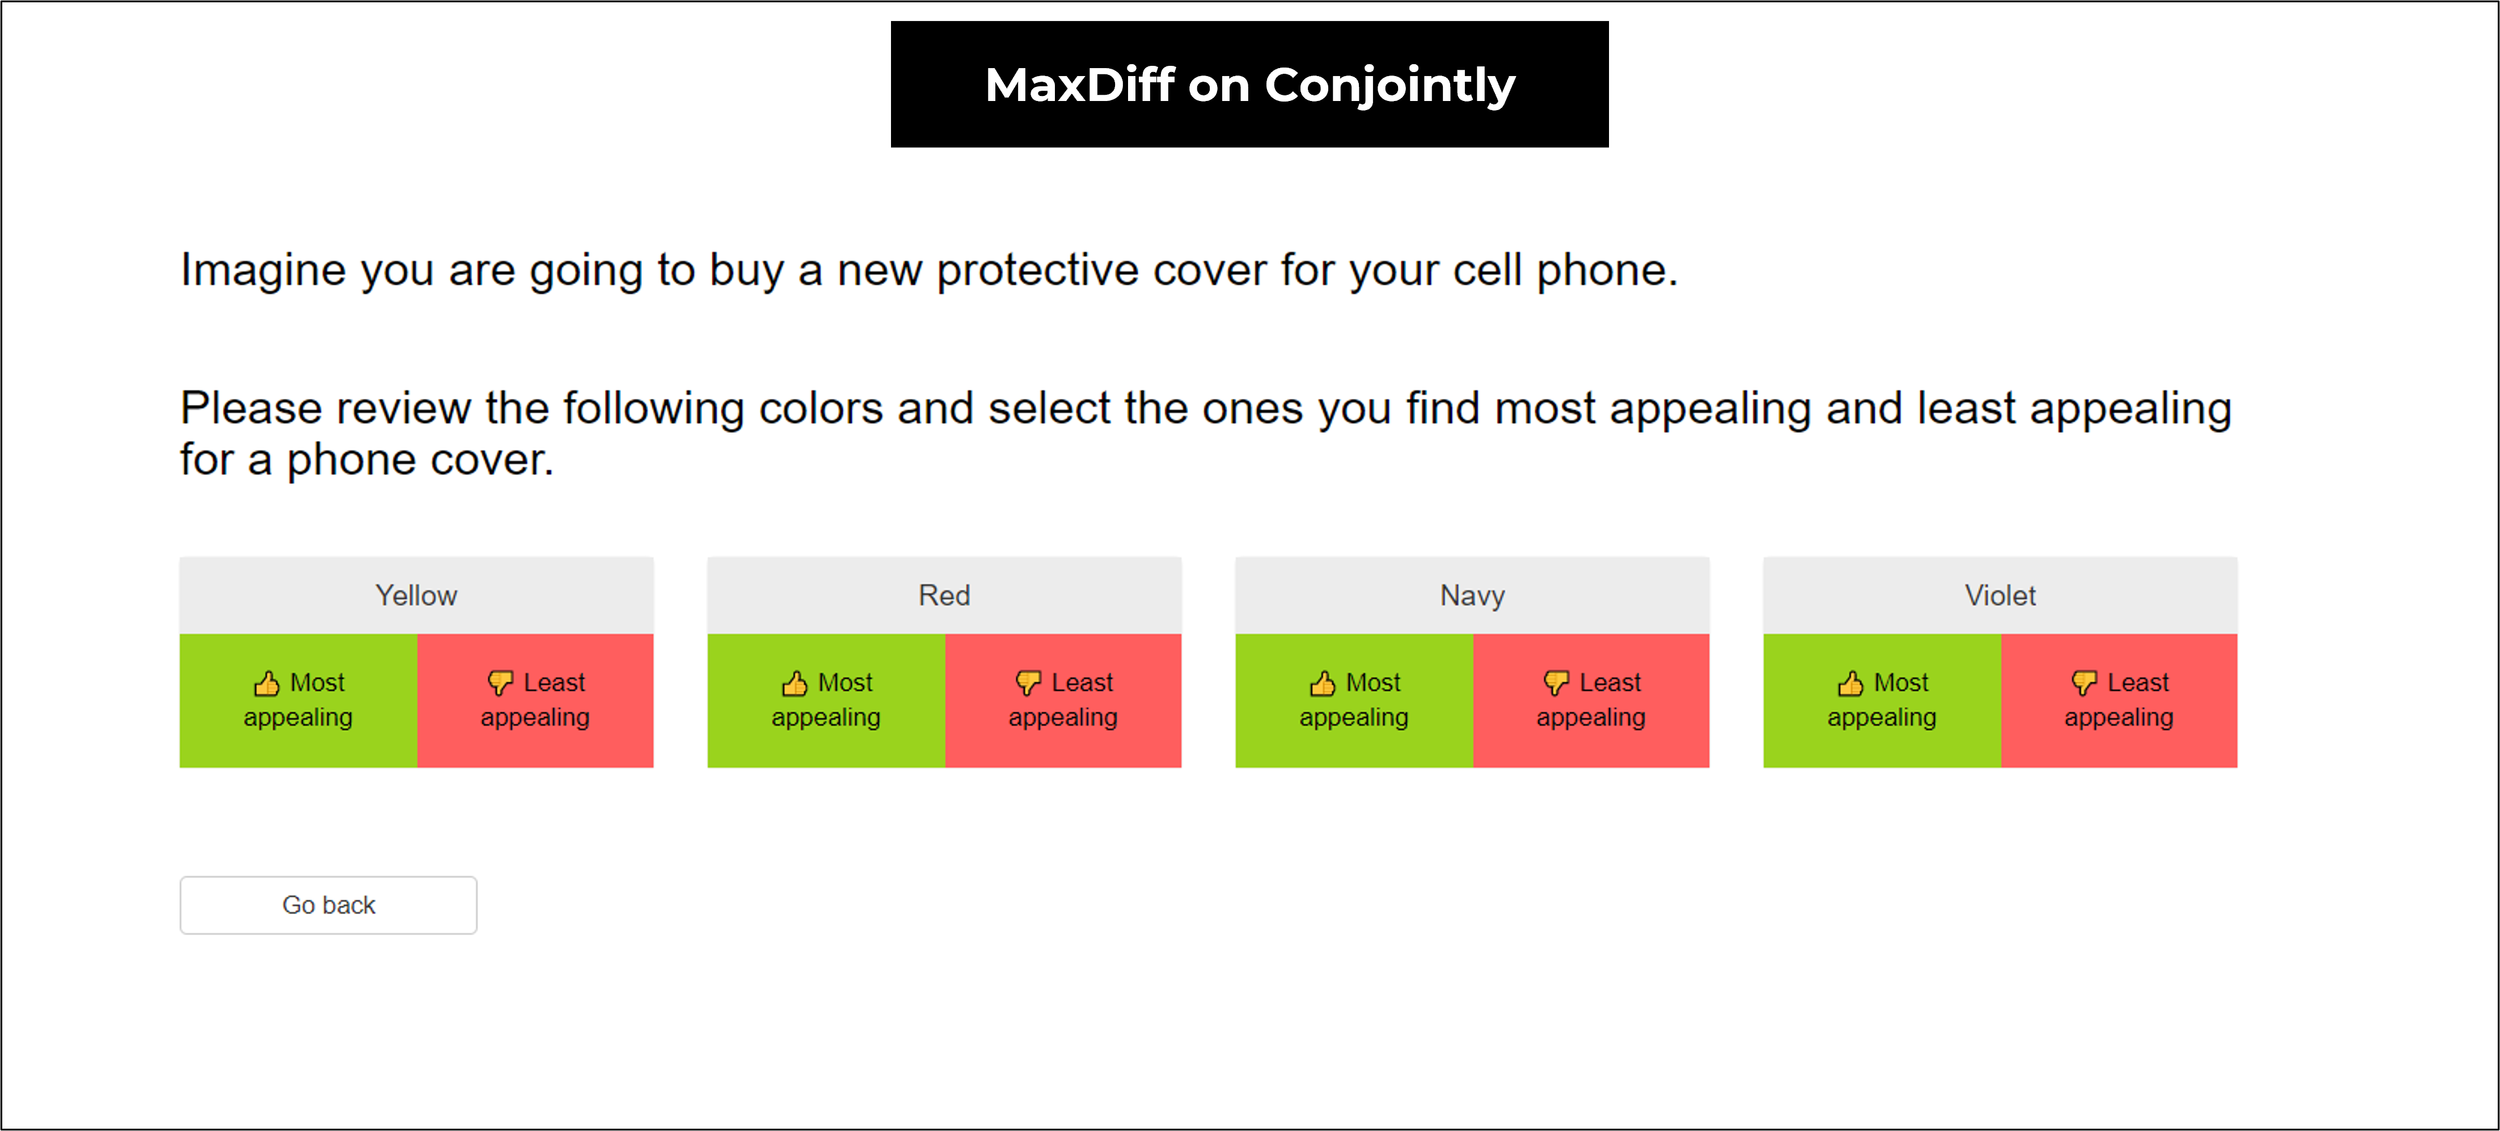
6. Conjointly ❌
Conjointly is an advanced market research platform that specializes in (yep, you guessed it) conjoint analysis software. A standard subscription for Conjointly includes a Best-Worst Scaling survey format for a base rate of $1795/user/year, however it does have quite an unorthodox user interface for voting as you can see in the screenshot above. It is worth noting that Conjointly is an advanced tool and you will likely need additional support services if you haven’t used something like it in the past.
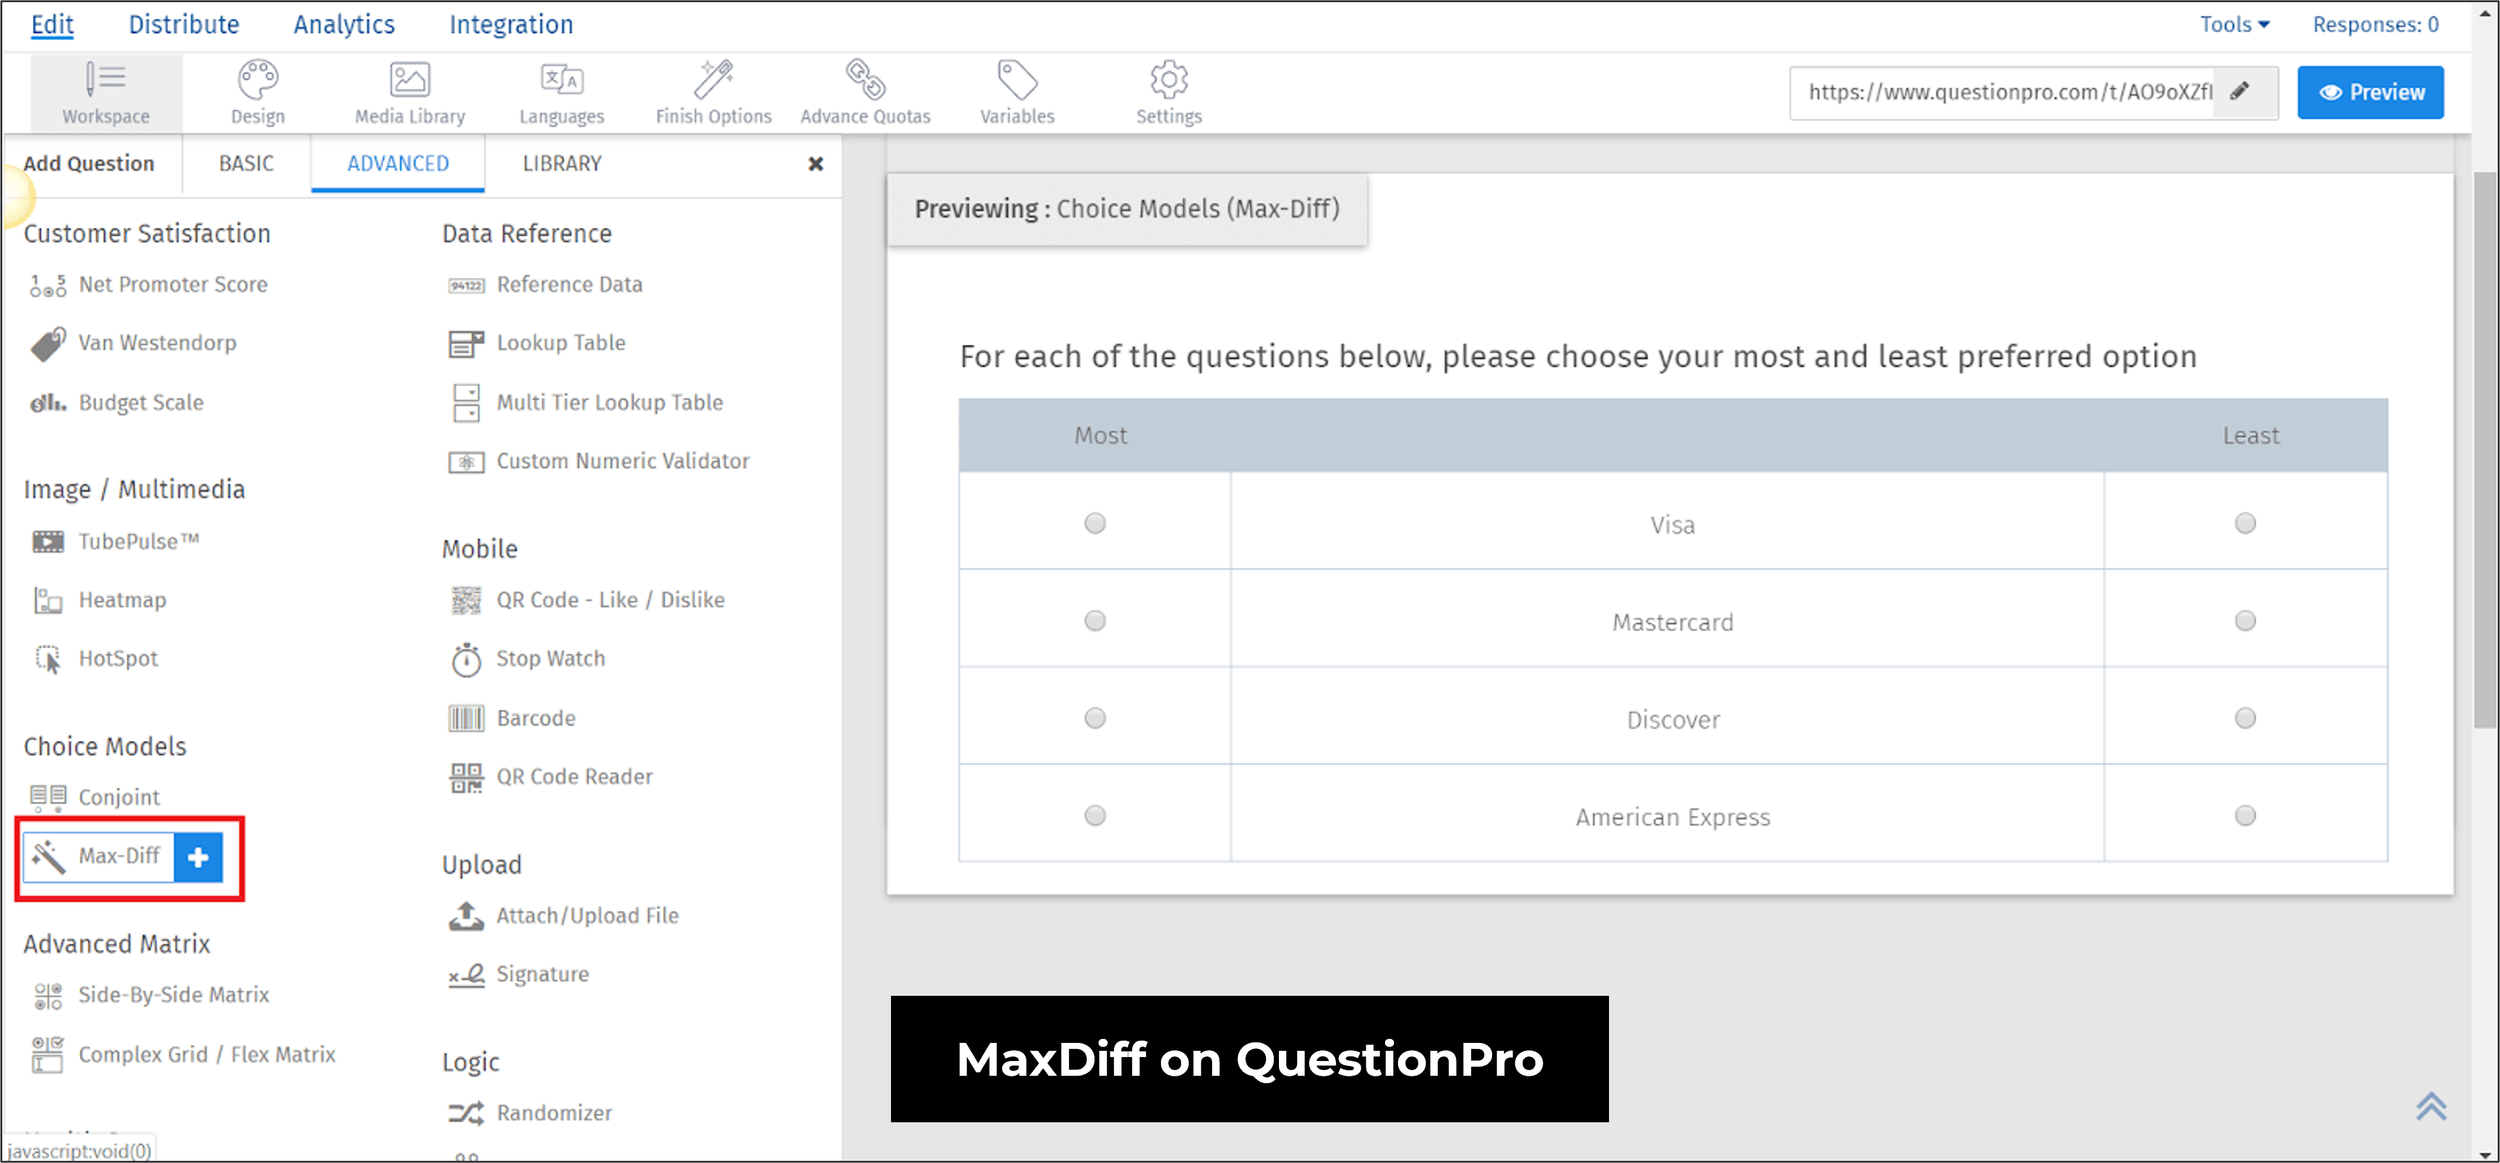
7. QuestionPro ❌
QuestionPro is another of the big survey platforms. It doesn’t meaningfully differ much from products like SurveyMonkey in functionality or price, it’s just another alternative really. QuestionPro offers Best-Worst Scaling and Conjoint Analysis questions only in their most expensive tier, which is called “Research Suite” and is available by custom quote only. However, their “Workplace” product starts at $5,000/year, so it is fair to assume that the Research Suite is minimum $10,000/year or more.
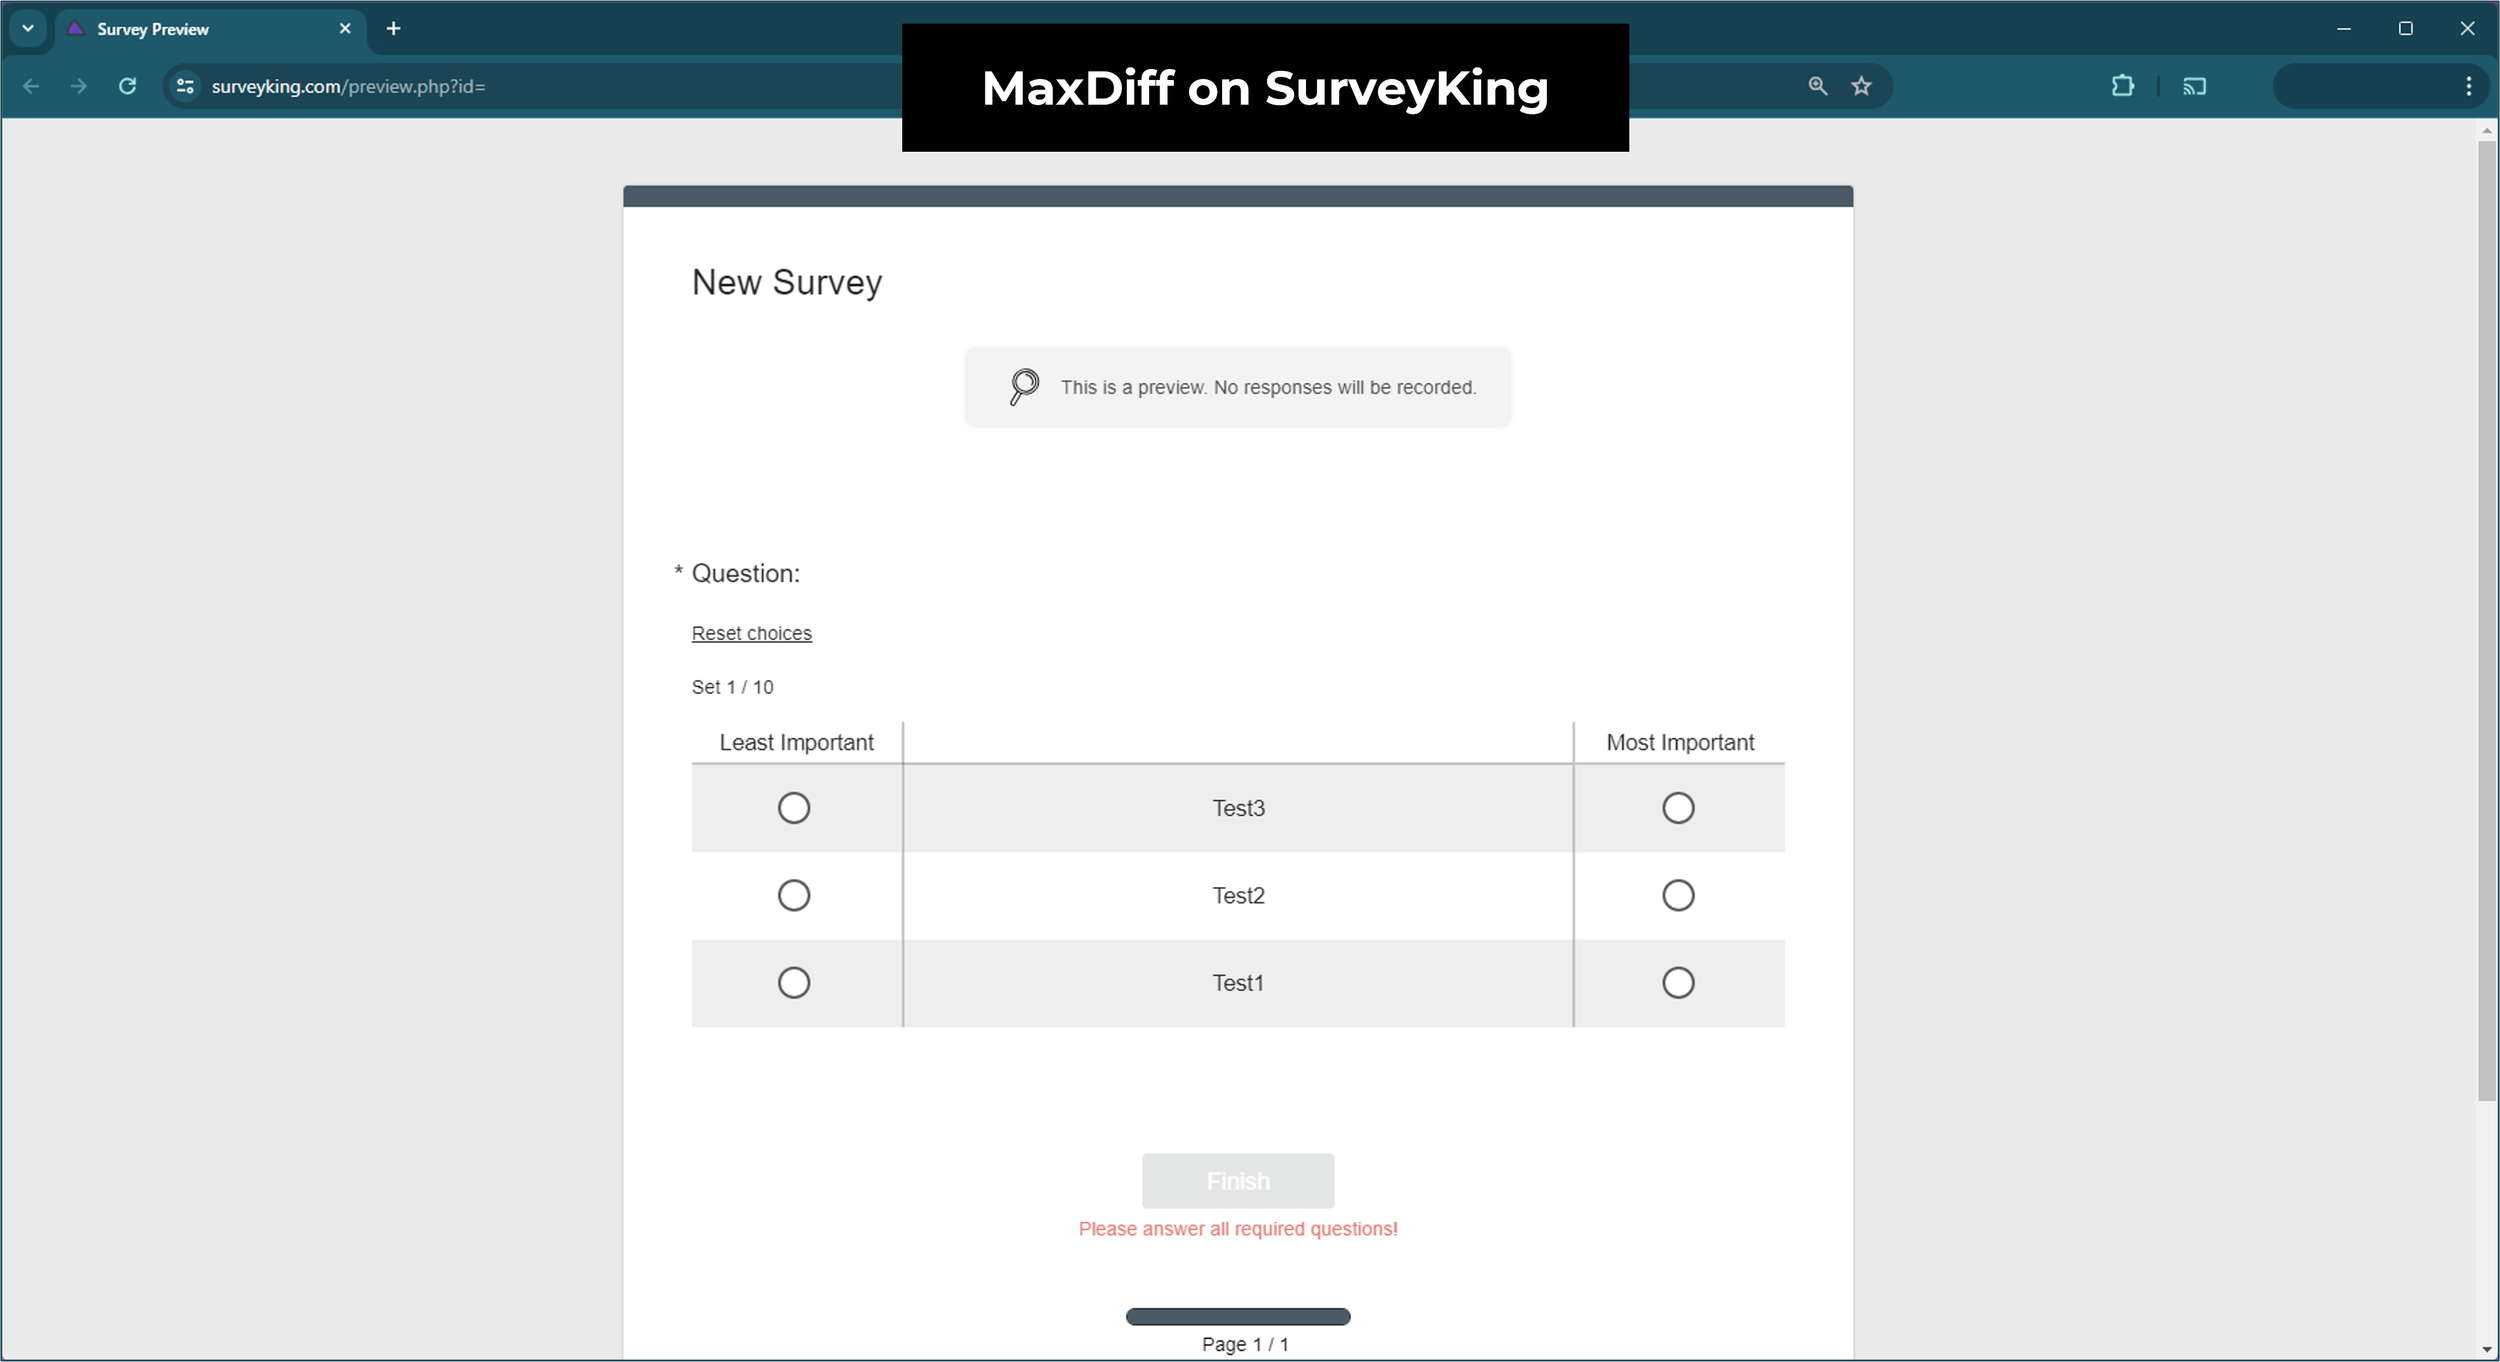
8. SurveyKing 🟠
SurveyKing offers a survey platform with a wide range of question types for a low price. Free users can create a test Best-Worst Scaling survey, however you can only add three ranking options, so really it’s just a preview of the survey design and can’t be used to actually rank anything. Strangely, there’s nothing preventing the same set of options from appearing many times for the same participant on SurveyKing, which is a red flag for survey usability and data integrity. To unlock Best-Worst Scaling for actual survey use, you’ll have to upgrade to the premium version for $19/user/month (which does come with a limited number of responses per month).
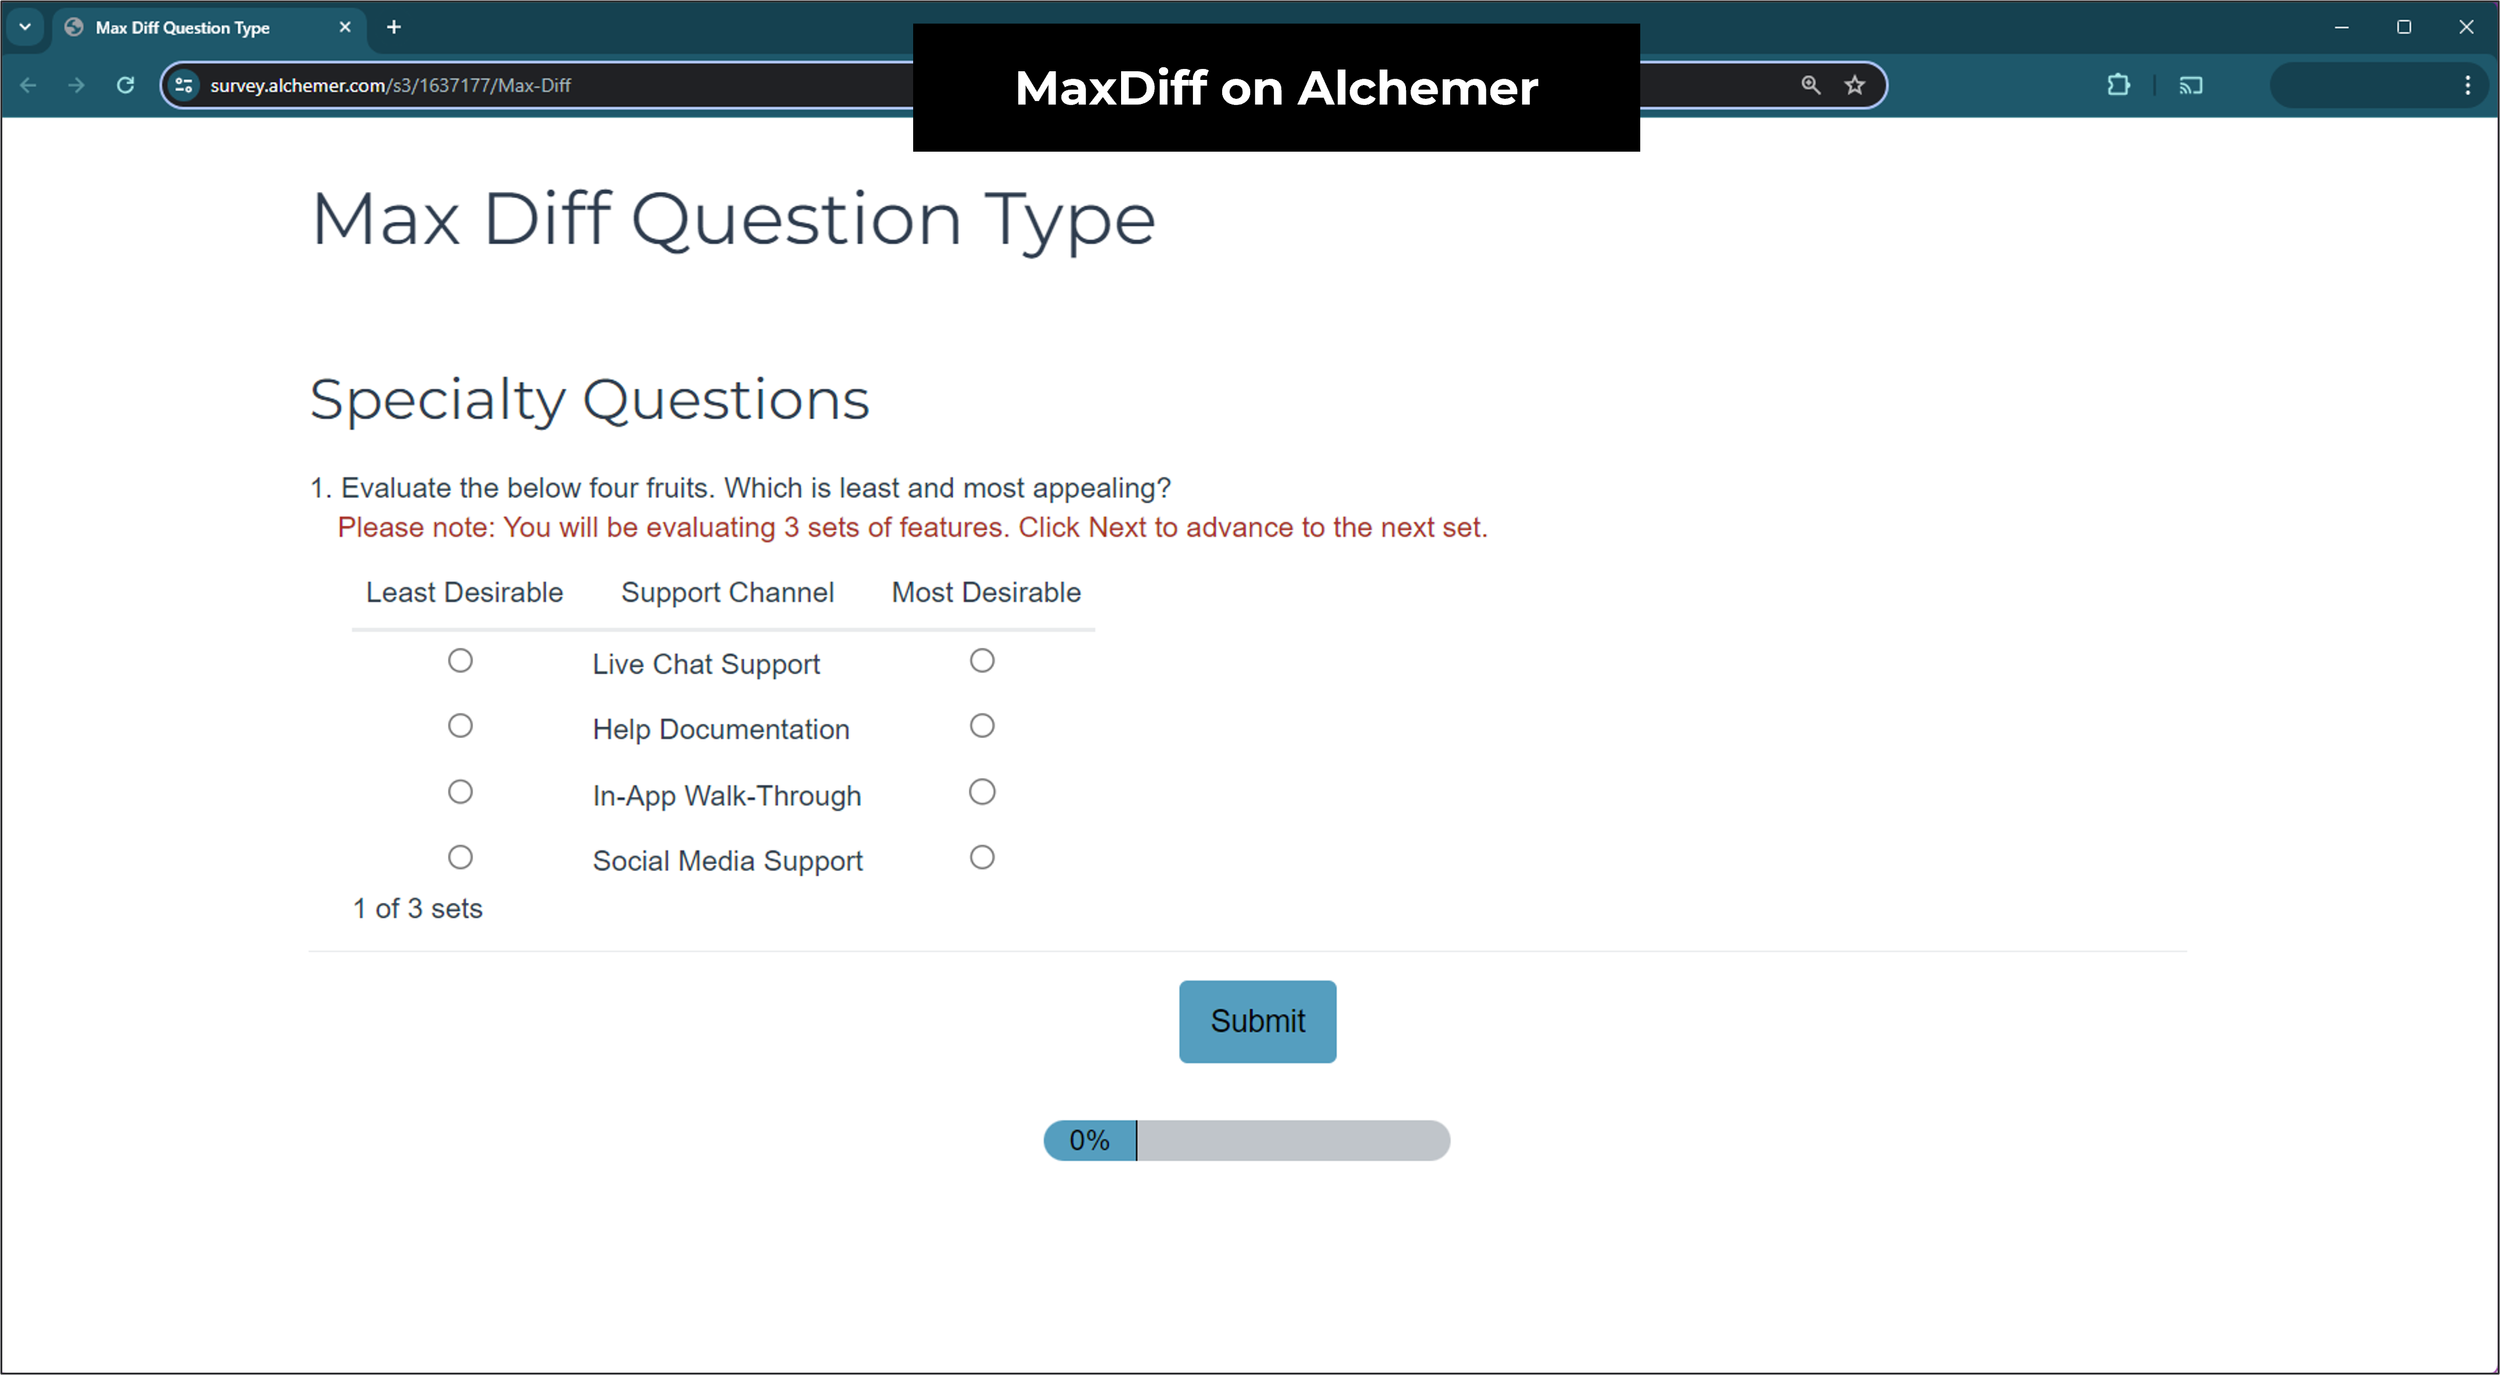
9. Alchemer ❌
Alchemer (formerly SurveyGizmo) is a survey platform that, in the company’s own words, “provides tools that rival Qualtrics at a price point closer to SurveyMonkey”. Alchemer offers a Best-Worst Scaling question type but it is only available on their “Full Access” plan (their most expensive tier) starting at $1895/user/year. There is no free trial available and “Full Access” is only for up to a maximum of 3 users — beyond that you’ll have to negotiate a custom enterprise contract.
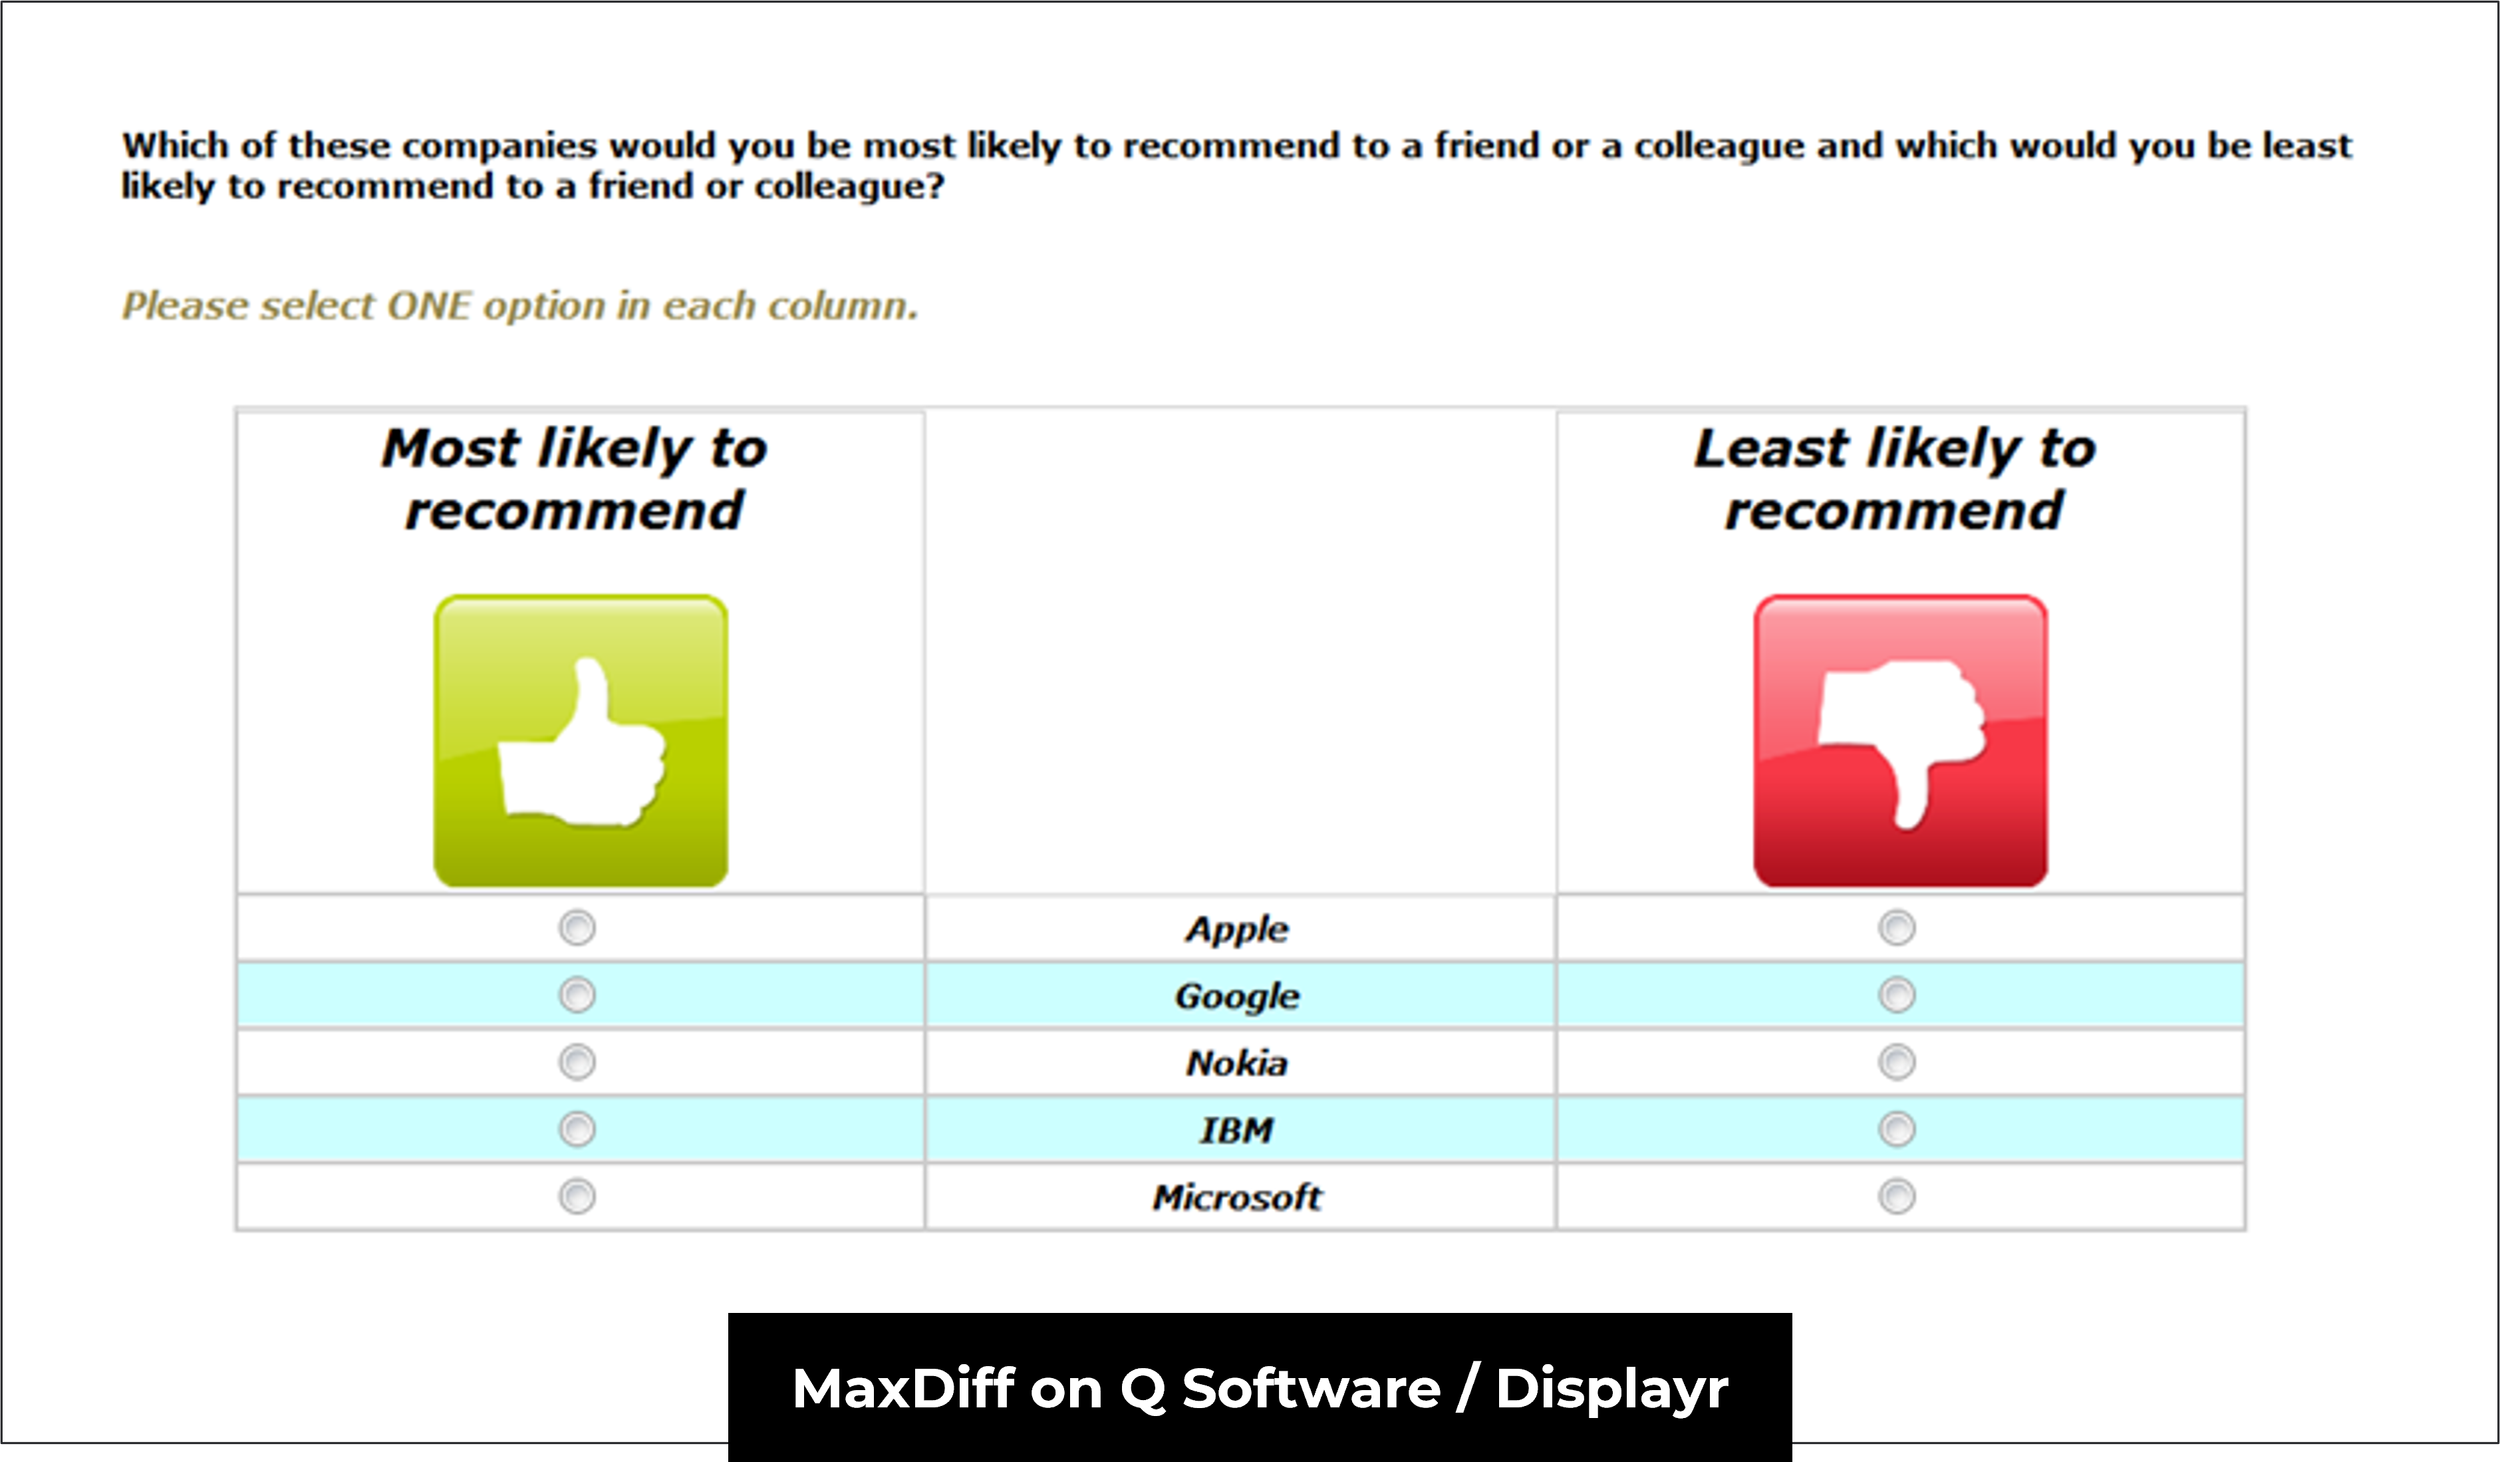
10. Q Research Software / Displayr ❌
Q Research Software is a data analysis and reporting tool designed specifically for traditional market researchers. The tool is part of Displayr’s portfolio of data products. Q Research offers specialized functionality for this customer segment such as automated data cleaning, formatting, and statistical testing. Unfortunately they don’t have a free tier or even a publicly-available demo of their Best-Worst Scaling tool — you must purchase either their Standard License ($2235/year) or Transferable License ($6705/year) before getting your hands on it.
— — —
4 Alternatives to Best-Worst Scaling for Ranking & Prioritization Surveys
There are four alternative survey methods that you can use instead of Best-Worst Scaling:
Pairwise Comparison
Ranked Choice Voting
Points Allocation (Constant Sum)
Conjoint Analysis
Alternative 1: Pairwise Comparison
Pairwise Comparison ranks a list of options by comparing them in head-to-head pair votes. By analyzing the number of pairs that a ranking option “wins”, you can measure people’s preferences from best to worst option. Pairwise Comparison works almost identically to Best-Worst Scaling but just with two options — every pair results in a “best” (the chosen option) and “worst” (the unselected loser) result. You can create a free Pairwise Comparison on OpinionX with unlimited ranking options and it can also be used to rank images.

^ Pairwise Comparison voting and results on an OpinionX survey
Alternative 2: Ranked Choice Voting
Ranked Choice Voting gives each respondent the full ranking list and asks them to place the options in order according to their personal preferences. It’s the most simple format of the four alternatives explained in this post, but it has some shortcomings worth noting. It is recommended that you limit the number of statements in a Rank Order question to 6-10 max. Beyond that number, you should move your question to Best-Worst Scaling or Pairwise Comparison, which are both better formats for ranking long lists.
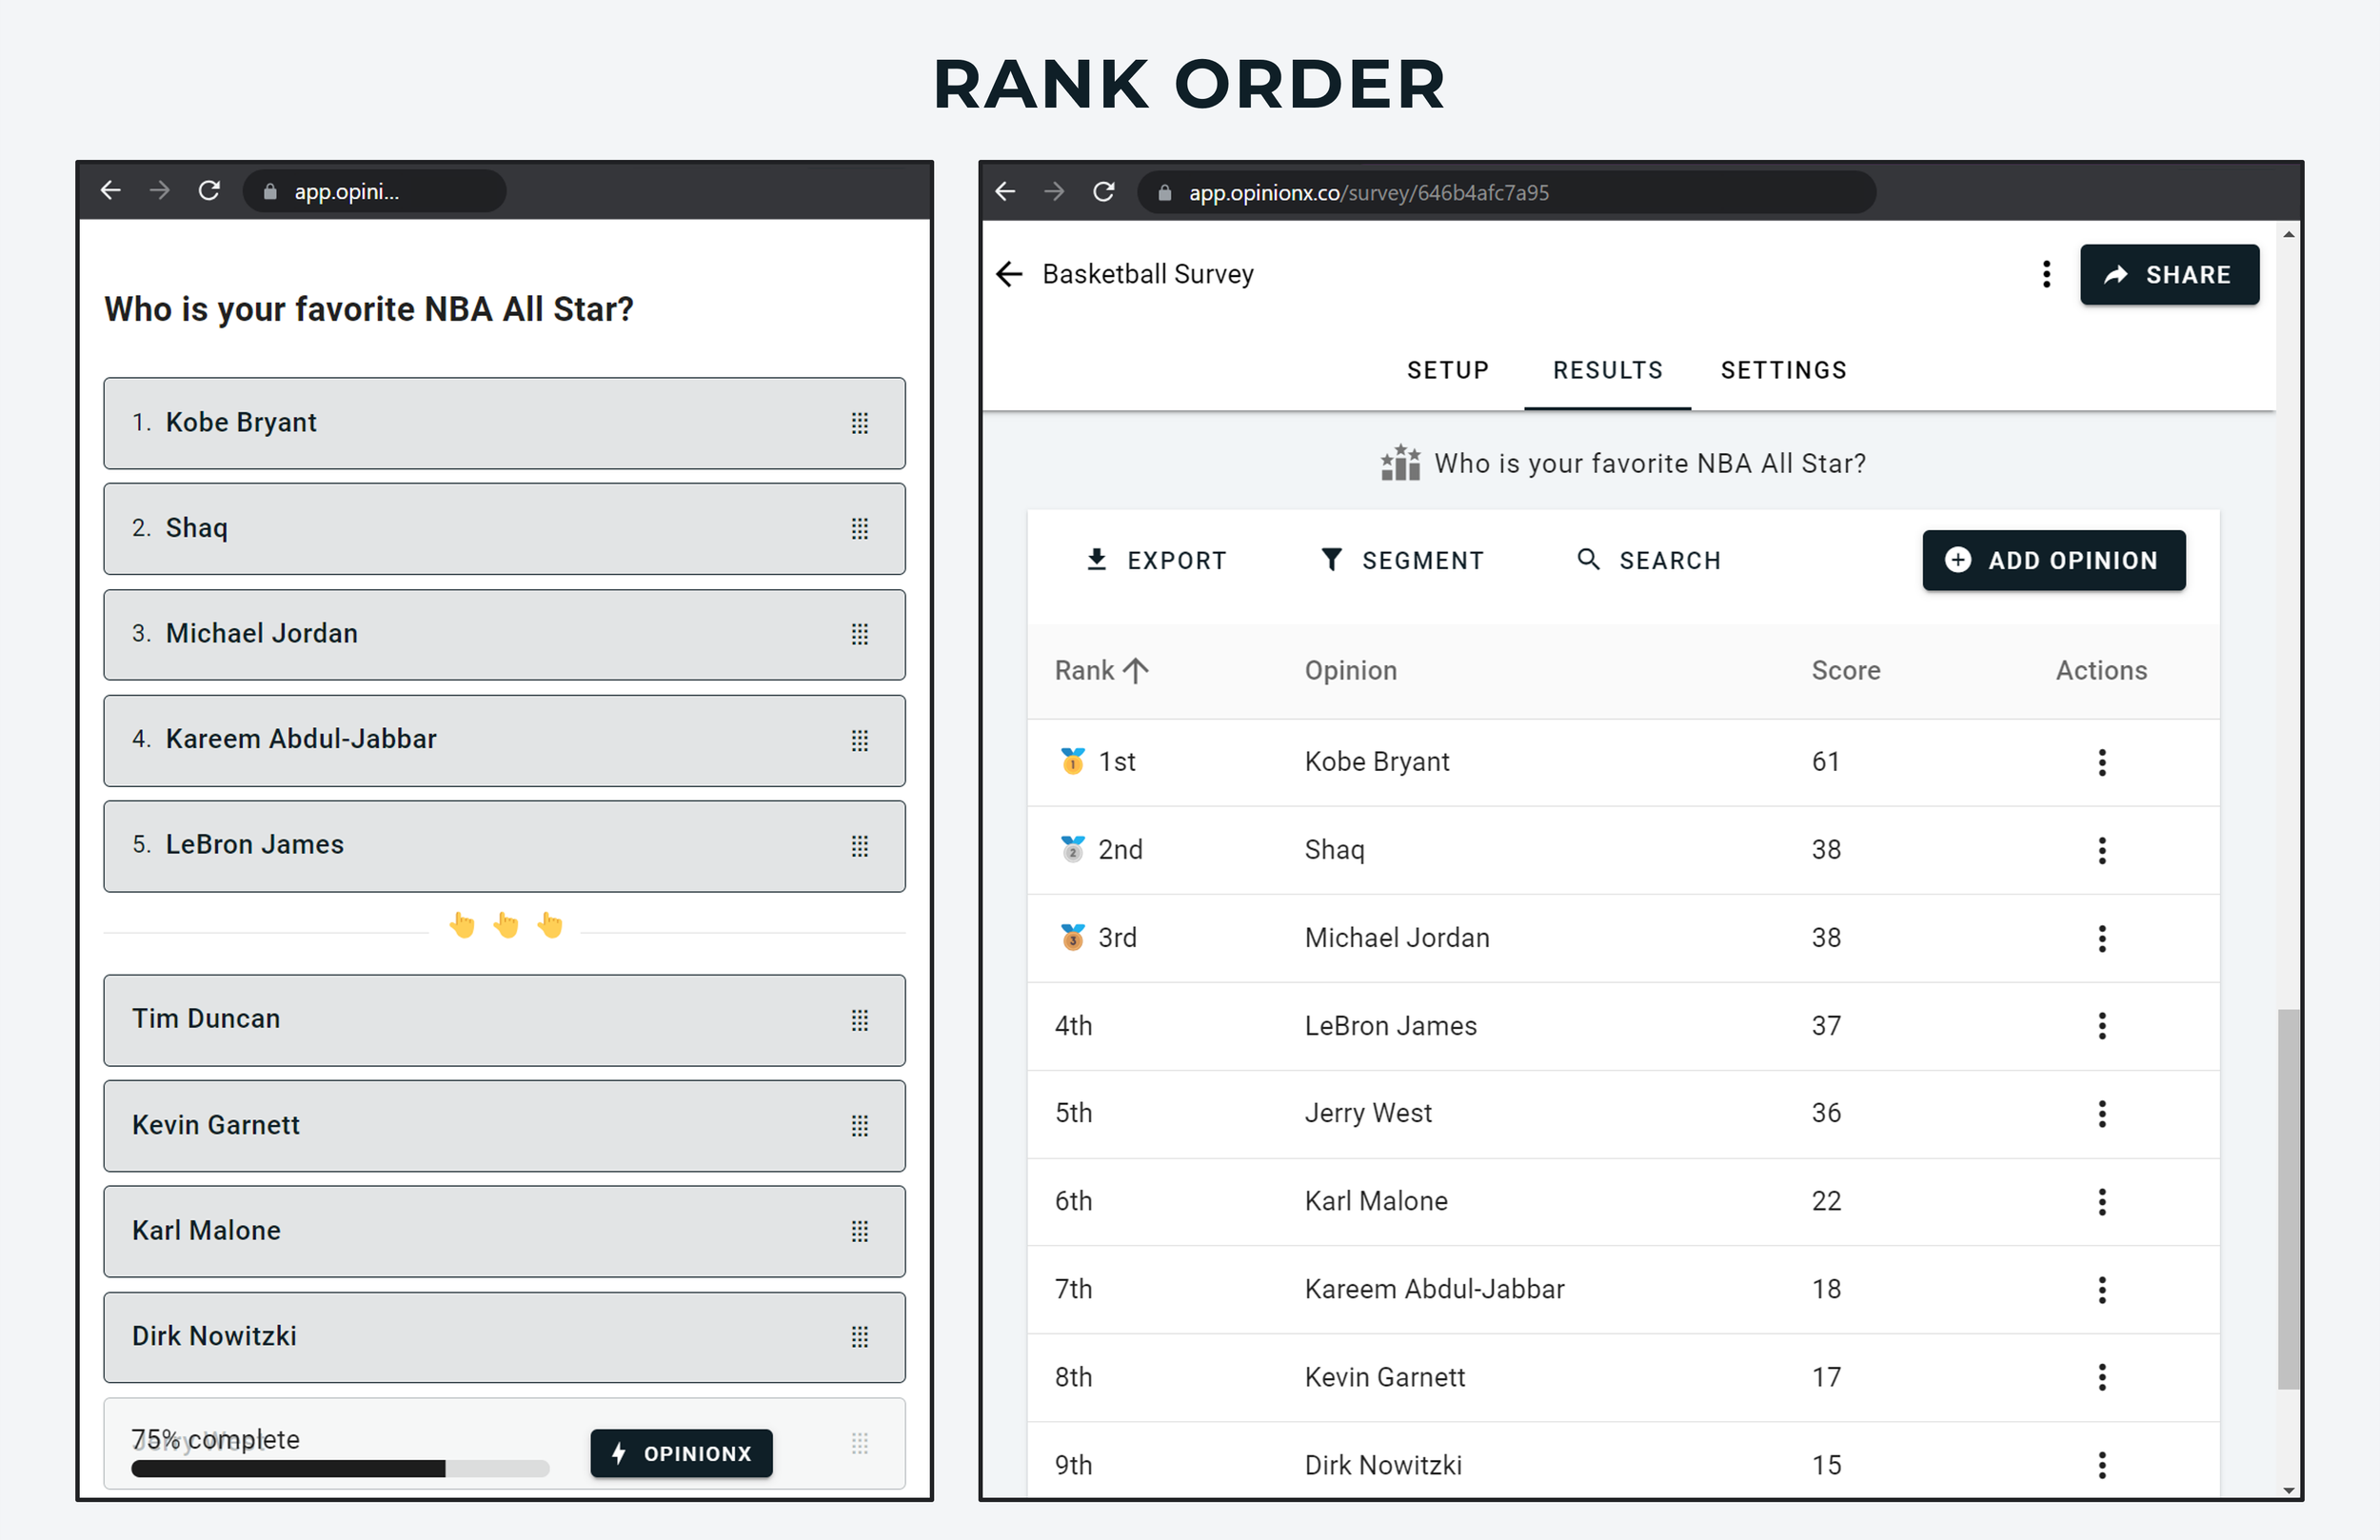
^ “Order Rank” voting format and results on OpinionX
Alternative 3: Points Allocation / Constant Sum
One disadvantage of both Best-Worst Scaling and Pairwise Comparison is that they estimate the preferences of items relative to each other but don’t tell us if our list of ranking options is a good or bad batch from an absolute perspective. That’s where Points Allocation comes in — it gives each participant a pool of credits they can allocate amongst options in whatever way best represents their personal preferences. It doesn’t just show the relative preference, it shows the magnitude of their preference. For example, Points Allocation helps us learn more than the fact that Simon prefers apples to bananas — we see that he would give 9 of his 10 points to apples (he really prefers apples).
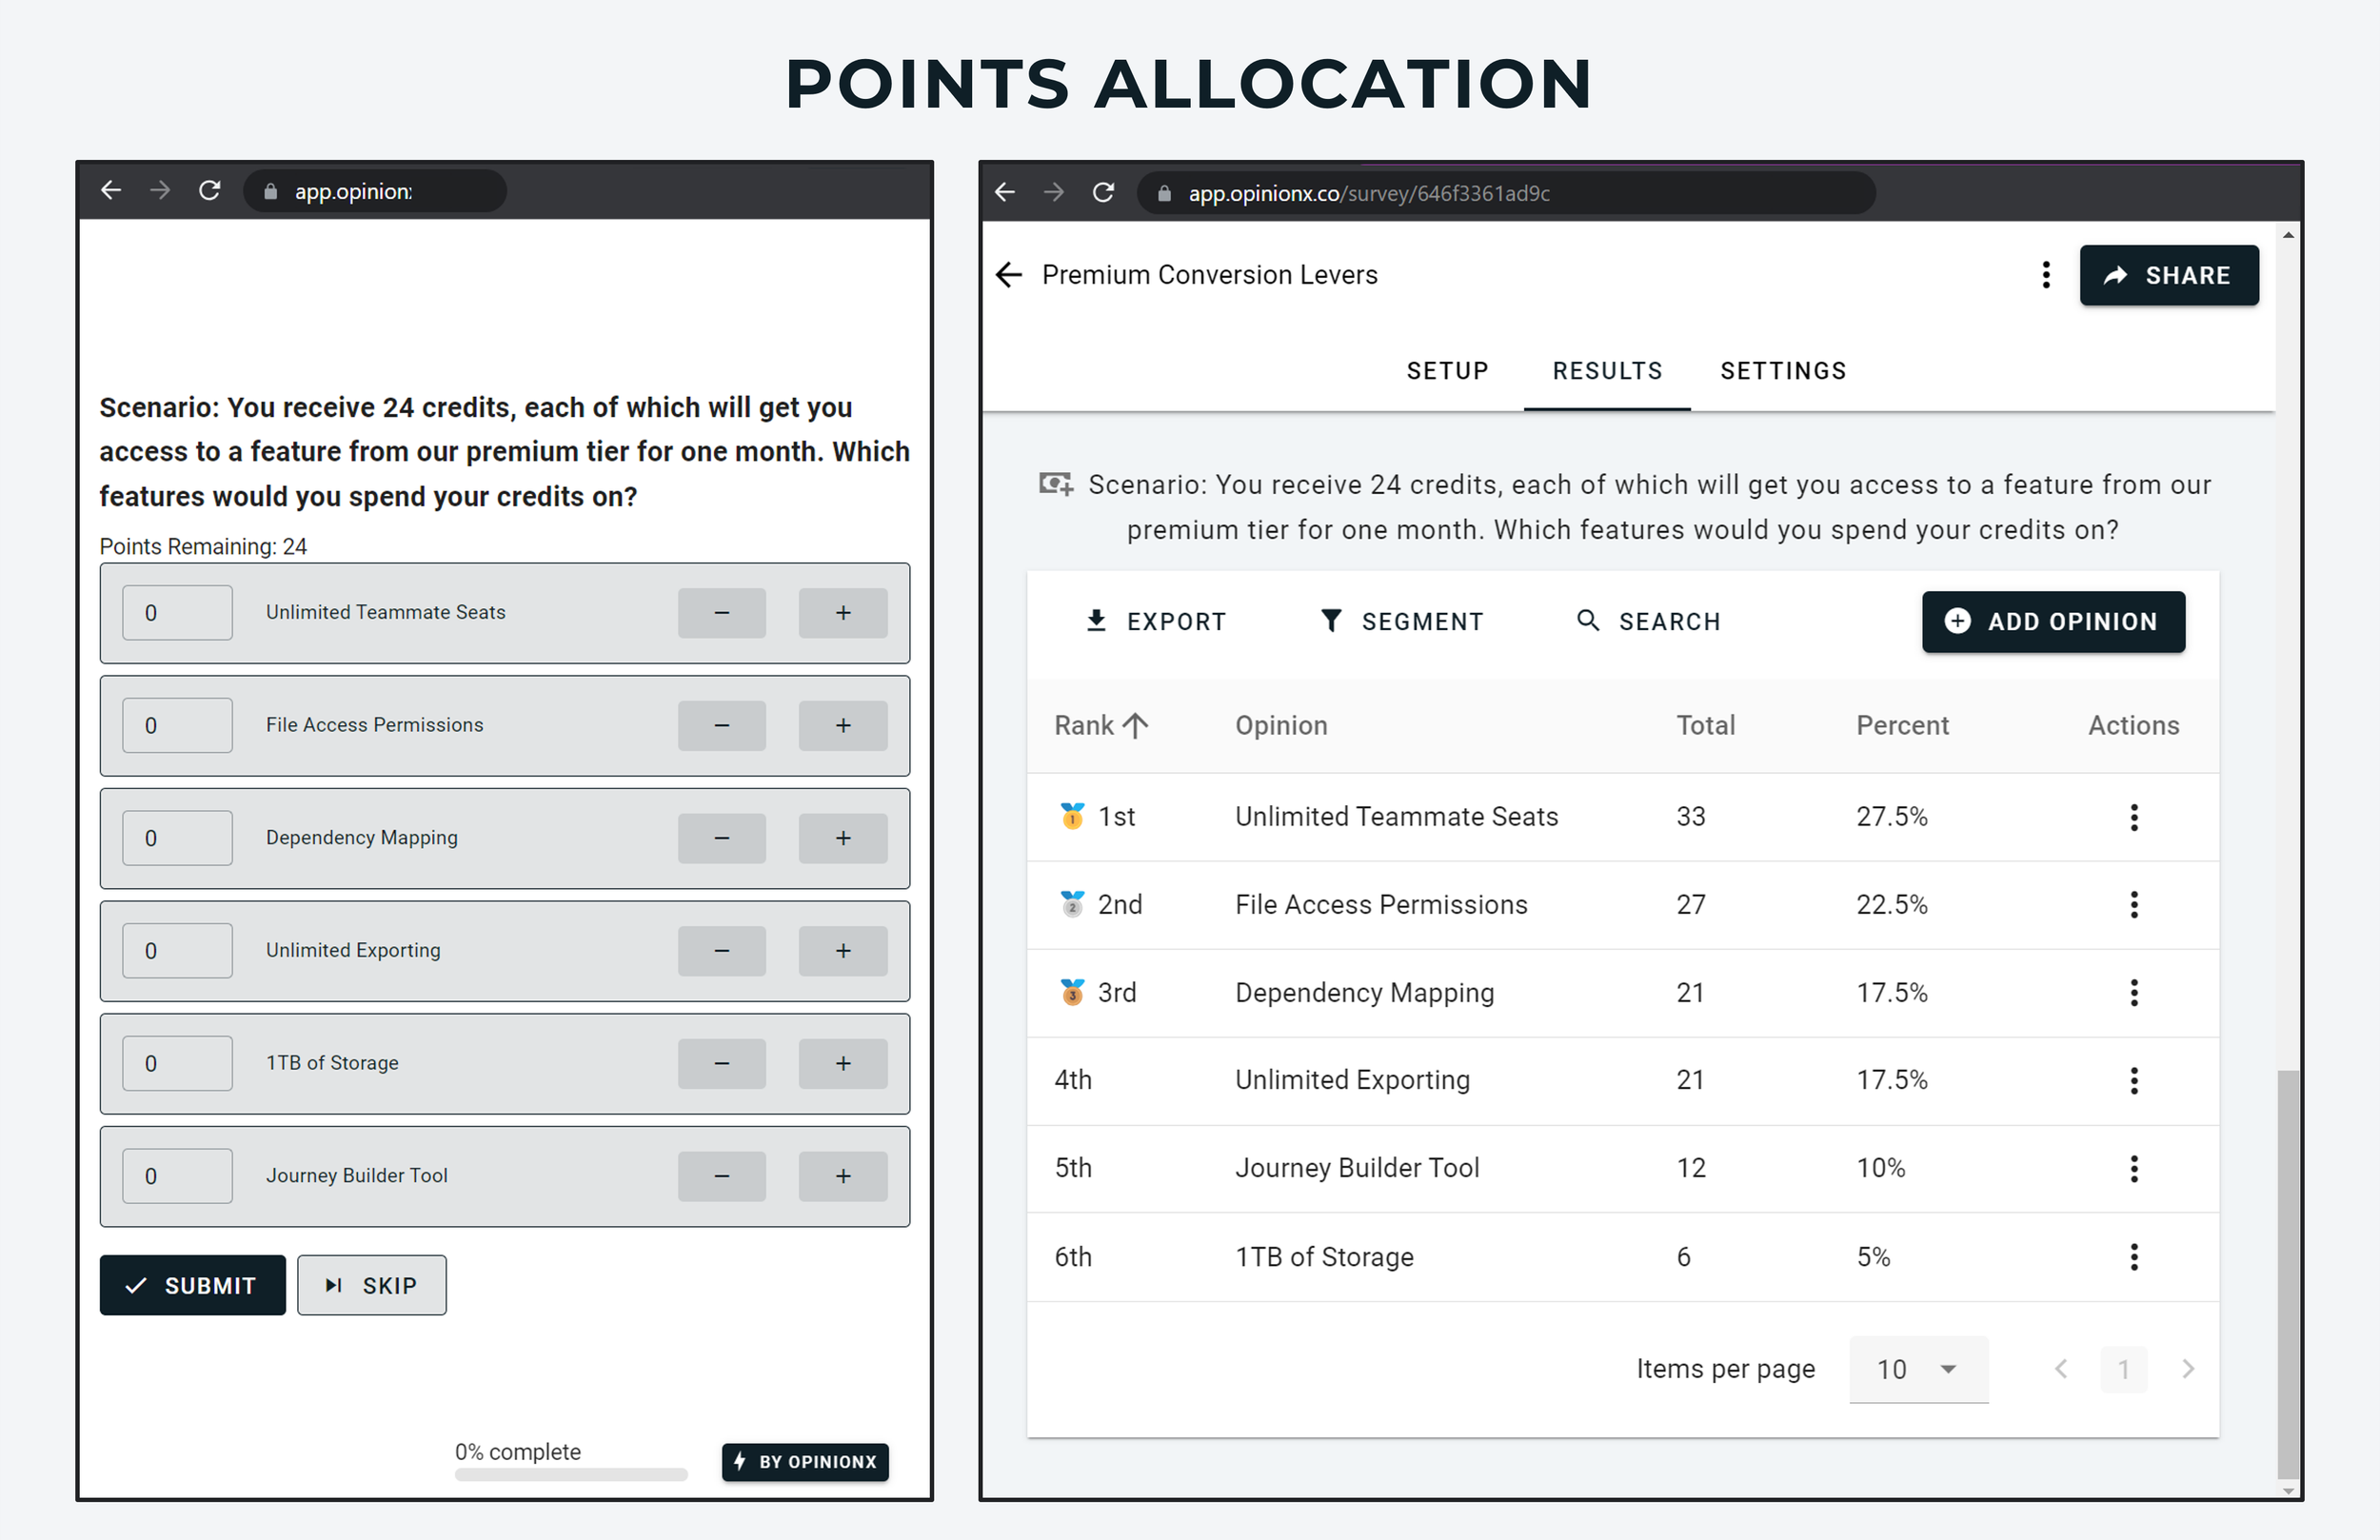
^ Points Allocation voting and results on an OpinionX survey
Alternative 4: Conjoint Analysis
Conjoint Analysis is a multi-factor ranking method that asks participants to vote on profiles that each contain multiple variables. It’s used to figure out how important different aspects/features of a product are in the overall offering for a buyer. For example, Conjoint Analysis will help us rank the importance of a phone’s battery life, storage space, and color, while at the same time helping us rank the various possible colors too (eg. black, white, rose gold).
As you can probably guess from that description, Conjoint Analysis is a lot more complex than Best-Worst Scaling or the other comparative ranking methods explained in this guide. As such, it is also a lot more expensive — see this breakdown of the most popular conjoint analysis tools and their prices (the tools range from $2000 to $30,000 per year).
The good news is that we’re in the process of building a free conjoint analysis question on OpinionX, which will be available in June 2023. Once it’s ready, you’ll be able to see it in action here.
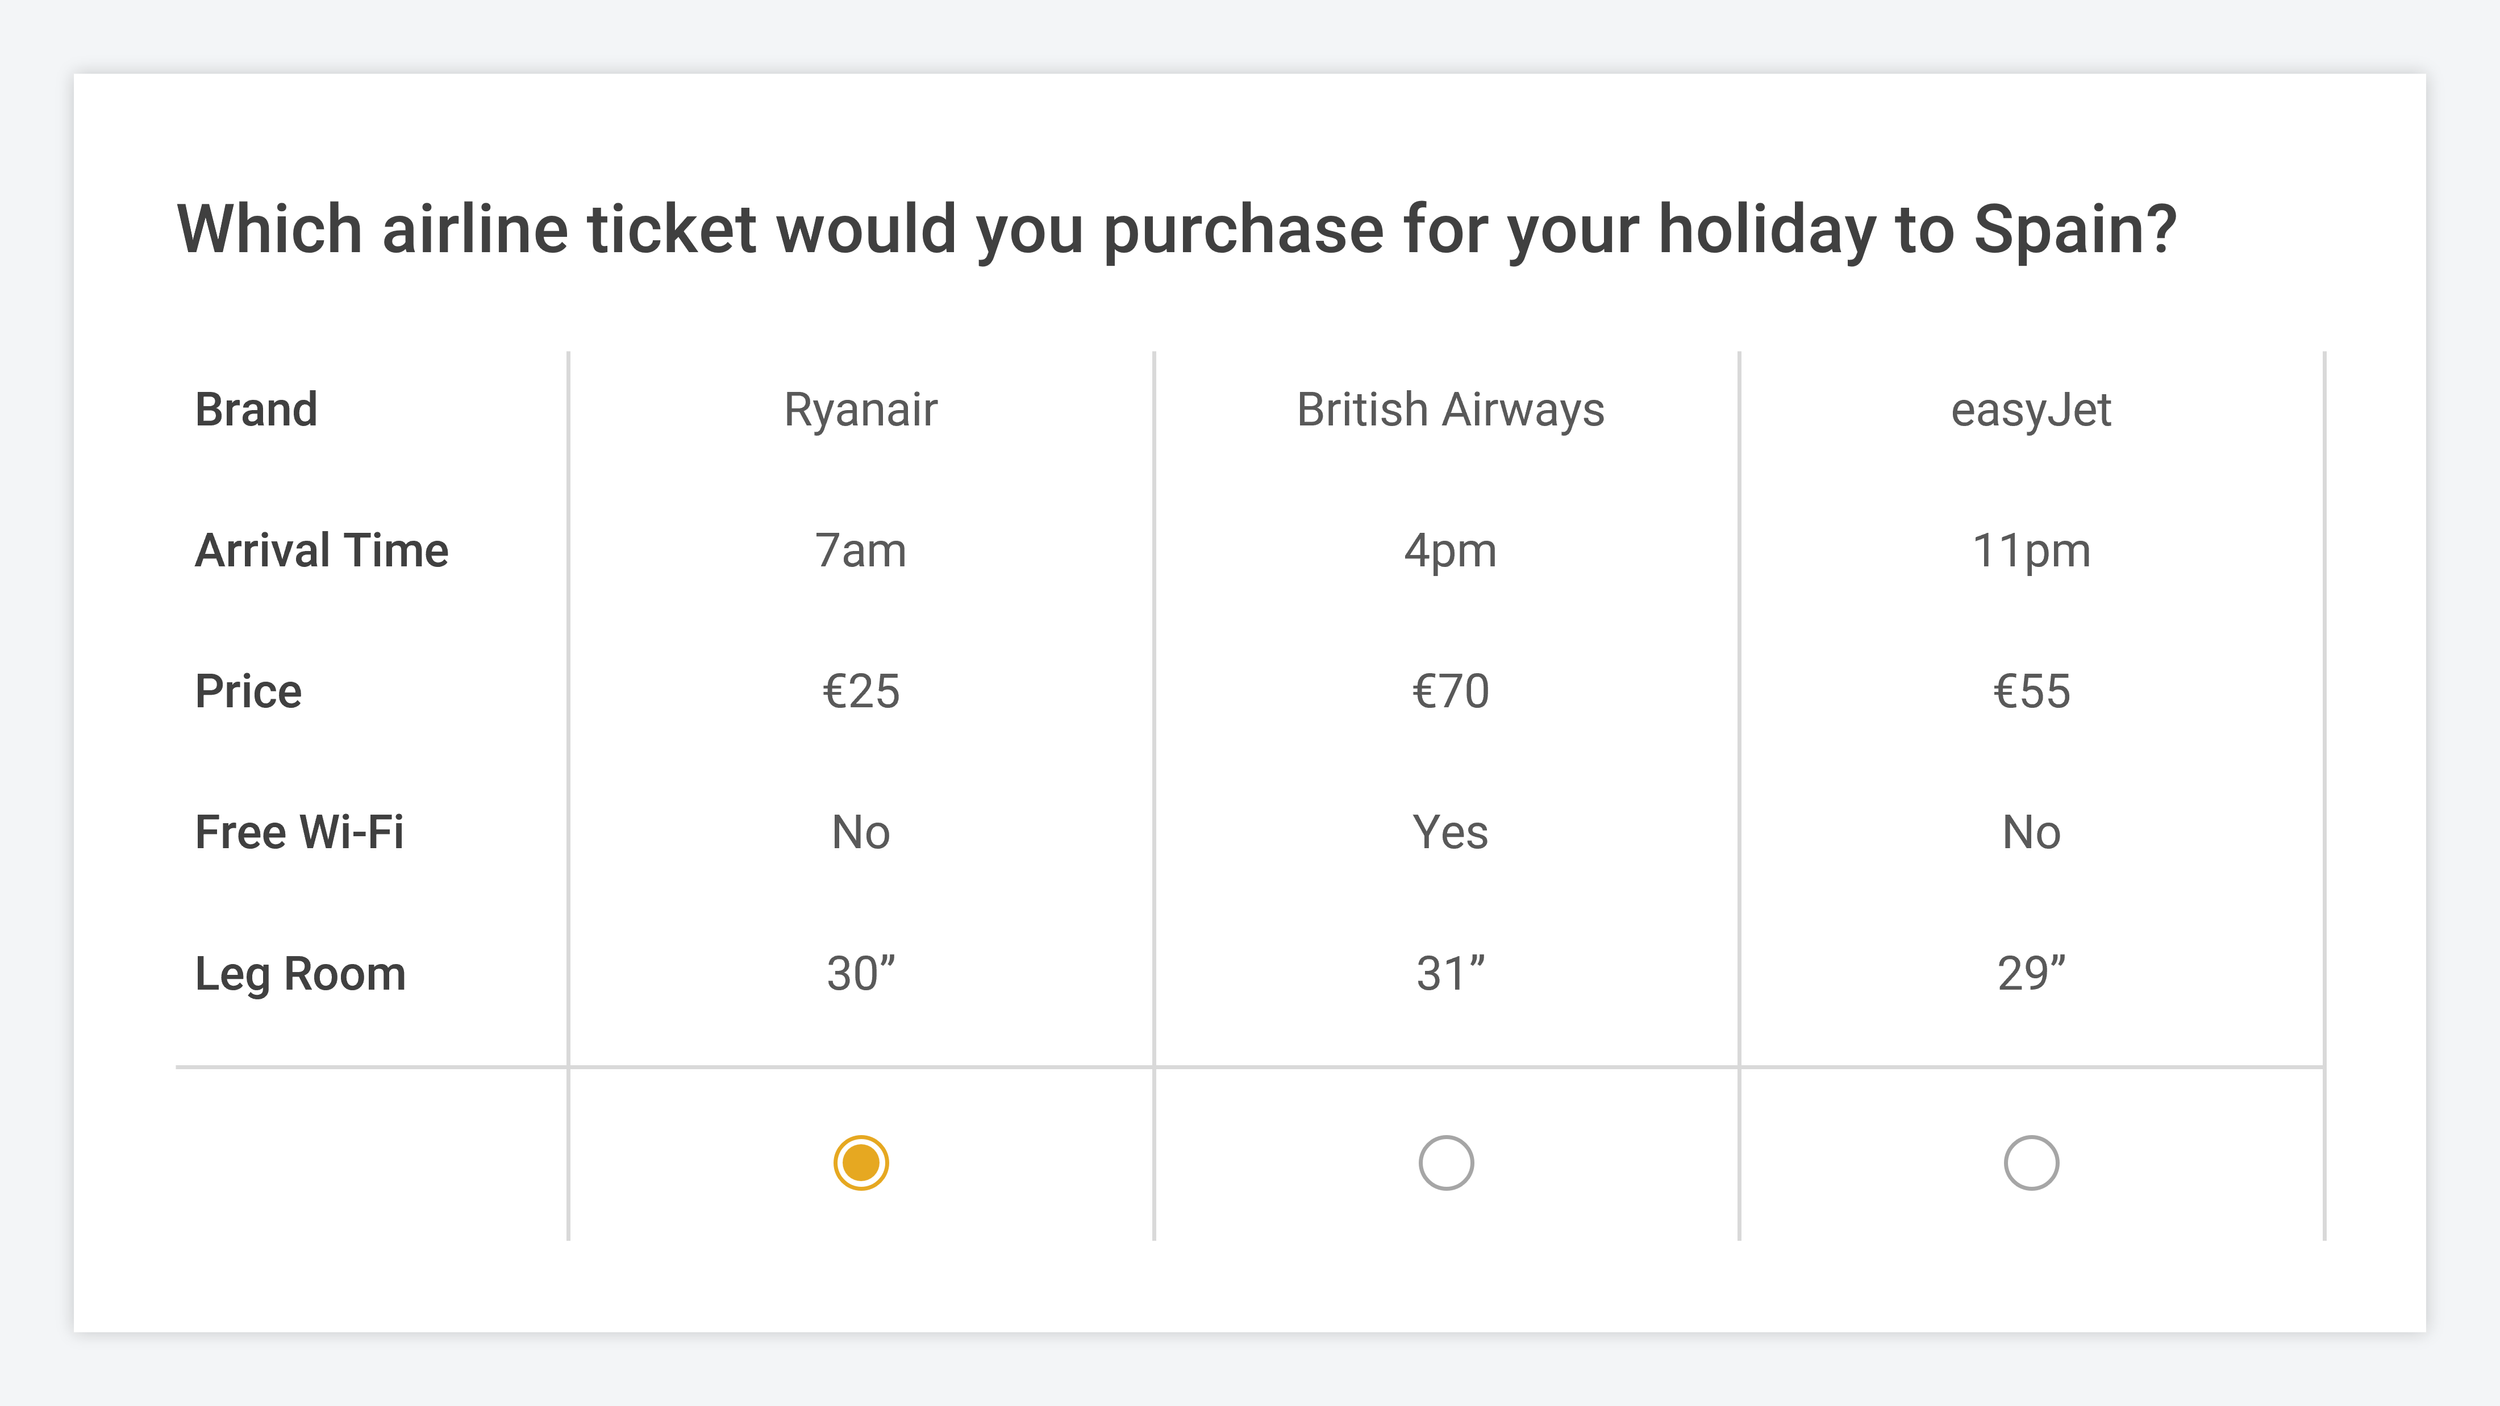
^ Example of a typical Conjoint Analysis question
— — —
Create A Free Best-Worst Scaling Survey
There is only one tool that offers free Best-Worst Scaling surveys and that is OpinionX. It comes with everything you need to get your first Best-Worst Scaling survey up and running — from the built-in calculator to make sure you get a robust sample size to the advanced segmentation for analyzing your Best/Worst results. Try it out today, for free, for your next ranking exercise, user research project, or prioritization sprint: